
USDJPY consolidates as inflation accelerates in Japan
After a sharp rise, the USDJPY pair is undergoing a correction as the market awaits action from the Japanese government. The rate currently stands at 163.00. Discover more in our analysis for 24 July 2026.
USDJPY forecast: key takeaways
- Inflation in Japan accelerated to 1.7% year-on-year in June
- Core inflation rose to 1.6%, up from 1.4% in May
- Persistent price growth is fuelling expectations of further BoJ policy tightening
- USDJPY forecast for 24 July 2026: 164.55
Fundamental analysis
The USDJPY rate has entered a correction after a sharp rise, although pressure on the Japanese yen remains elevated. Despite repeated warnings from the Japanese authorities about possible intervention in the currency market, traders have so far shown little reaction to these signals.
The market has largely ignored statements from Japan’s finance minister that the government is prepared to take decisive action in the event of excessive exchange rate fluctuations and reports that Bank of Japan officials may accelerate the normalisation of monetary policy. Meanwhile, expectations of more aggressive BoJ interest rate hikes are gradually rising amid persistent inflation.
According to the latest data, consumer prices in Japan rose by 1.7% year-on-year in June, reaching their fastest pace of growth in the past six months. Core inflation, which excludes food and is a key benchmark for the Bank of Japan, accelerated to 1.6% from 1.4% in May, reaching its highest level since March.
The main drivers of price growth were transport services, which rose by 2.4%, and food, which increased by 3.2%. However, the pace of food price growth slowed to its lowest level since July 2024, indicating a gradual easing of inflationary pressure in certain categories.
Technical outlook
The USDJPY rate is developing a corrective move within a Triangle pattern, but the price continues to hold above the EMA-65, indicating that buyers retain the upper hand in the short term. Today’s USDJPY forecast suggests a renewed upward move towards 164.55.
The indicators confirm the potential for further gains in the pair. The Stochastic Oscillator is approaching the ascending support line, signalling a recovery in buying pressure and the possibility of a new bullish momentum. A firm breakout above the 164.05 resistance level, followed by consolidation above it, would further confirm continued growth.
At the same time, the risks of a downward correction remain. A breakout below the lower boundary of the ascending channel and consolidation below 163.50 would signal weakening buying pressure and invalidate the current bullish scenario. In this case, the USDJPY pair could enter a deeper correction, opening the way for further declines.
USDJPY overview
- Asset: USDJPY
- Timeframe: M30 (intraday)
- Trend: bullish
- Key resistance levels: 164.05 and 164.65
- Key support levels: 163.70 and 163.15
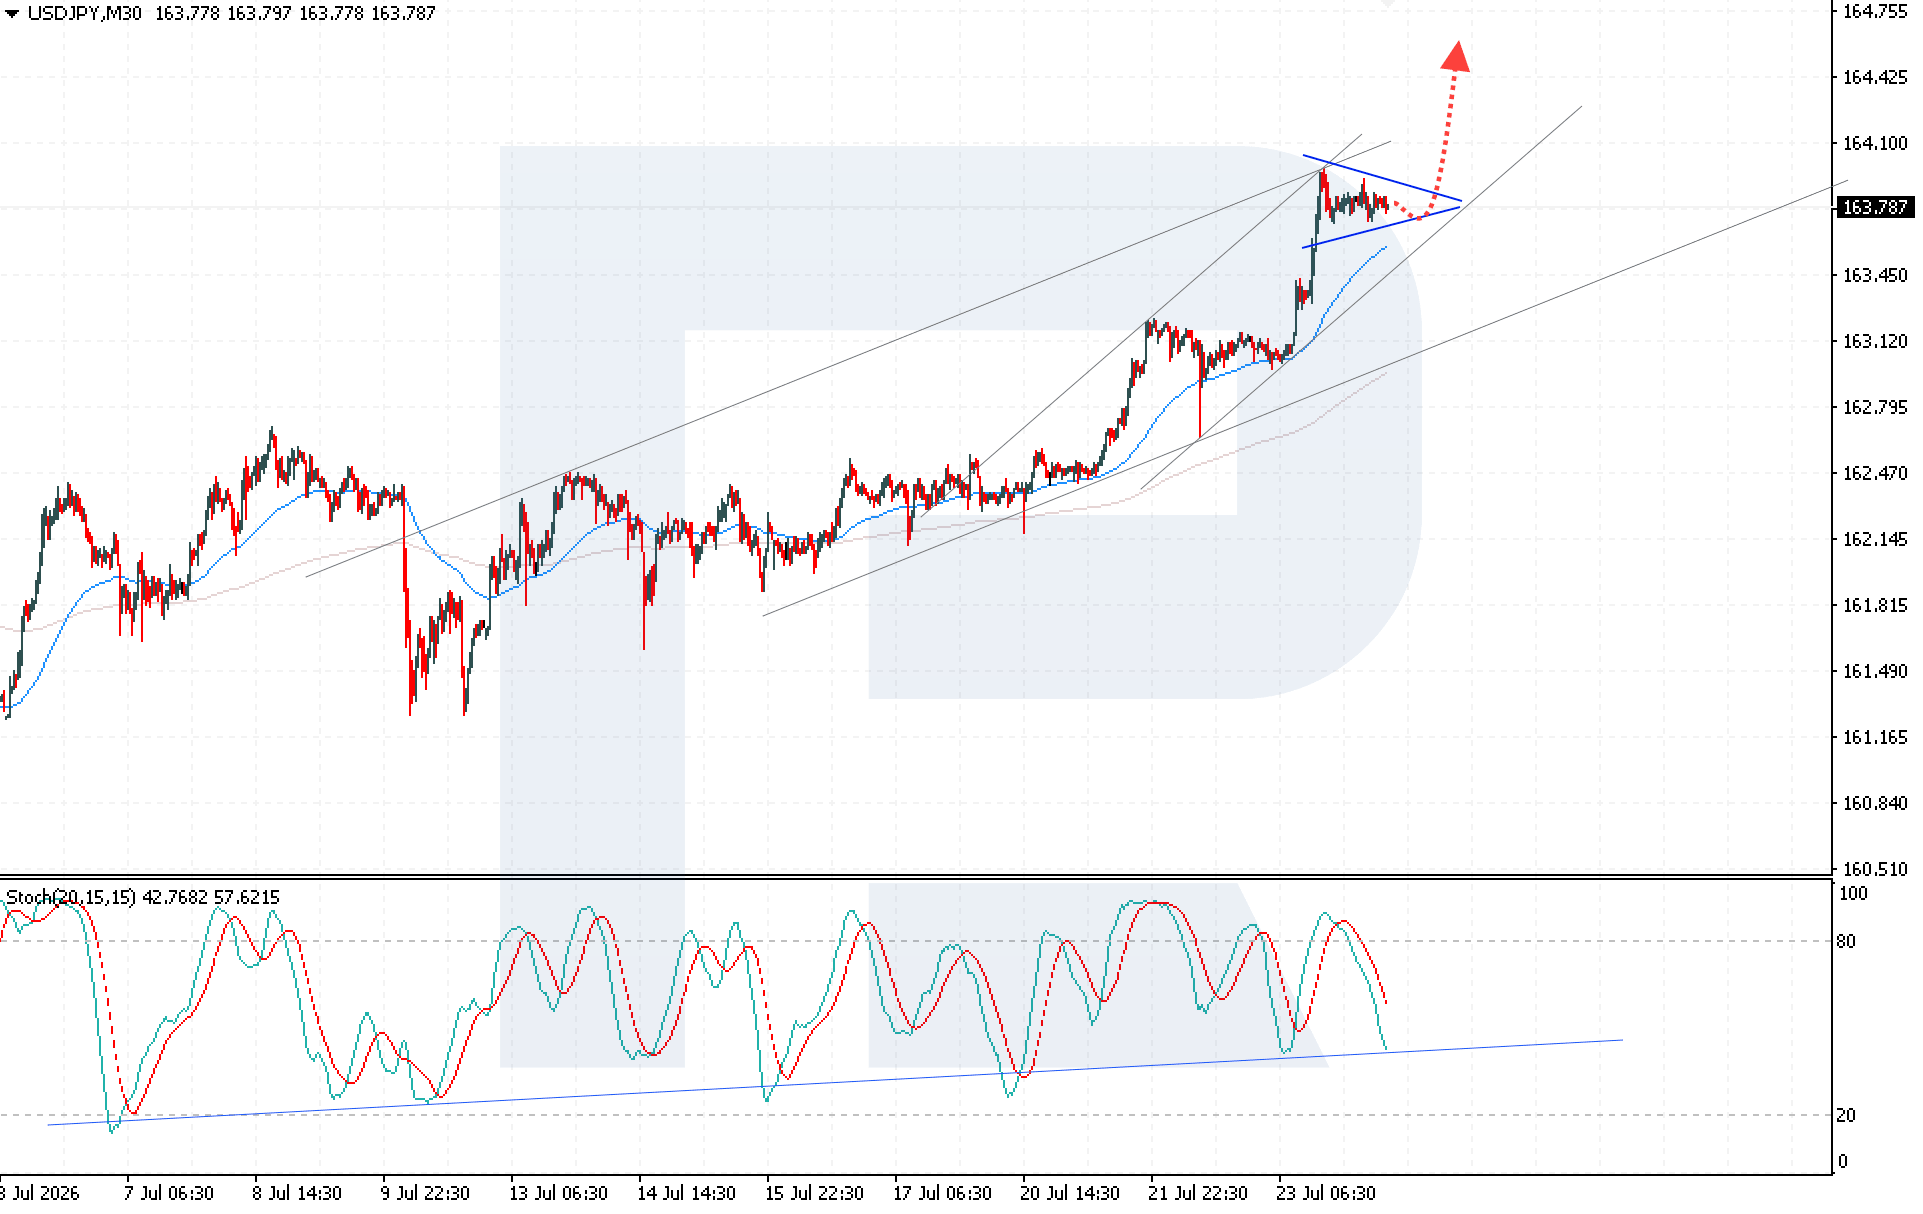
USDJPY trading scenarios for today
Main scenario (Buy Stop)
A breakout above the upper boundary of the Triangle pattern, followed by consolidation above 164.05, would indicate increased bullish pressure and a continued upward momentum towards 164.55.
- Take Profit: 164.55
- Stop Loss: 163.85
Alternative scenario (Sell Stop)
A breakout below the lower boundary of the bullish channel, followed by consolidation below 163.65, would indicate a continued bearish correction.
- Take Profit: 163.05
- Stop Loss: 163.95
Risk factors
The main risk to the USDJPY upside scenario remains rising expectations of tighter Bank of Japan policy, which could support the yen and limit further gains in the pair. Additional pressure on buyers may arise if the Japanese authorities intervene or if the price breaks below the 163.50 support level, increasing the likelihood of a deeper correction.
Summary
The USDJPY rate retains the potential to resume growth, as the technical picture suggests that buyers remain in control, and the price holding above the EMA-65 supports the bullish scenario. However, the pair’s further performance will depend on the market’s reaction to expectations of BoJ rate hikes and the ability of the price to consolidate above the 164.05 resistance level.
Editors’ picks
 EURUSD forecast 2026–2027: technical analysis, price levels & predictions
EURUSD has pulled back from the 2026 high of 1.1915 and is now trading near 1.1450 — below both EMA65 and EMA200 — with the active scenario shifting from bullish to bearish. The ECB raised rates to 2.40%, but the Fed holds at 3.75%, and US inflation (3.5%) continues to outpace the eurozone (2.8%). A confirmed break below 1.1280 opens the next downward wave toward 1.1080. We break down the key levels, three trading scenarios with entry triggers, and what Deutsche Bank, Morgan Stanley and UBS are forecasting for EURUSD in 2026.
 Gold (XAUUSD) forecast 2026: predictions based on fundamental and technical analysis
Gold has corrected over 25% from its all-time high of 5,597 USD and is now trading near 4,100 USD — testing a critical support zone. Is this the bottom, or will the downtrend continue? We break down the key levels (support 3,920 USD, breakout trigger 4,500 USD), three trading scenarios with entry levels, and what J.P. Morgan, Goldman Sachs and Deutsche Bank are forecasting for gold in 2026.
Forecasts presented in this section only reflect the author’s private opinion and should not be considered as guidance for trading. RoboForex bears no responsibility for trading results based on trading recommendations described in these analytical reviews.