
Yen under pressure again: USDJPY consolidates before the trend resumes
Based on the published US inflation data, the fundamental backdrop for the USDJPY pair has turned moderately negative, with the rate currently at 159.73. Find out more in our analysis for 18 August 2026.
USDJPY forecast: key takeaways
- Japan’s GDP grew by 0.3% in Q2 2026
- US PPI was unchanged in July compared with June
- The risk of intervention remains
- USDJPY forecast for 18 August 2026: 160.85
Fundamental analysis
Fundamental analysis for 18 August 2026 shows that the yen did not react to Japan’s Q2 2026 GDP data.
Japan’s Q2 GDP figures create a mixed fundamental backdrop for the USDJPY pair. The economy grew by 0.3% quarter-on-quarter, below a forecast of 0.5%, while annual growth was 1.1%. The economy therefore continues to expand, but the pace of growth was noticeably weaker than expected.
Theoretically, the immediate reaction to weaker GDP should be positive for the USDJPY rate, meaning a weaker yen. Slower economic growth reduces the Bank of Japan’s scope for rapid interest rate hikes.
However, the impact of GDP on the yen is currently limited. The market is far more focused on inflation and the Bank of Japan’s future actions. At its latest meeting, the Bank of Japan kept the short-term rate at around 1.0%, with one board member already advocating for a hike to 1.25%.
The USDJPY forecast for 18 August 2026 remains bearish for the US dollar. Despite weak Japanese GDP data, the yen showed virtually no negative reaction and even strengthened slightly. This is an important signal: the market currently views the Bank of Japan’s outlook, government actions, and weaker expectations for Federal Reserve rates as more significant factors than weak quarterly GDP.
Technical outlook
On the H4 chart, the USDJPY rate has formed a sideways channel. The resistance level is located at 159.55, with support at 158.60. On the D1 chart, the resistance level lies at 163.95, while support has formed at 155.20. Further JPY strengthening towards 156.65 is the most likely scenario.
In an alternative scenario, the USDJPY correction could continue, and the price may break above the H4 resistance level and rise to 160.85.
USDJPY overview
- Asset: USDJPY
- Timeframe: H4 (intraday)
- Trend: bearish
- Key resistance levels: 159.55 and 163.95
- Key support levels: 158.60 and 155.20
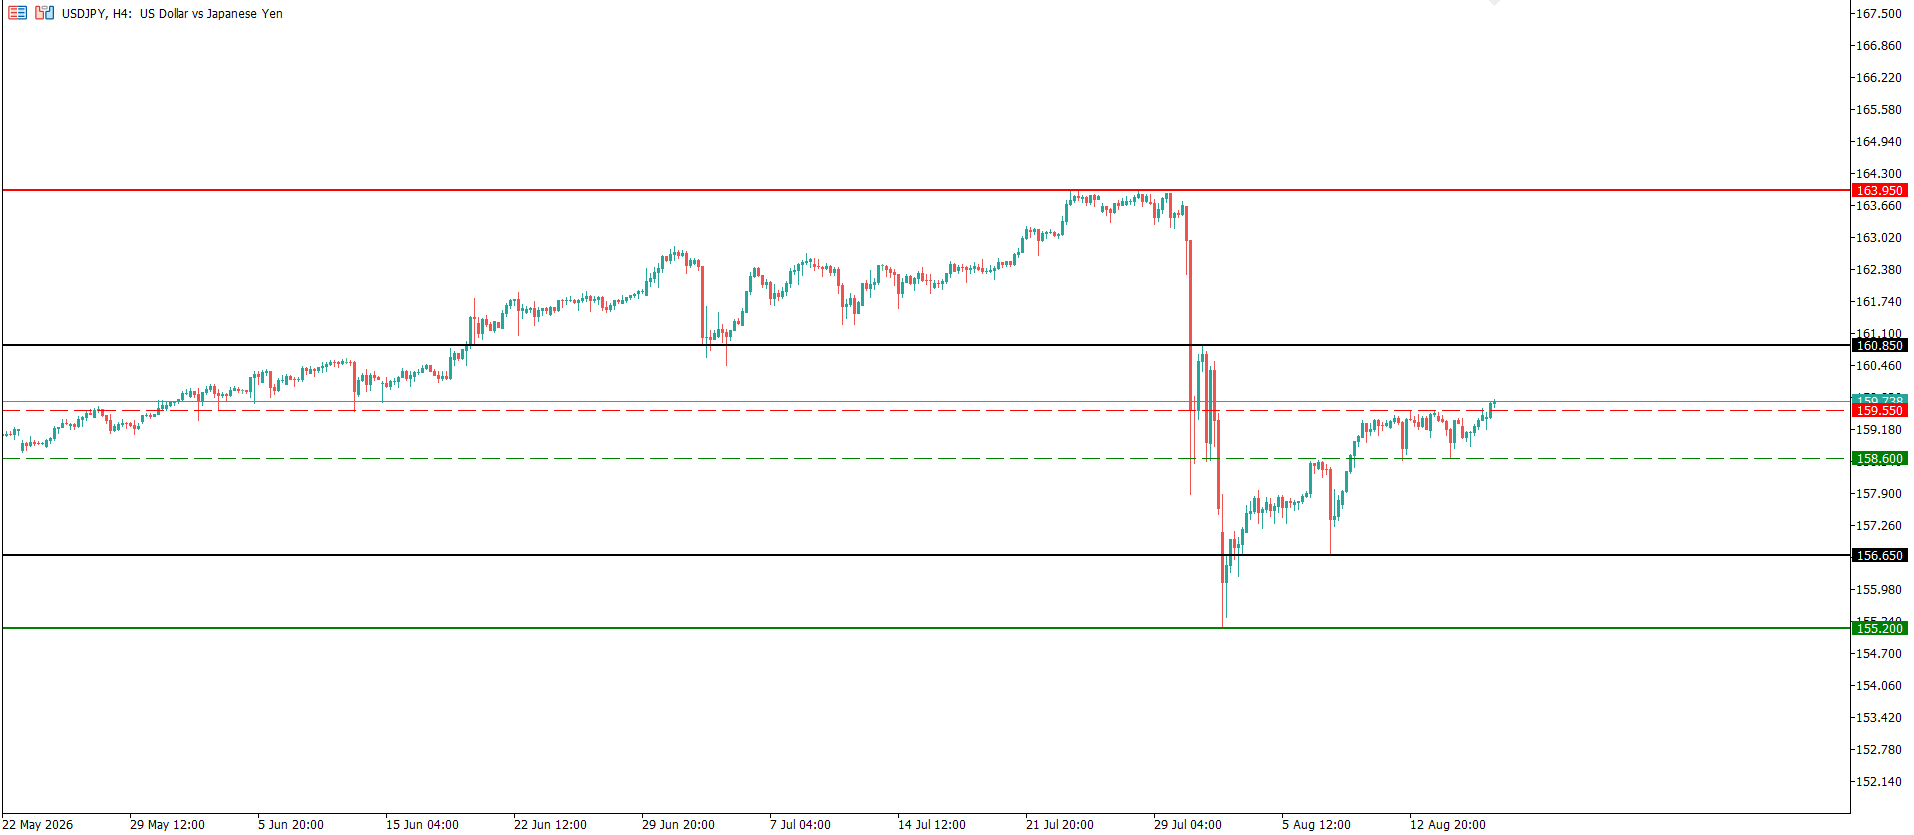
USDJPY trading scenarios for today
Main scenario (Buy Limit)
The price has broken above the 159.55 resistance level, increasing the likelihood of a retest of this level.
- Take Profit: 160.85
- Stop Loss: 159.10
Alternative scenario (Sell Stop)
If the price breaks below the 158.60 support level, the yen will resume strengthening.
- Take Profit: 156.60
- Stop Loss: 158.15
Risk factors
The USDJPY pair retains upside potential, primarily due to the interest rate differential between the Bank of Japan and the US Federal Reserve. However, the possibility of renewed intervention by the Japanese authorities in the currency market remains a significant risk factor.
Summary
The yen continues to trade sideways, although the broader downtrend prevails. USDJPY technical analysis suggests a corrective decline towards 156.65.
Editors’ picks
 EURUSD forecast 2026–2027: technical analysis, price levels & predictions
EURUSD has pulled back from the 2026 high of 1.1915 and is now trading near 1.1450 — below both EMA65 and EMA200 — with the active scenario shifting from bullish to bearish. The ECB raised rates to 2.40%, but the Fed holds at 3.75%, and US inflation (3.5%) continues to outpace the eurozone (2.8%). A confirmed break below 1.1280 opens the next downward wave toward 1.1080. We break down the key levels, three trading scenarios with entry triggers, and what Deutsche Bank, Morgan Stanley and UBS are forecasting for EURUSD in 2026.
 Gold (XAUUSD) forecast 2026: predictions based on fundamental and technical analysis
Gold has corrected over 25% from its all-time high of 5,597 USD and is now trading near 4,100 USD — testing a critical support zone. Is this the bottom, or will the downtrend continue? We break down the key levels (support 3,920 USD, breakout trigger 4,500 USD), three trading scenarios with entry levels, and what J.P. Morgan, Goldman Sachs and Deutsche Bank are forecasting for gold in 2026.
Forecasts presented in this section only reflect the author’s private opinion and should not be considered as guidance for trading. RoboForex bears no responsibility for trading results based on trading recommendations described in these analytical reviews.