
JP 225 resumes decline: index falls more than 6%
The JP 225 fell by more than 6%, but the broader trend remains bullish, with a weaker dollar supporting stocks.
JP 225 forecast: key takeaways
- Japan’s GDP grew by 0.3% in Q2 2026, falling short of a forecast of 0.5%
- The data has a moderately negative impact on the JP 225
JP 225 fundamental analysis
Japan’s GDP growth in Q2 2026 came in below expectations: real GDP increased by 0.3% quarter-on-quarter, missing expectations for 0.5%, while growth in the previous quarter was 0.5%. On an annualised basis, the economy expanded by approximately 1.1%. However, the composition of the data looks less favourable than the positive GDP figure itself: domestic demand contributed around −0.2 percentage points, while net exports added approximately +0.5 percentage points.
For the JP 225, these figures are initially a moderately negative factor, as they point to slowing economic activity and weak domestic demand. The decline in corporate investment is particularly important: the stock market may perceive this as a sign that Japanese companies are becoming more cautious about expanding production and capital expenditure.
JP 225 technical analysis
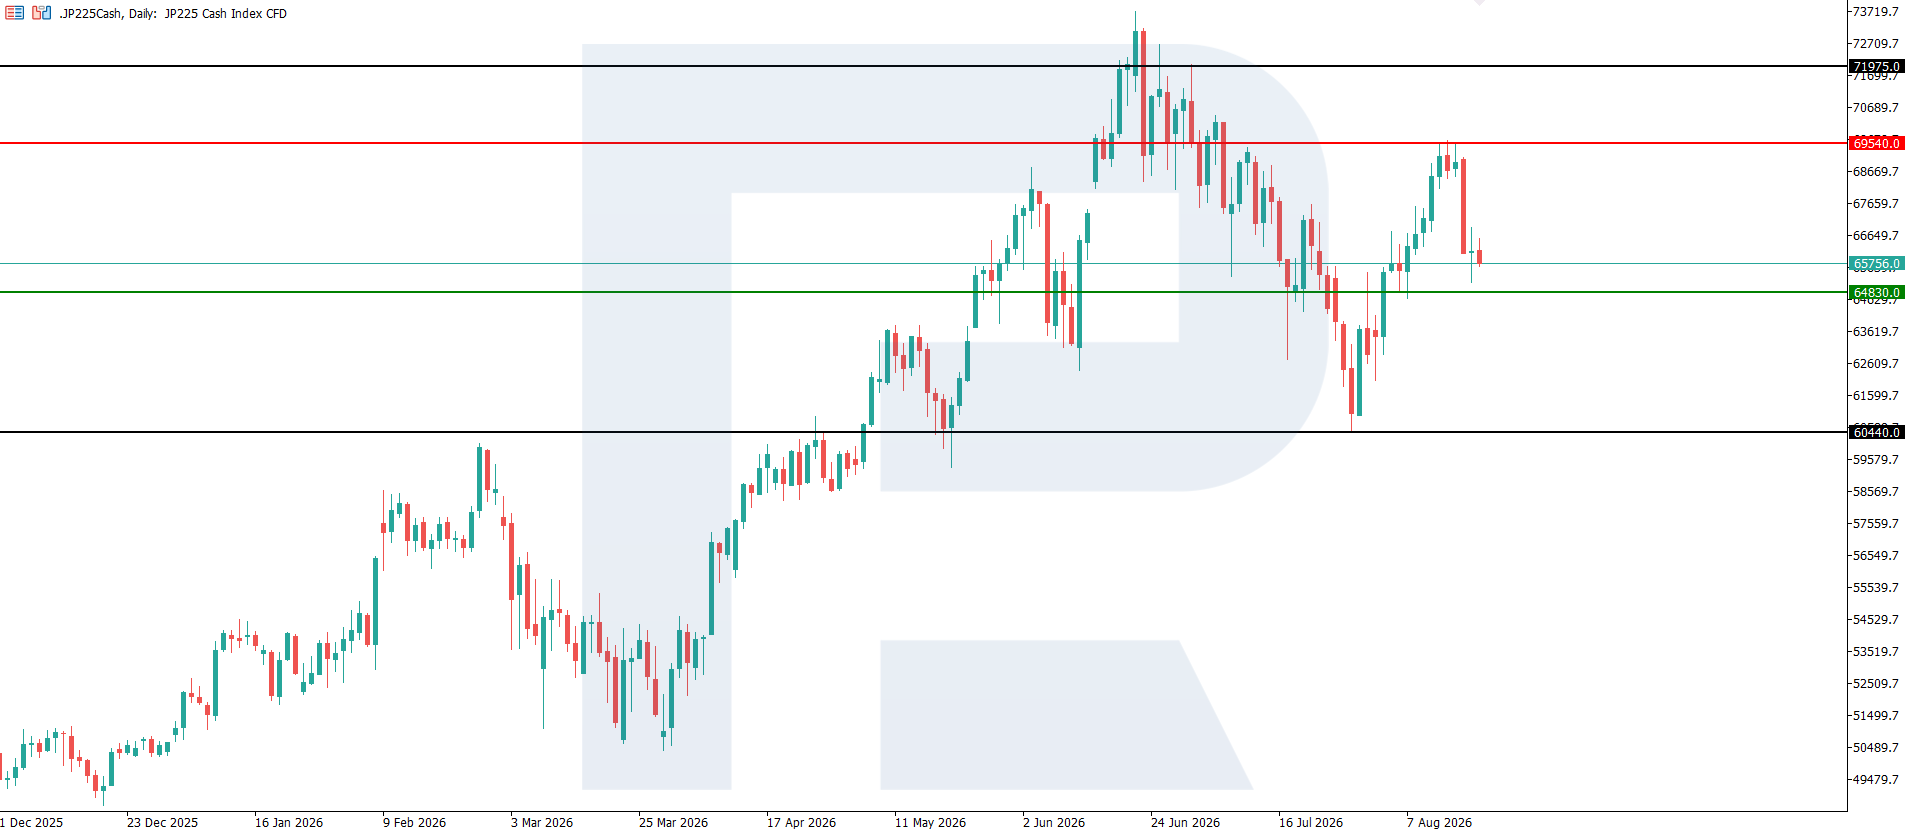
The JP 225 stock index dropped by more than 6%. However, the broader trend remains bullish. The resistance level has formed at 69,540.00, while support is located at 64,830.00. Only a breakout below the latter would signal the start of a downtrend. If the uptrend continues, the upside target could be 71,975.00.
The JP 225 price forecast outlines the following scenarios:
- Pessimistic JP 225 scenario: a breakout below the 64,830.0 support level could send the index down to 60,440.0. Recommended Stop-loss: 64,930.0
- Optimistic JP 225 scenario: a breakout above the 69,540.0 resistance level could propel the index up to 71,975.0. Recommended Stop-loss: 71,875.0
Expiry date: 27 August 2026
Summary
The GDP release should be viewed as moderately negative for the Japanese economy, but not unequivocally negative for the JP 225. Weak growth, the lack of a noticeable increase in consumption, and a decline in corporate investment may limit the market’s upside potential and weigh on domestically focused companies. However, the data may also reduce the likelihood of rapid monetary policy tightening by the Bank of Japan and put pressure on the yen. Technical analysis of the JP 225 suggests a rise towards 71,975.0.
Editors’ picks
 EURUSD forecast 2026–2027: technical analysis, price levels & predictions
EURUSD has pulled back from the 2026 high of 1.1915 and is now trading near 1.1450 — below both EMA65 and EMA200 — with the active scenario shifting from bullish to bearish. The ECB raised rates to 2.40%, but the Fed holds at 3.75%, and US inflation (3.5%) continues to outpace the eurozone (2.8%). A confirmed break below 1.1280 opens the next downward wave toward 1.1080. We break down the key levels, three trading scenarios with entry triggers, and what Deutsche Bank, Morgan Stanley and UBS are forecasting for EURUSD in 2026.
 Gold (XAUUSD) forecast 2026: predictions based on fundamental and technical analysis
Gold has corrected over 25% from its all-time high of 5,597 USD and is now trading near 4,100 USD — testing a critical support zone. Is this the bottom, or will the downtrend continue? We break down the key levels (support 3,920 USD, breakout trigger 4,500 USD), three trading scenarios with entry levels, and what J.P. Morgan, Goldman Sachs and Deutsche Bank are forecasting for gold in 2026.
Forecasts presented in this section only reflect the author’s private opinion and should not be considered as guidance for trading. RoboForex bears no responsibility for trading results based on trading recommendations described in these analytical reviews.