US 30 index forecast: growth momentum has weakened, but the uptrend remains
The US 30 index is trading near its all-time high, but the likelihood of a downward correction is increasing. The US 30 forecast for today is positive.
US 30 forecast: key takeaways
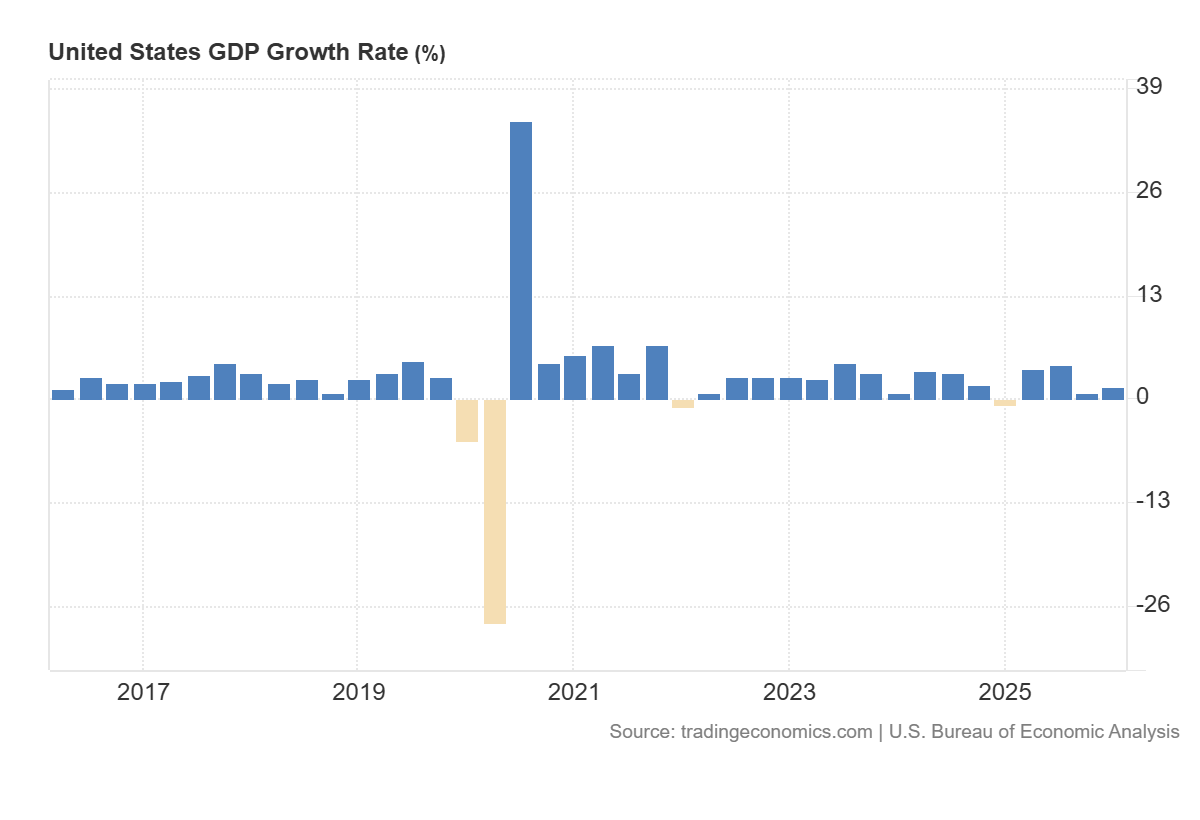
- Recent data: US GDP rose by 1.6% year-over-year in Q1 2026
- Market impact: the data is negative for the stock market
US 30 fundamental analysis
US quarterly GDP data came in below expectations, showing actual growth of 1.6%, below the forecast of 2.0% but up from the previous 0.5%. For the US 30 index, this is a mixed signal, but in the short term, it is more likely to have a moderately negative effect. On the one hand, the US economy is still expanding, and the fact that the reading is higher than the previous one suggests growth remains positive. On the other hand, a lower-than-expected figure indicates the pace of expansion was weaker than the market expected. For investors, this may signal that corporate earnings in the coming quarters could grow less confidently, especially for companies heavily dependent on domestic demand.
For the US 30 index, which includes major US industrial, financial, consumer, and technology companies, softer GDP could reduce appetite for more cyclical stocks. Investors may become more cautious about the prospects of companies whose revenues are directly tied to economic activity, business capital expenditures, and consumer spending.
US 30 technical analysis
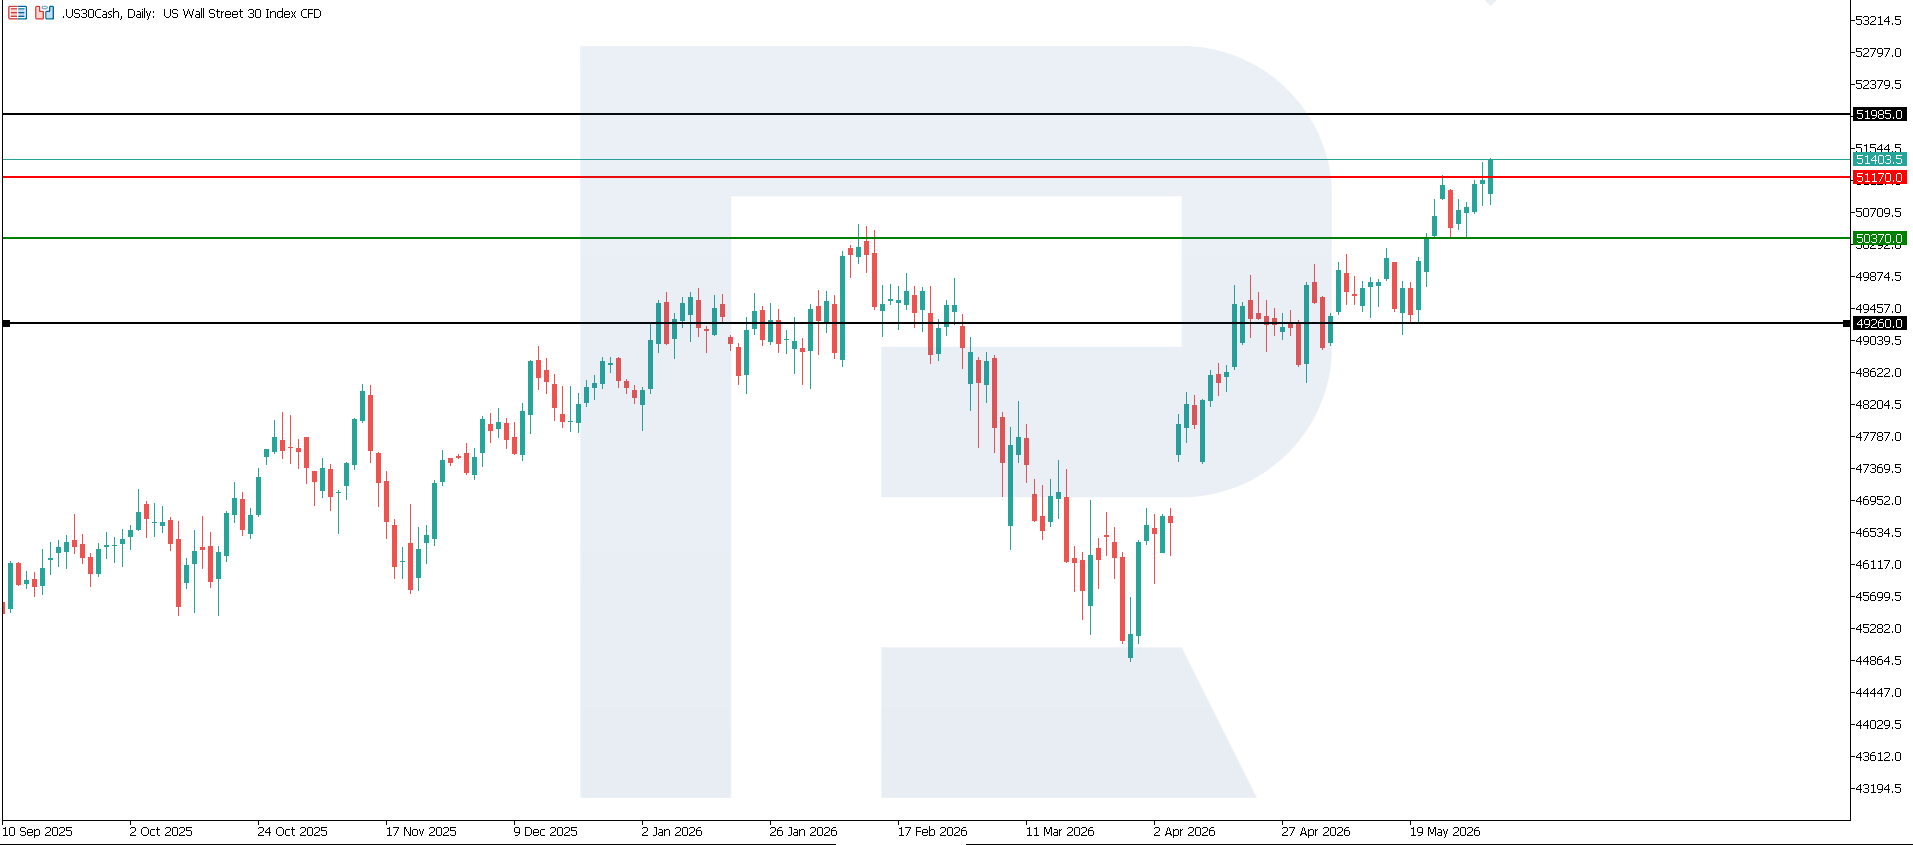
The US 30 index continued to reach new all-time highs amid a rather weak uptrend. The nearest support level has formed at 50,370.0, while the 51,170.0 resistance level has been broken. At the moment, prices are undergoing a correction. If the current momentum persists, the nearest upside target could be 51,985.0.
The US 30 price forecast considers the following scenarios:
- Pessimistic US 30 scenario: a breakout below the 50,370.0 support level could send the index down to 49,260.0
- Optimistic US 30 scenario: if prices consolidate above the breached 51,170.0 resistance level, the index could climb to 51,985.0
Summary
Overall, weaker-than-expected GDP data signals a moderate slowdown in the US economic momentum. For the US 30 index, this could create short-term pressure, especially on industrials, financials, and consumer cyclicals. However, if investors focus on potential Federal Reserve policy easing, the negative reaction may be limited. The baseline scenario for the market is increased volatility and a more selective approach to equities. The nearest upside target could be 51,985.0 .
Editors’ picks
 EURUSD 2026-2027 forecast: key market trends and future predictions
This article provides the EURUSD forecast for 2026 and 2027 and highlights the main factors determining the direction of the pair’s movements. We will apply technical analysis, take into account the opinions of leading experts, large banks, and financial institutions, and study AI-based forecasts. This comprehensive insight into EURUSD predictions should help investors and traders make informed decisions.
 Gold (XAUUSD) forecast 2026 and beyond: expert insights, price predictions, and analysis
Dive deep into the Gold (XAUUSD) price outlook for 2026 and beyond, combining technical analysis, expert forecasts, and key macroeconomic factors. It explains the drivers behind gold’s recent surge, explores potential scenarios including a move toward 4,500 to 5,000 USD per ounce, and highlights why the metal remains a strong hedge during global uncertainty.
Forecasts presented in this section only reflect the author’s private opinion and should not be considered as guidance for trading. RoboForex bears no responsibility for trading results based on trading recommendations described in these analytical reviews.