
US 30 index forecast: the index is testing the support level
The US 30 index is testing the support level as part of a correction. The US 30 forecast for today is positive.
US 30 forecast: key takeaways
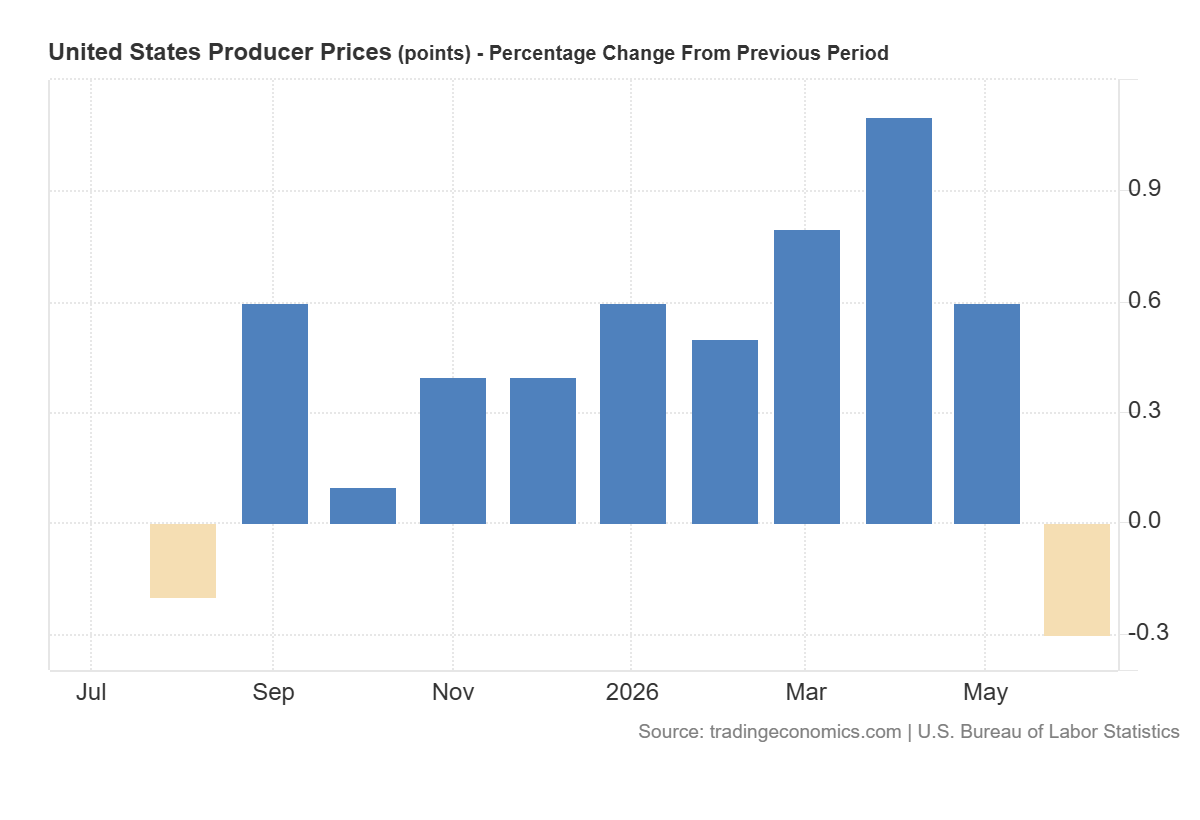
- Recent data: US PPI declined by 0.3% in June 2026
- Market impact: the data has a positive impact on the stock market
US 30 fundamental analysis
A 0.3% monthly decline in the US Producer Price Index, compared to the expected flat reading, and following a 0.6% increase in May, is generally a favourable signal for the US 30 index. The result came in noticeably weaker than expected and indicates easing price pressures at the producer level. This is important for the stock market, as changes in the cost of raw materials, energy, transportation, and other production resources eventually affect companies’ expenses, profits, and consumer inflation. The slower companies’ costs rise, the less likely companies will be forced to significantly raise final prices.
The initial reaction of the US 30 index to such data could be positive. Lower producer prices could bolster expectations of a more accommodative monetary policy from the Federal Reserve. If investors conclude that inflationary pressure is gradually easing, US government bond yields may decline, while the appeal of stocks relative to debt instruments may increase. This is especially favourable for large companies with stable cash flows and significant debt obligations.
US 30 technical analysis
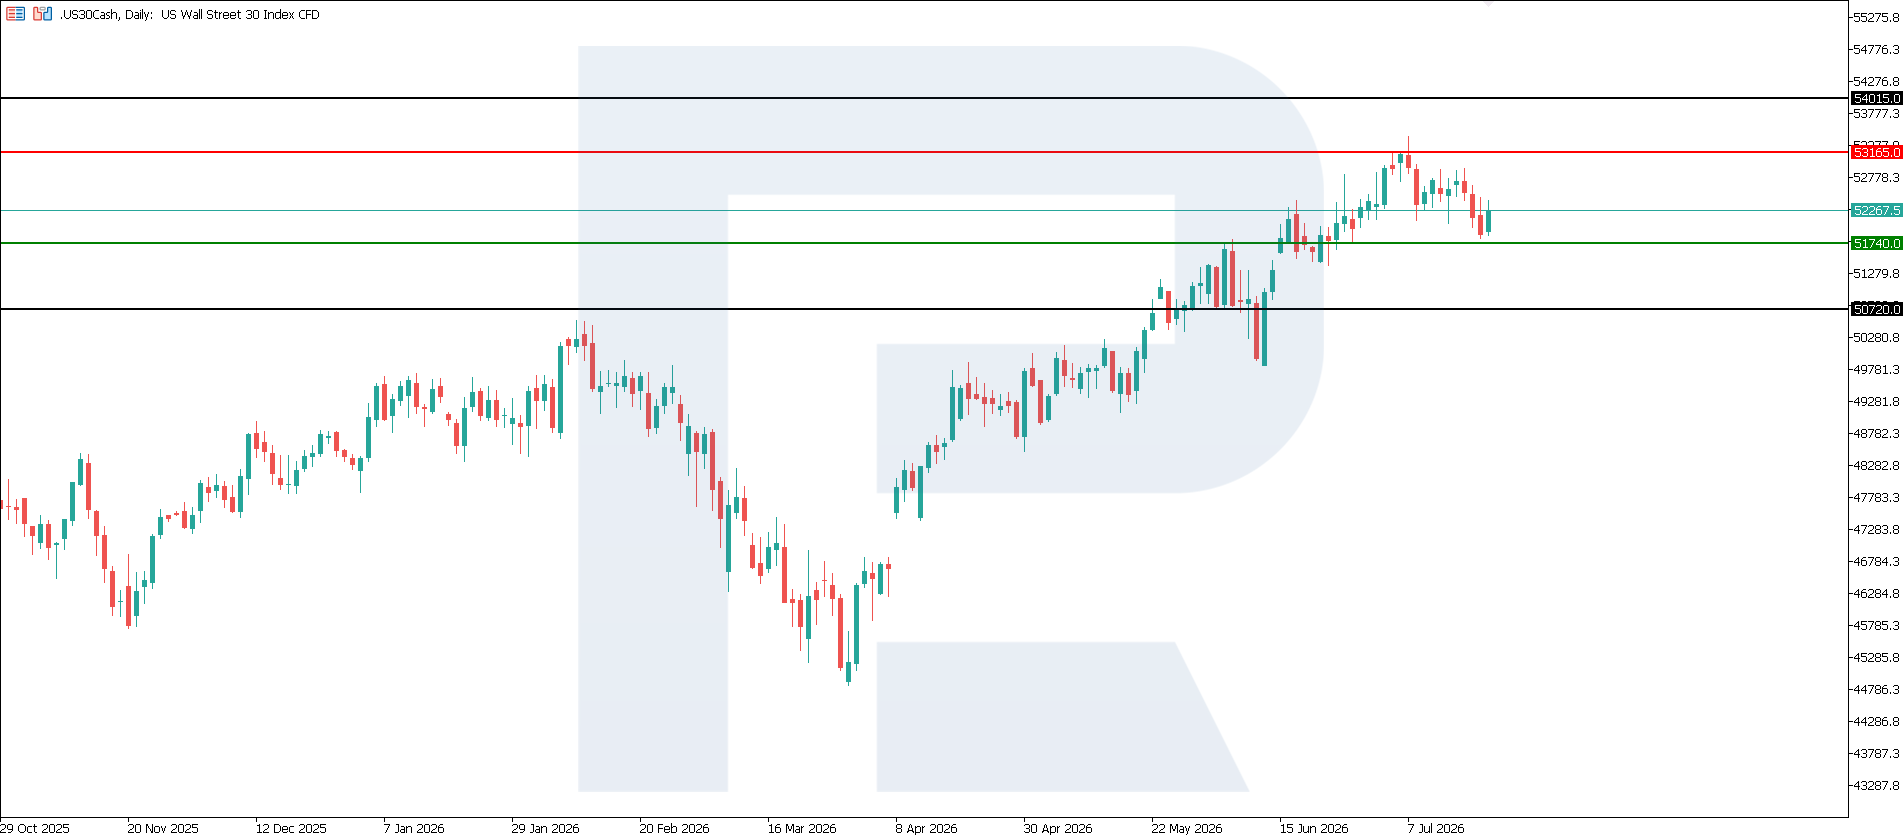
The US 30 index approached the key support level, and a breakout below it could reverse the current trend. The main support level is located at 51,740.0, while the nearest resistance formed near 53,165.0. Quotes are currently testing the support area, so further movement will depend on buyers’ ability to hold this level. If positive momentum resumes and the index consolidates above the resistance level, the next upside target could be 54,015.0.
The US 30 price forecast outlines the following scenarios:
- Pessimistic US 30 scenario: a breakout below the 51,740.0 support level could send the index down to 50,720.0
- Optimistic US 30 scenario: a breakout above the 53,165.0 resistance level could boost the index up to 54,015.0
Summary
Overall, the published data is moderately positive for the US 30 index and the US stock market, as it reduces concerns about further acceleration in producer inflation and creates conditions for growth in industrial, consumer, transport, and technology stocks. The energy sector may prove the most vulnerable due to the sharp decline in fuel and oil prices. However, high annual growth in producer prices and the continued rise in services costs mean that it would be premature to say that inflationary risks have been completely eliminated. The nearest upside target could be 54,015.0.
Editors’ picks
 EURUSD forecast 2026–2027: technical analysis, price levels & predictions
EURUSD has pulled back from the 2026 high of 1.1915 and is now trading near 1.1450 — below both EMA65 and EMA200 — with the active scenario shifting from bullish to bearish. The ECB raised rates to 2.40%, but the Fed holds at 3.75%, and US inflation (3.5%) continues to outpace the eurozone (2.8%). A confirmed break below 1.1280 opens the next downward wave toward 1.1080. We break down the key levels, three trading scenarios with entry triggers, and what Deutsche Bank, Morgan Stanley and UBS are forecasting for EURUSD in 2026.
 Gold (XAUUSD) forecast 2026: predictions based on fundamental and technical analysis
Gold has corrected over 25% from its all-time high of 5,597 USD and is now trading near 4,100 USD — testing a critical support zone. Is this the bottom, or will the downtrend continue? We break down the key levels (support 3,920 USD, breakout trigger 4,500 USD), three trading scenarios with entry levels, and what J.P. Morgan, Goldman Sachs and Deutsche Bank are forecasting for gold in 2026.
Forecasts presented in this section only reflect the author’s private opinion and should not be considered as guidance for trading. RoboForex bears no responsibility for trading results based on trading recommendations described in these analytical reviews.