US 500 forecast: the index hits a new all-time high
News about a possible end to the conflict between the US and Iran pushed the US 500 index higher. The US 500 forecast for today is positive.
US 500 forecast: key takeaways
- Recent data: US preliminary manufacturing PMI came in at 55.3 in May
- Market impact: this data is moderately positive for the US stock market
US 500 fundamental analysis
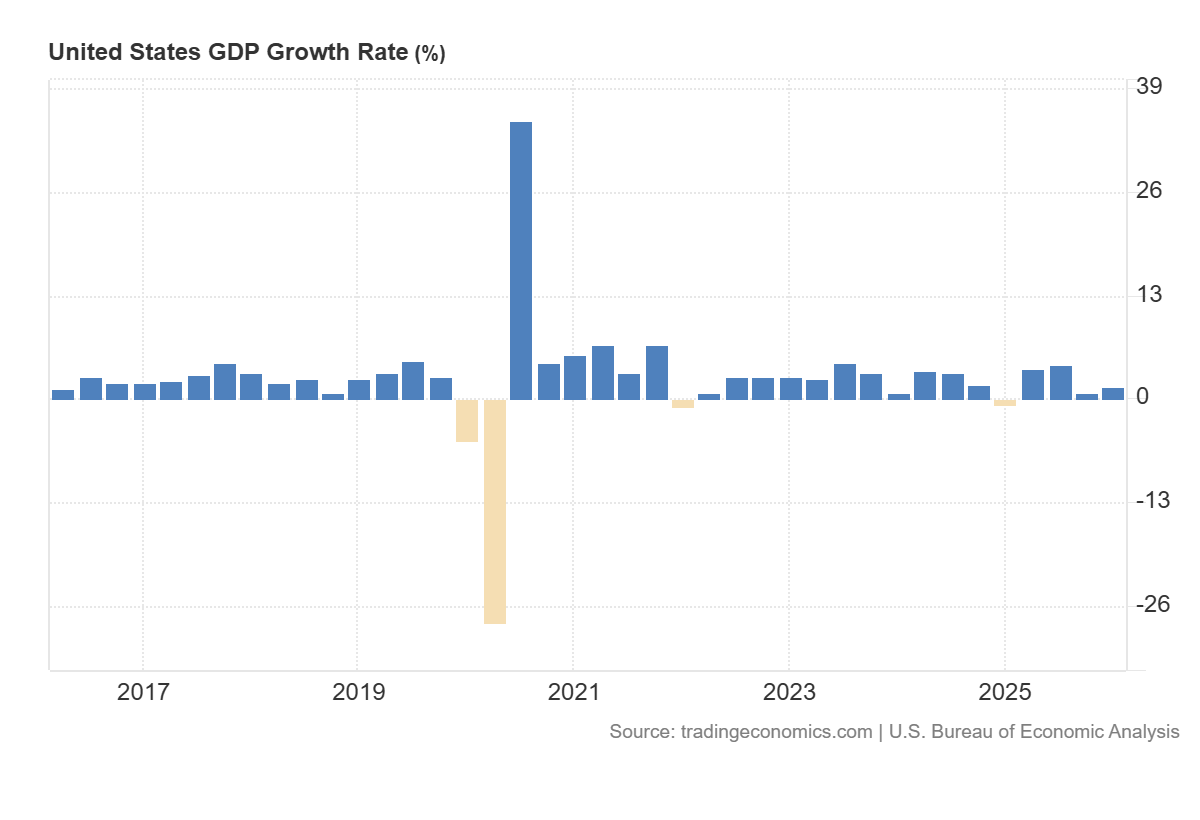
The release of quarterly US GDP data, showing actual growth of 1.6% versus the forecast of 2.0%, could be perceived by the market as a moderately negative signal for the US 500 index. The main reason is that the US economy is growing more slowly than expected, which reduces investor confidence in the sustainability of corporate earnings. For a broad stock index that reflects the performance of the largest US companies, such a figure suggests that demand in the economy may be weaker than previously expected. This could lead to a cautious market reaction, especially if investors begin to revise revenue and earnings expectations for the coming quarters.
For the US 500 index, the effect could be mixed. On the one hand, weaker-than-expected GDP growth indicates an economic slowdown, which typically pressures shares of companies sensitive to the business cycle. Investors may worry that consumers and businesses will spend more cautiously, meaning corporate profit growth could slow. In such a situation, the index may face short-term pressure, especially if the market had already priced in stronger economic growth ahead of the data release.
US 500 technical analysis
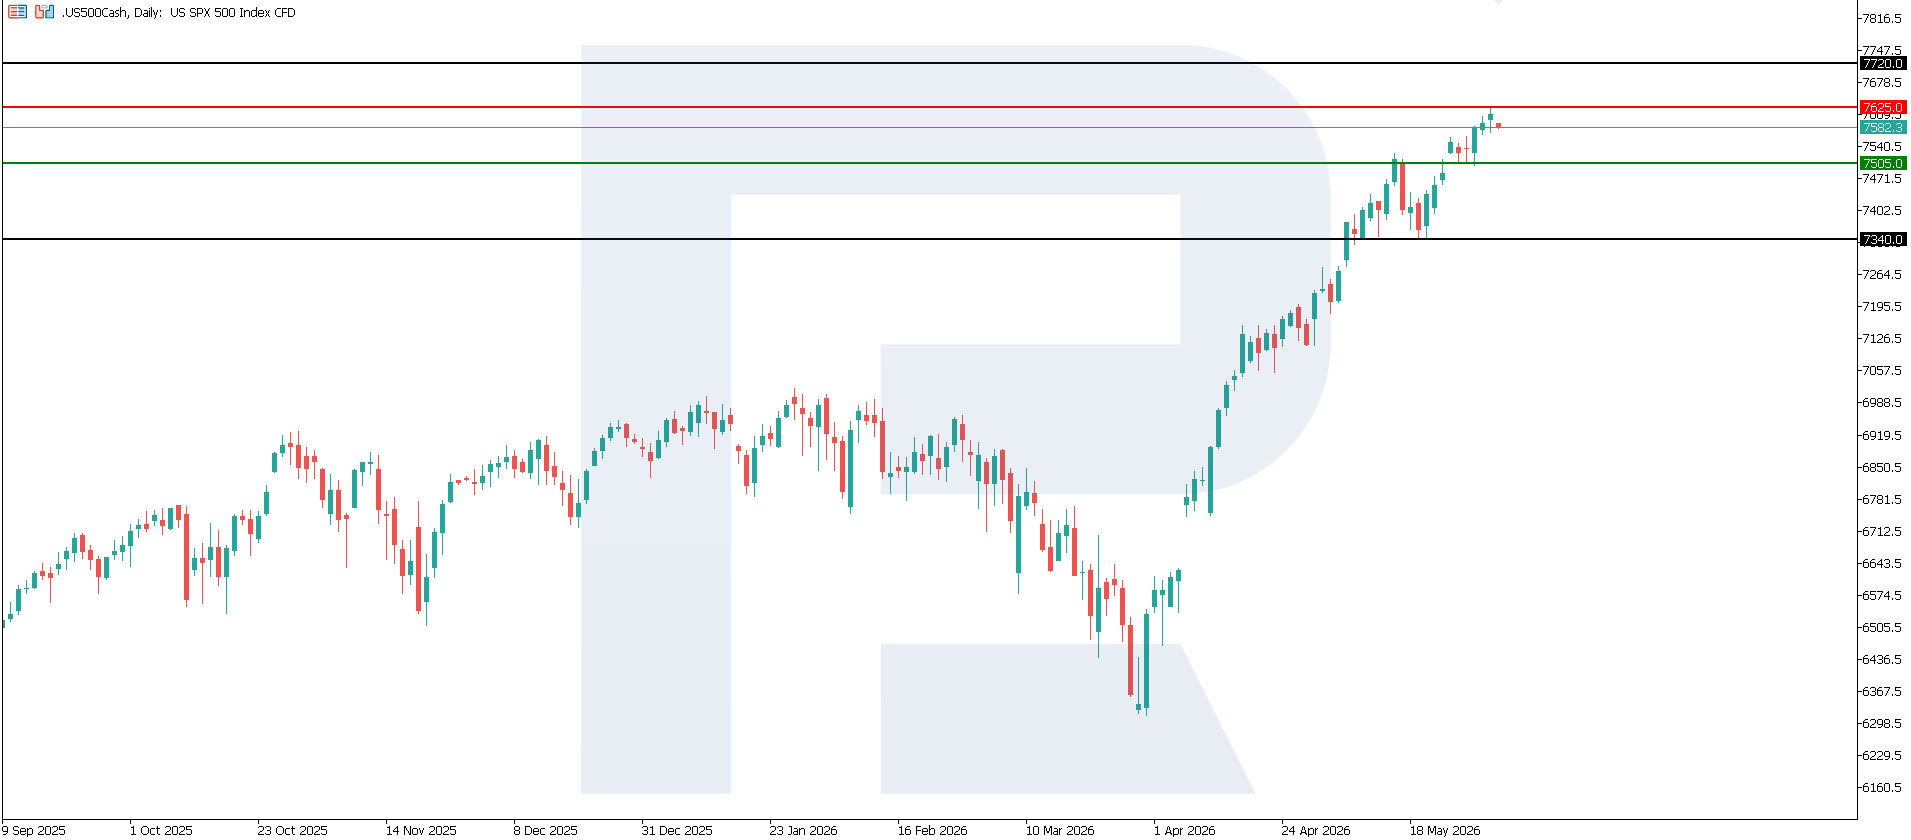
The US 500 index maintains its upward momentum after reaching a new all-time high. The resistance level has formed near 7,625.0, with the key support level at 7,505.0. If the trend continues, the nearest upside target could be 7,720.0.
The US 500 price forecast considers the following scenarios:
- Pessimistic US 500 forecast: a breakout below the 7,505.0 support level could send the index down to 7,340.0
- Optimistic US 500 forecast: a breakout above the 7,625.0 resistance level could drive the index up to 7,720.0
Summary
Overall, the published data is a positive signal for the US 500, as the PMI reading is above the forecast and above the previous value, confirming expanding manufacturing activity in the US. However, the index’s upside potential may be limited if the market concludes that strong data reduces the likelihood of near-term Fed policy easing. Cyclical sectors, industrials, commodities, energy, and certain financials could receive the strongest support. From a technical perspective, the US 500 index could rise to 7,720.0.
Editors’ picks
 EURUSD 2026-2027 forecast: key market trends and future predictions
This article provides the EURUSD forecast for 2026 and 2027 and highlights the main factors determining the direction of the pair’s movements. We will apply technical analysis, take into account the opinions of leading experts, large banks, and financial institutions, and study AI-based forecasts. This comprehensive insight into EURUSD predictions should help investors and traders make informed decisions.
 Gold (XAUUSD) forecast 2026 and beyond: expert insights, price predictions, and analysis
Dive deep into the Gold (XAUUSD) price outlook for 2026 and beyond, combining technical analysis, expert forecasts, and key macroeconomic factors. It explains the drivers behind gold’s recent surge, explores potential scenarios including a move toward 4,500 to 5,000 USD per ounce, and highlights why the metal remains a strong hedge during global uncertainty.
Forecasts presented in this section only reflect the author’s private opinion and should not be considered as guidance for trading. RoboForex bears no responsibility for trading results based on trading recommendations described in these analytical reviews.