US 500 forecast: the index falls more than 3.5%
The US 500 index shifted into a downtrend following the release of US labour market data. The US 500 forecast for today is negative.
US 500 forecast: key takeaways
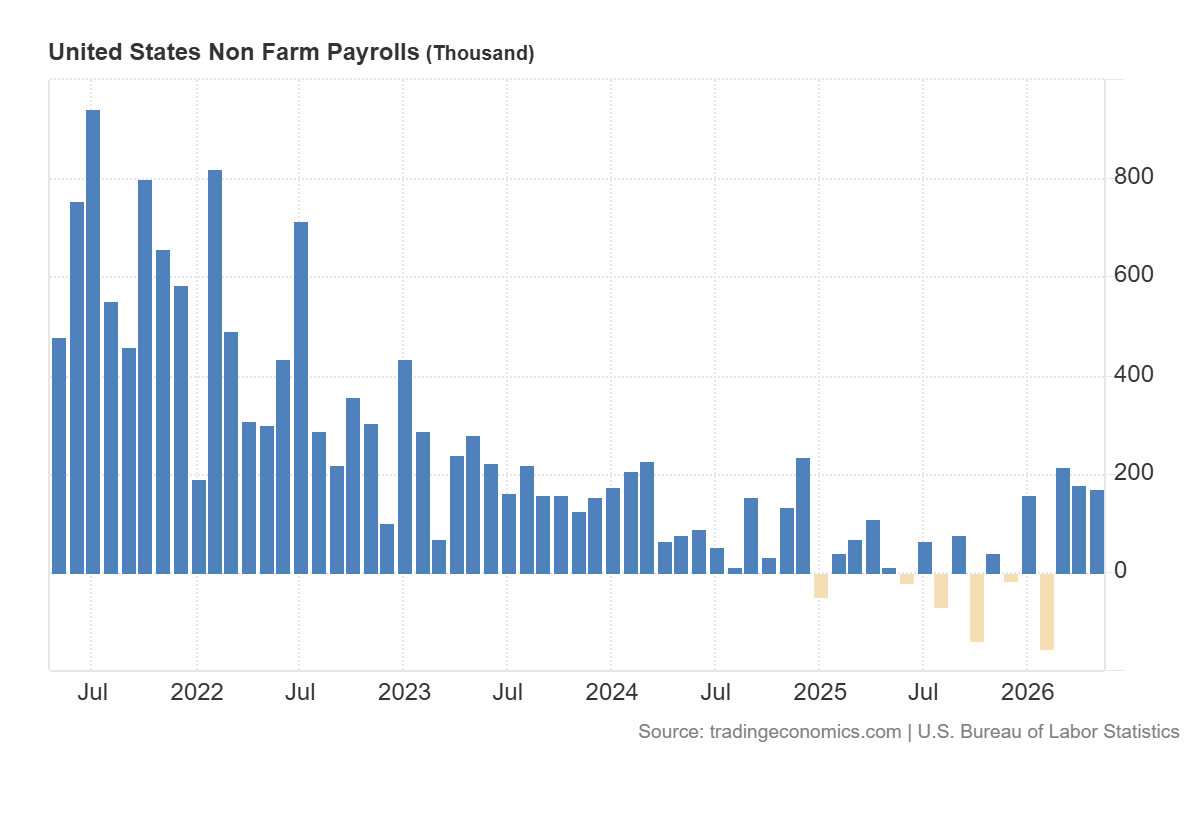
- Recent data: US Nonfarm Payrolls came in at 172 thousand in May
- Market impact: this data is moderately negative for the stock market
US 500 fundamental analysis
The release of quarterly US GDP data, with actual growth of 1.6%, compared to the forecast of 2.0%, may be interpreted by the market as a moderately negative signal for the US 500 index. The main reason is that the US economy is growing more slowly than expected, which reduces investor confidence in the resilience of corporate earnings. For a broad stock index that reflects the performance of the largest US companies, such a reading suggests that demand in the economy may be weaker than previously thought. This may trigger a cautious market reaction, especially if investors start to revise expectations for company revenue and earnings over the coming quarters.
For the US 500, the short-term reaction may be restrained or even negative if investors focus specifically on the risk that high interest rates will persist for longer. The stronger the labour market, the fewer reasons the Federal Reserve has to cut rates quickly, especially if inflation remains above the target level. In this scenario, government bond yields may rise, which typically pressures stocks, particularly companies with high valuations. Therefore, following this publication, the US 500 index may face volatility and profit-taking.
US 500 technical analysis
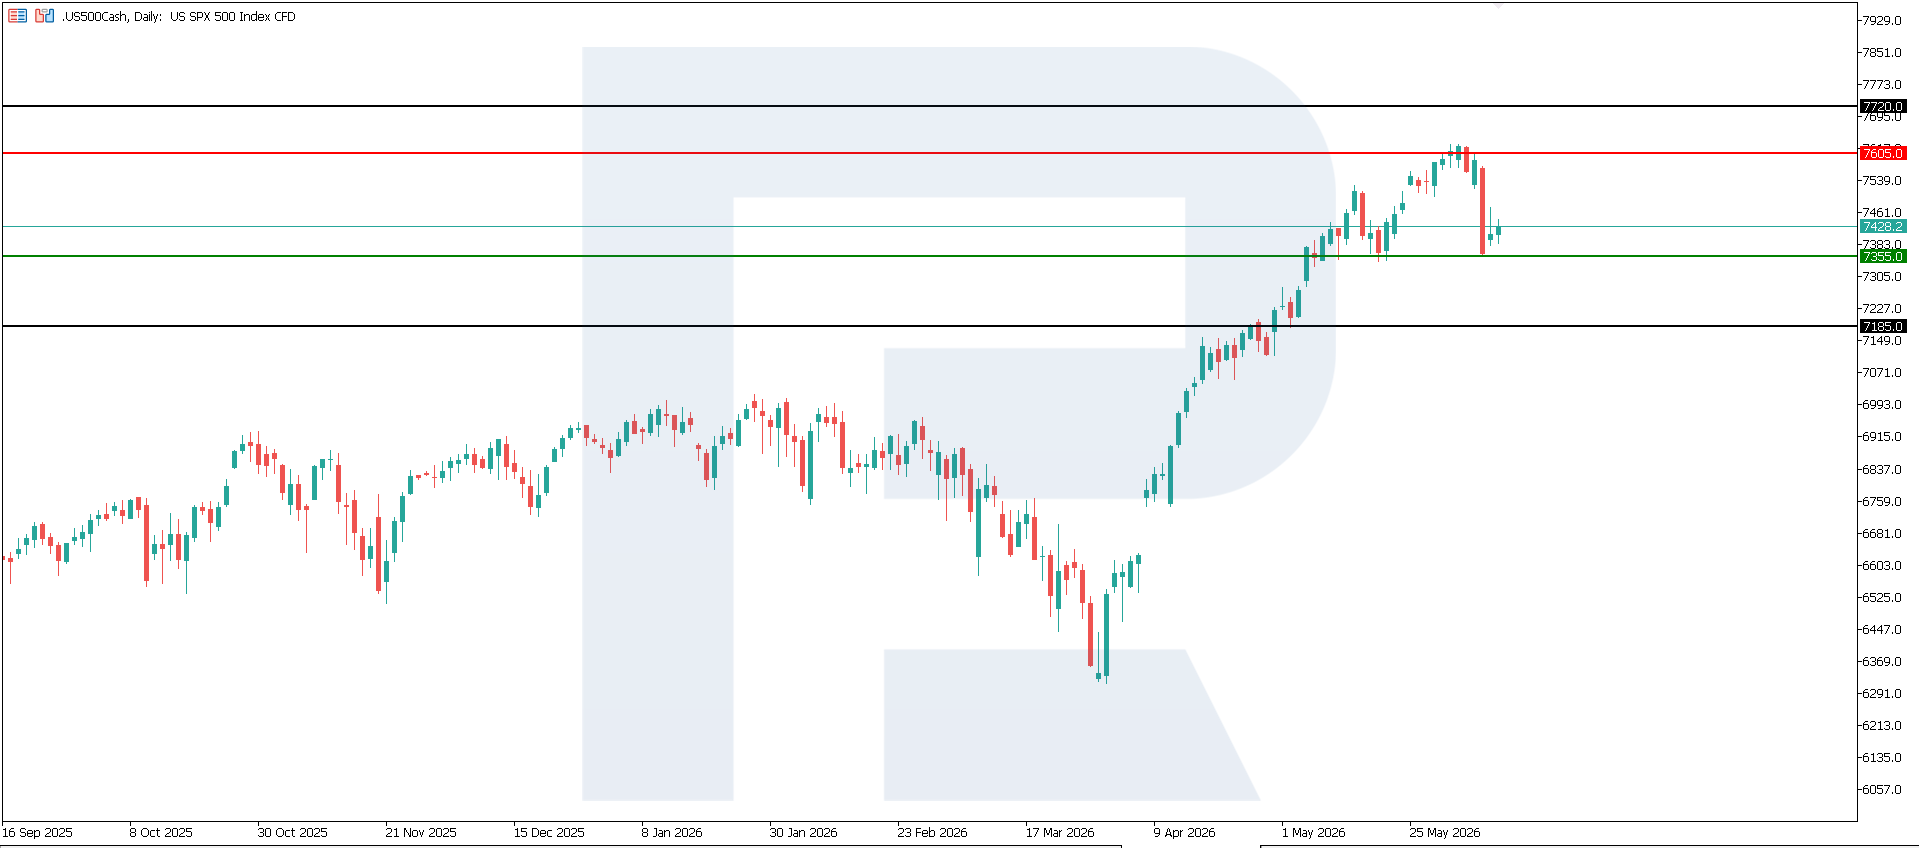
The US 500 index entered a downtrend after reaching a new all-time high. The resistance level has formed near 7,605.0, with the key support level at 7,355.0. If the trend continues, the nearest downside target could be 7,185.0.
The US 500 price forecast considers the following scenarios:
- Pessimistic US 500 forecast: a breakout below the 7,355.0 support level could push the index down to 7,185.0
- Optimistic US 500 forecast: a breakout above the 7,605.0 resistance level could propel the index up to 7,720.0
Summary
Overall, the published employment data is more likely to indicate the resilience of the US economy. For the US 500, this is a positive factor in terms of corporate earnings, but at the same time a dampening factor in terms of interest rate expectations. Therefore, the market’s near-term reaction may be mixed: the index may come under pressure due to a reassessment of Fed policy expectations, but if inflation does not accelerate, a strong labour market may maintain the overall positive backdrop for US stocks. From a technical analysis perspective, the US 500 index may decline to 7,185.0.
Editors’ picks
 EURUSD forecast 2026–2027: technical analysis, price levels & predictions
The ECB holds rates at 2.15% while the Fed stays at 3.75% — and that divergence is the central driver of EURUSD in 2026. The pair is range-bound between 1.1400 and 1.1915, with Deutsche Bank targeting 1.2500 and Morgan Stanley calling for 1.3000 by year-end. We analyse the technicals, break down the macro factors, and outline three trading scenarios with specific entry levels.
 Gold (XAUUSD) forecast 2026: predictions based on fundamental and technical analysis
Where is gold headed after pulling back from the all-time high of 5,597 USD? XAUUSD is consolidating near 4,518 USD between key levels 4,220 USD and 4,855 USD, with major banks targeting 5,243–6,200 USD by year-end. Read our comprehensive gold forecast: technical analysis across three timeframes, trading scenarios with specific entry levels, Fed policy and central bank demand outlook, and institutional predictions for 2026 and beyond.
Forecasts presented in this section only reflect the author’s private opinion and should not be considered as guidance for trading. RoboForex bears no responsibility for trading results based on trading recommendations described in these analytical reviews.