
US 500 forecast: the index continues to trade sideways
The US 500 index continues to trend upwards, while trading in a sideways range. The US 500 forecast for today is positive.
US 500 forecast: key takeaways
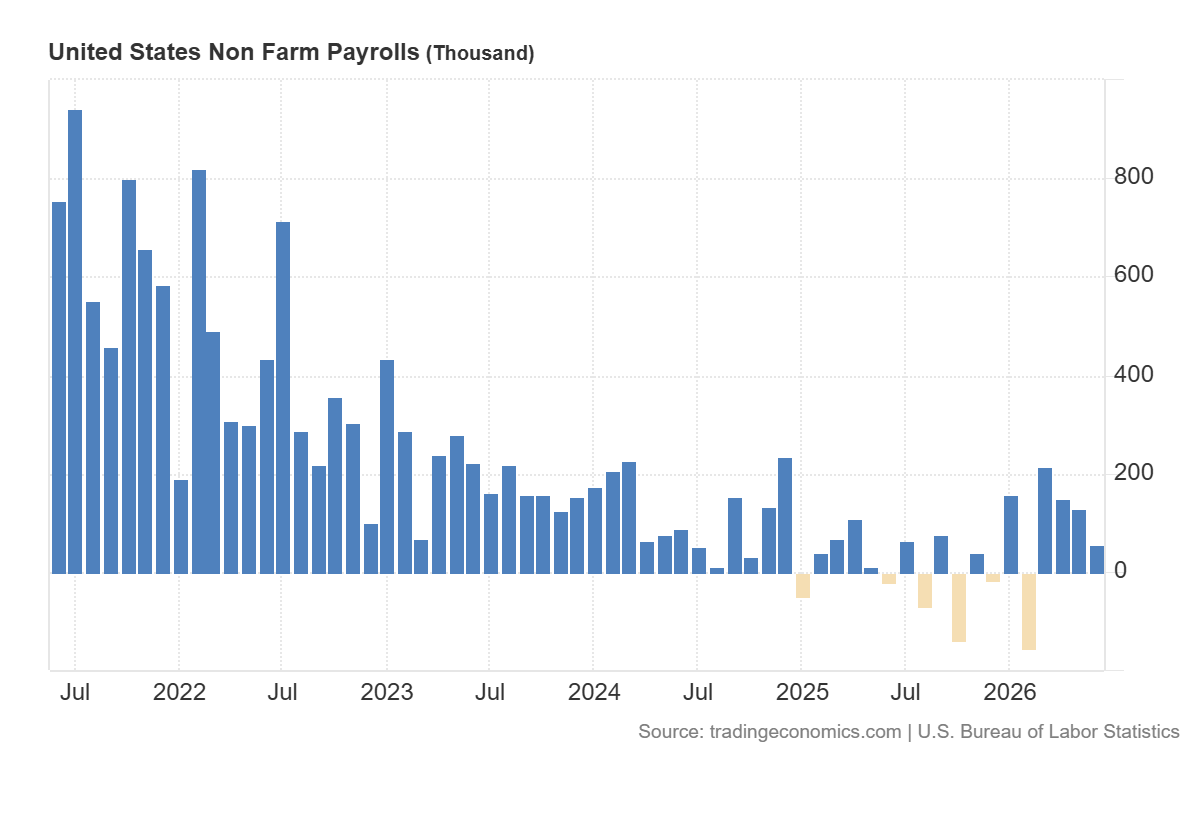
- Recent data: US Nonfarm Payrolls stood at 57 thousand in June 2026
- Market impact: these indicators have a moderately positive impact on the stock market
US 500 fundamental analysis
The release of Nonfarm Payrolls data, which showed actual employment growth of 57 thousand, below the forecast of 114 thousand and the previous reading of 129 thousand, may be interpreted by the market as a signal of a notable cooling in the US labour market. For the US 500 index, these statistics have a dual effect. On the one hand, weak data fuels concerns about an economic slowdown, as lower employment growth may indicate business caution, reduced demand for labour, and a potential weakening of consumer demand. This could put pressure on stocks, especially if investors start to revise corporate earnings expectations downwards.
On the other hand, a weak employment report may increase expectations for a more accommodative Federal Reserve monetary policy. If the market concludes that the labour market slowdown reduces inflation risks and brings a possible interest rate cut closer, this may support the US 500 index through lower bond yields and greater equity appeal. In this case, the market reaction may be moderately positive.
US 500 technical analysis
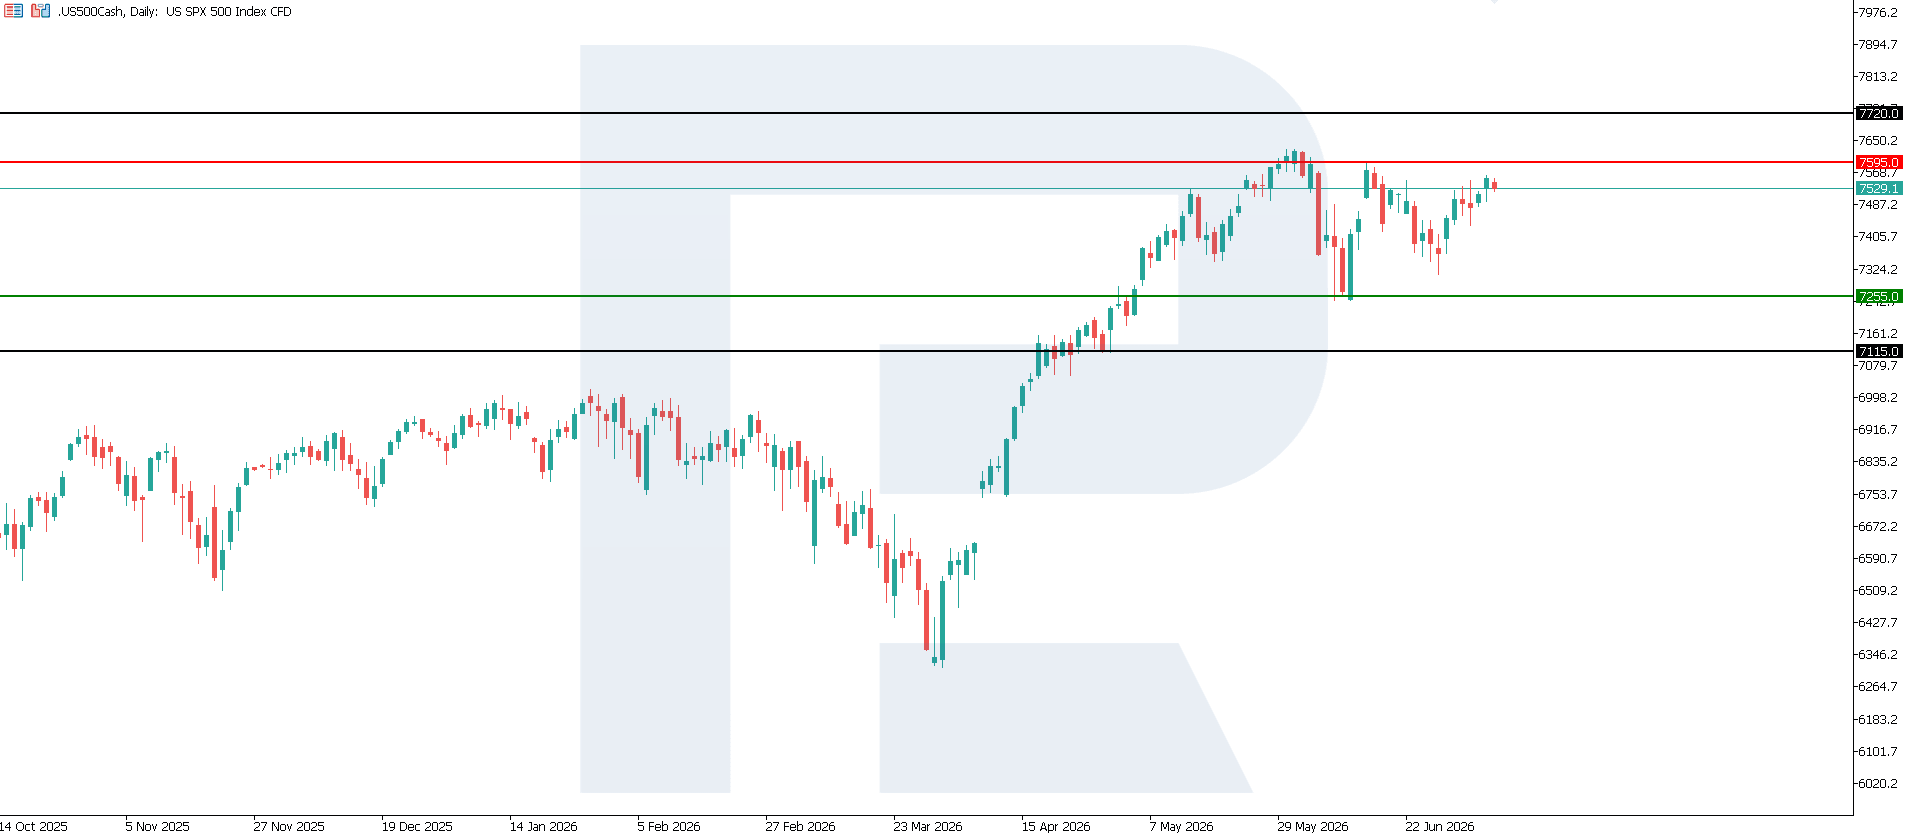
The correction in the US 500 index has ended, but a sustained upward movement has not yet resumed. At the current stage, the probability of quotes moving into a sideways range is increasing. The nearest resistance level formed around 7,595.0, while key support is located near 7,255.0. If the positive scenario remains intact and the uptrend resumes, the nearest upside target could be 7,720.0.
The US 500 price forecast outlines the following scenarios:
- Pessimistic US 500 forecast: a breakout below the 7,255.0 support level could push the index down to 7,115.0
- Optimistic US 500 forecast: a breakout above the 7,595.0 resistance level could drive the index up to 7,720.0
Summary
For the US stock market as a whole, the news may lead to elevated volatility. A cautious reaction is likely in the first hours after the release, as investors assess the balance between the risk of an economic slowdown and possible support from the Fed. If weak NFP data does not come alongside signs of a sharp deterioration in consumption or corporate forecasts, the market may remain resilient. However, if subsequent data confirms labour market weakness, pressure on stocks may intensify. From a technical analysis perspective, the US 500 index could rise to 7,720.0.
Editors’ picks
 EURUSD forecast 2026–2027: technical analysis, price levels & predictions
The ECB holds rates at 2.15% while the Fed stays at 3.75% — and that divergence is the central driver of EURUSD in 2026. The pair is range-bound between 1.1400 and 1.1915, with Deutsche Bank targeting 1.2500 and Morgan Stanley calling for 1.3000 by year-end. We analyse the technicals, break down the macro factors, and outline three trading scenarios with specific entry levels.
 Gold (XAUUSD) forecast 2026: predictions based on fundamental and technical analysis
Where is gold headed after pulling back from the all-time high of 5,597 USD? XAUUSD is consolidating near 4,518 USD between key levels 4,220 USD and 4,855 USD, with major banks targeting 5,243–6,200 USD by year-end. Read our comprehensive gold forecast: technical analysis across three timeframes, trading scenarios with specific entry levels, Fed policy and central bank demand outlook, and institutional predictions for 2026 and beyond.
Forecasts presented in this section only reflect the author’s private opinion and should not be considered as guidance for trading. RoboForex bears no responsibility for trading results based on trading recommendations described in these analytical reviews.