
US 500 forecast: index cannot break out of sideways channel
The US 500 index is testing the resistance level, but cannot break out of the sideways trend. The US 500 forecast for today is positive.
US 500 forecast: key takeaways
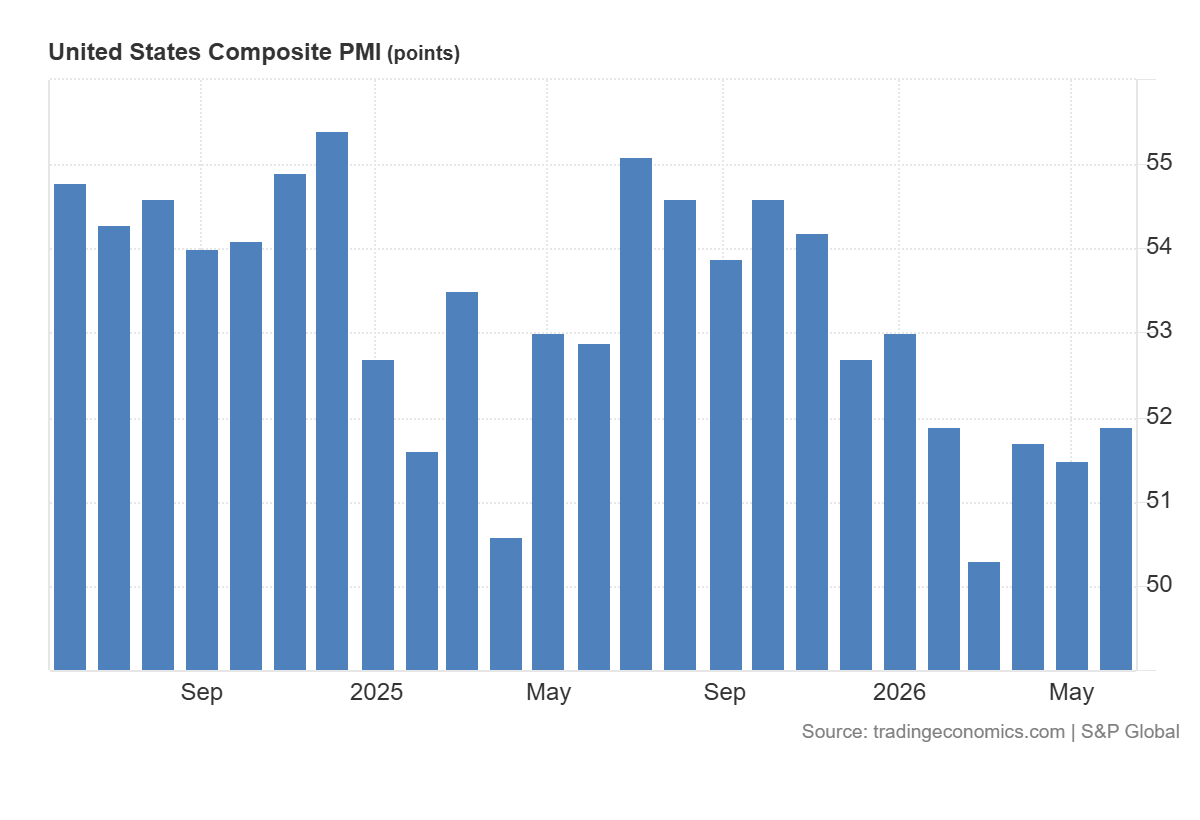
- Recent data: US composite PMI came in at 51.9 in June 2026
- Market impact: this data is moderately positive for the stock market
US 500 fundamental analysis
The S&P Global US composite PMI stood at 51.9 in June. The indicator came in below the preliminary estimate and the market forecast of 52.2 points, but exceeded the May reading of 51.5. Since the index remains above the 50-point mark, the data indicates continued growth in the US economy, but also shows that the pace of growth was weaker than initially expected. Therefore, the news should be viewed as mixed: it does not indicate an economic contraction, but dampens investor confidence in a significant acceleration of growth in the second half of the year.
On the other hand, a weak employment report may increase expectations for a more accommodative Federal Reserve monetary policy. If the market concludes that the slowdown in the labour market reduces inflation risks and brings a possible interest rate cut closer, this may support the US 500 index by driving down bond yields and making stocks more attractive. In this case, the market reaction could be moderately positive.
US 500 technical analysis
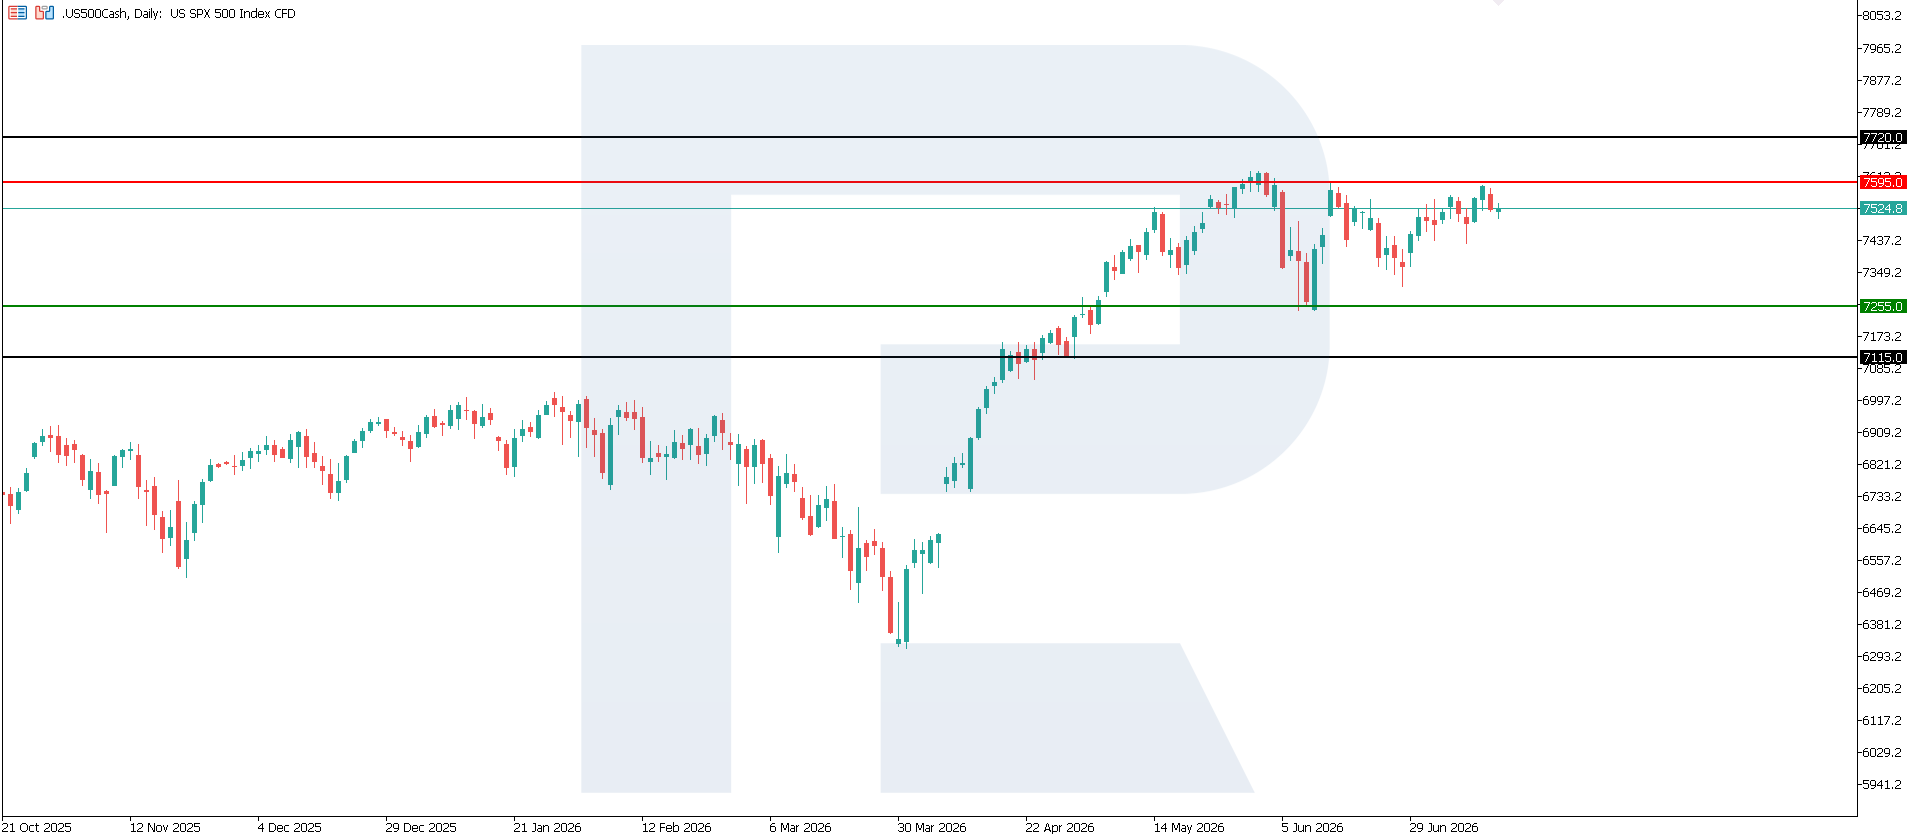
The corrective decline in the US 500 index has probably ended, although there are no signs of a sustained recovery in upward momentum. Under current conditions, quotes may consolidate within a sideways range. The nearest resistance level is located at 7,595.0, while the key support level formed near 7,255.0. If buying activity strengthens and the uptrend resumes, the next upside target could be 7,720.0.
The US 500 price forecast outlines the following scenarios:
- Pessimistic US 500 forecast: a breakout below the 7,255.0 support level could send the index down to 7,115.0
- Optimistic US 500 forecast: a breakout above the 7,595.0 resistance level could push the index up to 7,720.0
Summary
Overall, the June composite PMI does not create a clear negative signal for the US 500, as the economy continues to expand. However, the release reduces the likelihood of a rapid and sustained acceleration in economic growth. The most likely outcome is a limited reaction by the index, which is highly sensitive to government bond yields. Lower yields may support technology companies and other interest-rate-sensitive sectors. From a technical perspective, the US 500 index could climb to 7,720.0.
Editors’ picks
 EURUSD forecast 2026–2027: technical analysis, price levels & predictions
The ECB holds rates at 2.15% while the Fed stays at 3.75% — and that divergence is the central driver of EURUSD in 2026. The pair is range-bound between 1.1400 and 1.1915, with Deutsche Bank targeting 1.2500 and Morgan Stanley calling for 1.3000 by year-end. We analyse the technicals, break down the macro factors, and outline three trading scenarios with specific entry levels.
 Gold (XAUUSD) forecast 2026: predictions based on fundamental and technical analysis
Gold has corrected over 25% from its all-time high of 5,597 USD and is now trading near 4,100 USD — testing a critical support zone. Is this the bottom, or will the downtrend continue? We break down the key levels (support 3,920 USD, breakout trigger 4,500 USD), three trading scenarios with entry levels, and what J.P. Morgan, Goldman Sachs and Deutsche Bank are forecasting for gold in 2026.
Forecasts presented in this section only reflect the author’s private opinion and should not be considered as guidance for trading. RoboForex bears no responsibility for trading results based on trading recommendations described in these analytical reviews.