
US 500 forecast: the index is trading sideways
After failing to break above the resistance level, the US 500 index continued to trade within a sideways channel. The US 500 forecast for today is positive.
US 500 forecast: key takeaways
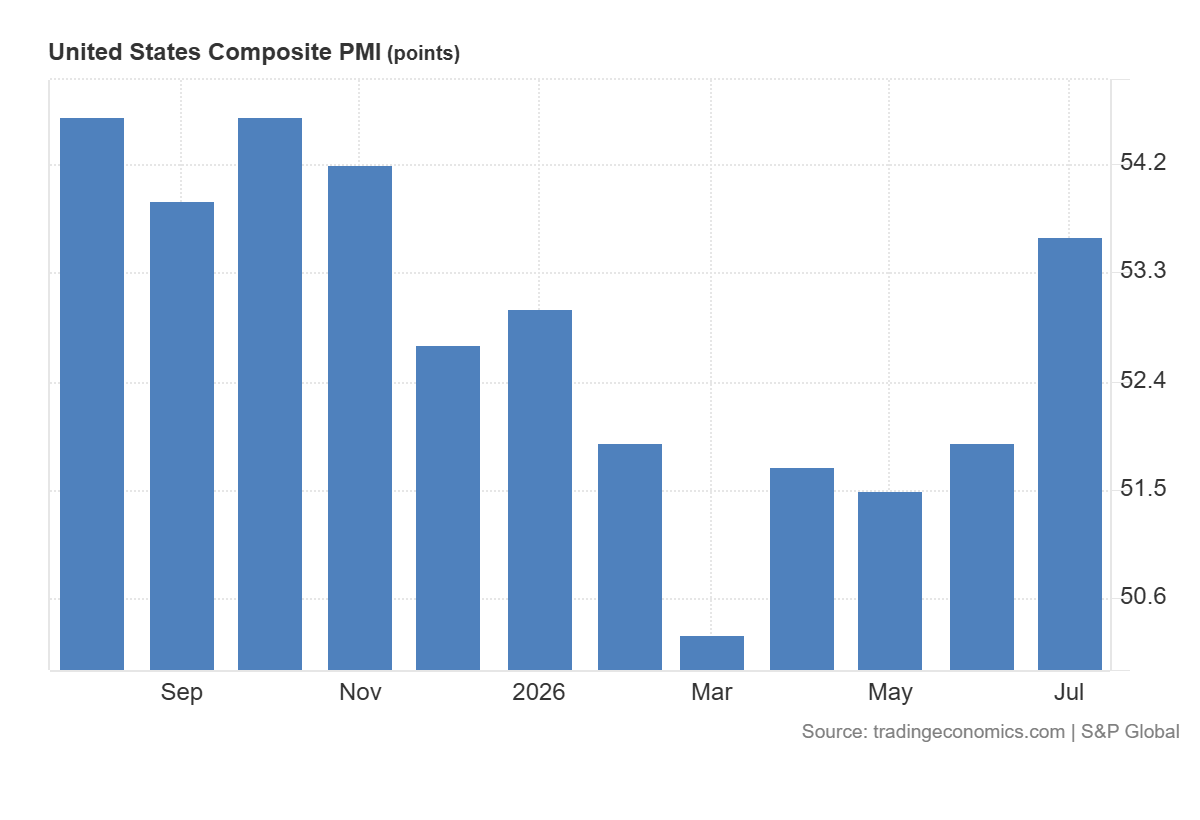
- Recent data: the US composite PMI came in at 53.6 in June 2026
- Market impact: the data is moderately positive for the stock market
US 500 fundamental analysis
The published US composite PMI data was significantly stronger than expected, with the index up from 51.9 to 53.6, above the forecast of 51.3. A reading above 50.0 indicates an expansion in business activity, and the June result was the highest since November. At the same time, growth in new orders accelerated, while employment continued to increase moderately. These figures indicate that the largest part of the US economy began the third quarter on a relatively firm footing.
The news has both positive and restraining implications for the US 500 index. The positive effect is linked to the acceleration in services and manufacturing activity, which reduces concerns about a sharp slowdown in the US economy. Sustained demand for services and an increase in production may support revenue and profits of domestically focused companies and improve expectations for corporate results in the second half of the year.
US 500 technical analysis
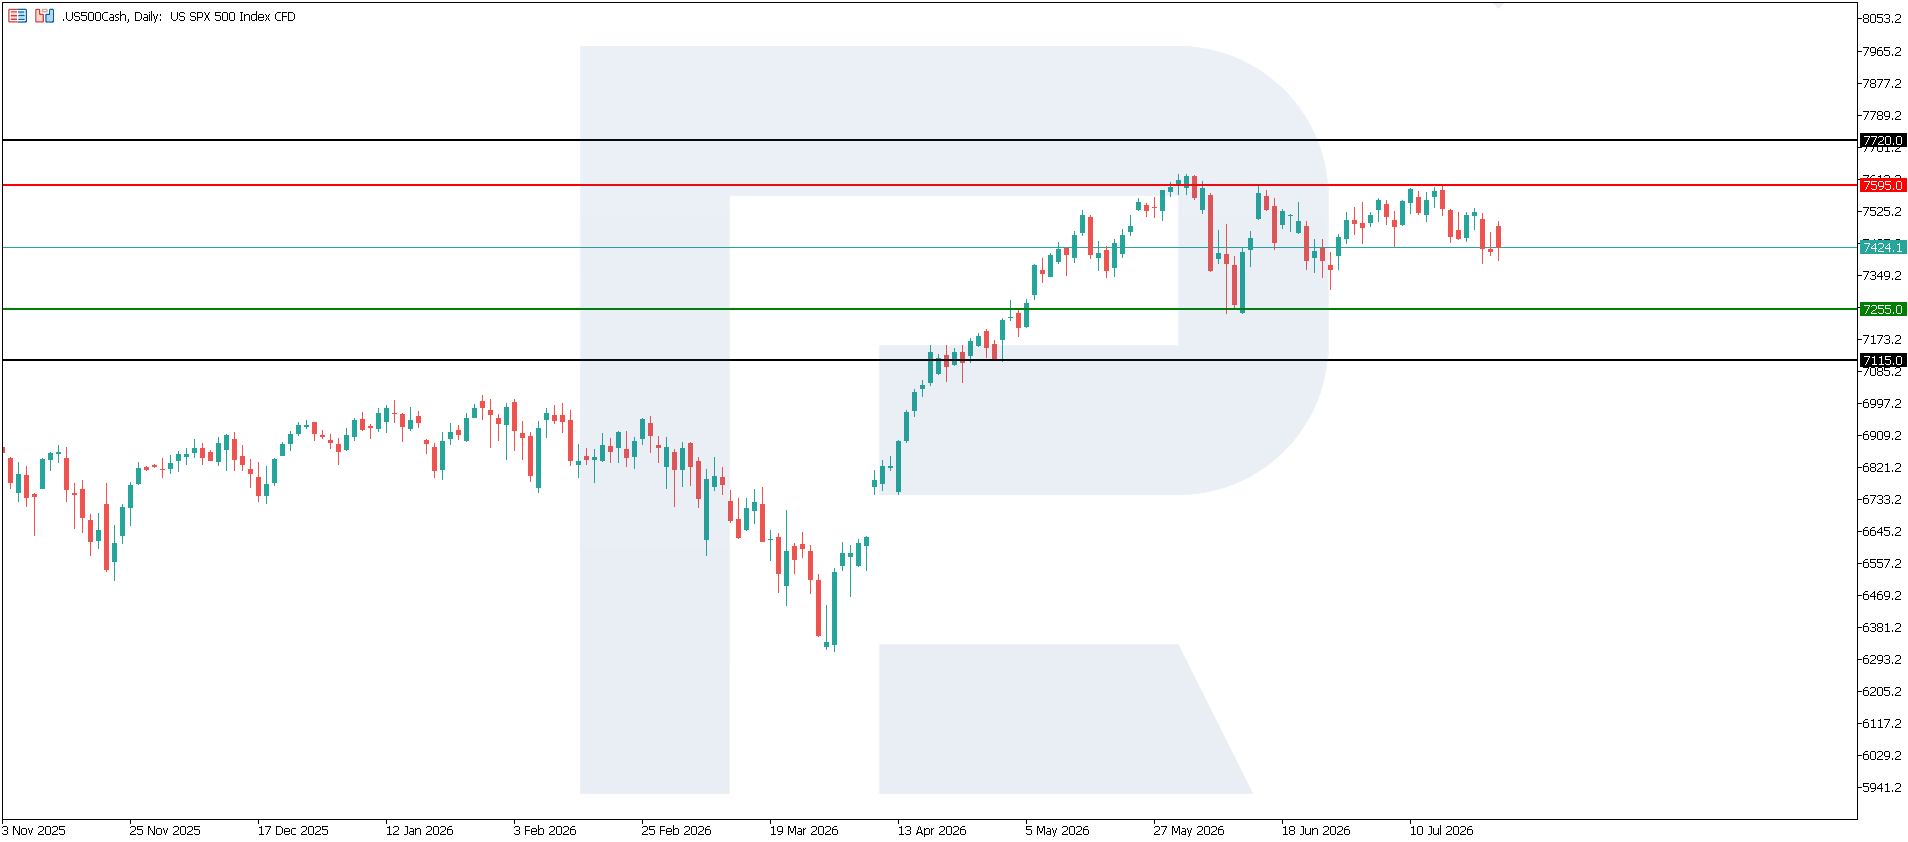
The corrective decline in the US 500 index may be gradually coming to an end, although there are still insufficient signs of a confident recovery in upward momentum. In the short term, the index may enter a consolidation phase and continue to trade within a limited range. The nearest resistance level has formed around 7,595.0, while key support is located near 7,255.0. If buying activity increases and the uptrend resumes, the next target for the index could be 7,720.0.
The US 500 price forecast outlines the following scenarios:
- Pessimistic US 500 scenario: a breakout below the 7,255.0 support level could push the index down to 7,115.0
- Optimistic US 500 scenario: a breakout above the 7,595.0 resistance level could propel the index up to 7,720.0
Summary
The composite PMI data should be viewed as a moderately positive signal for the US stock market, but not as a clear basis for sustained growth in the US 500. The statistics confirm that the US economy continues to expand and that consumer demand remains fairly strong. At the same time, the significant upside surprise increases the risk that interest rates will remain high and makes the market more sensitive to inflation data. From a technical analysis perspective, the US 500 index could rise to 7,720.0.
Editors’ picks
 EURUSD forecast 2026–2027: technical analysis, price levels & predictions
EURUSD has pulled back from the 2026 high of 1.1915 and is now trading near 1.1450 — below both EMA65 and EMA200 — with the active scenario shifting from bullish to bearish. The ECB raised rates to 2.40%, but the Fed holds at 3.75%, and US inflation (3.5%) continues to outpace the eurozone (2.8%). A confirmed break below 1.1280 opens the next downward wave toward 1.1080. We break down the key levels, three trading scenarios with entry triggers, and what Deutsche Bank, Morgan Stanley and UBS are forecasting for EURUSD in 2026.
 Gold (XAUUSD) forecast 2026: predictions based on fundamental and technical analysis
Gold has corrected over 25% from its all-time high of 5,597 USD and is now trading near 4,100 USD — testing a critical support zone. Is this the bottom, or will the downtrend continue? We break down the key levels (support 3,920 USD, breakout trigger 4,500 USD), three trading scenarios with entry levels, and what J.P. Morgan, Goldman Sachs and Deutsche Bank are forecasting for gold in 2026.
Forecasts presented in this section only reflect the author’s private opinion and should not be considered as guidance for trading. RoboForex bears no responsibility for trading results based on trading recommendations described in these analytical reviews.