US Tech forecast: index hits a new all-time high
The US Tech index reached a new all-time high – unusually, the trend is only gaining momentum. The US Tech forecast for next week is positive.
US Tech forecast: key takeaways
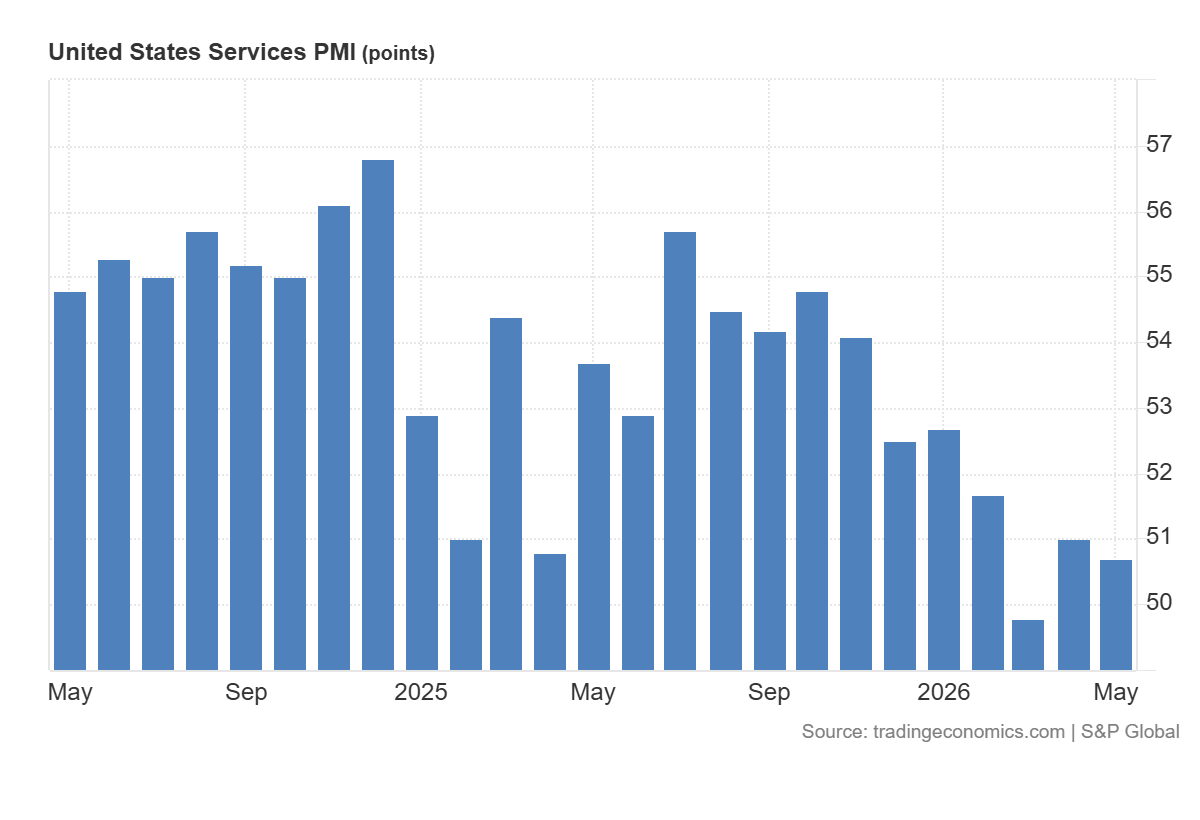
- Recent data: US services PMI came in at 50.7 in May
- Market impact: the current data is negative for the technology sector
US Tech fundamental analysis
The release of the US services PMI at 50.7, below the forecast of 50.9 and the previous reading of 50.9, indicates slightly weaker momentum than the market expected. The reading is still above 50.0, meaning the services sector continues to expand, but the pace of growth is slowing. This is a moderately negative signal for the US stock market, as services represent a large part of the US economy and are closely linked to consumer demand, employment, corporate earnings, and inflationary pressures.
Such data could have a dual impact on the US Tech index. On the one hand, a weaker PMI reduces confidence in the sustainability of economic growth, which could increase caution towards technology companies, particularly those whose valuations are already at high levels. If the market interprets the data as a sign of cooling demand, large-cap tech stocks may face profit-taking as investors revise revenue and growth expectations.
US Tech technical analysis
For the broader US stock market, the impact is also mixed. A weaker services PMI suggests the economy is losing some momentum but is not showing a sharp deterioration. A reading above 50.0 indicates a slowdown in growth, not a contraction in activity. So, a major sell-off based solely on this indicator is unlikely. However, if similarly weak data continues to feature in upcoming releases, investors may start to price in slower corporate profit growth, which would weigh on the stock market.
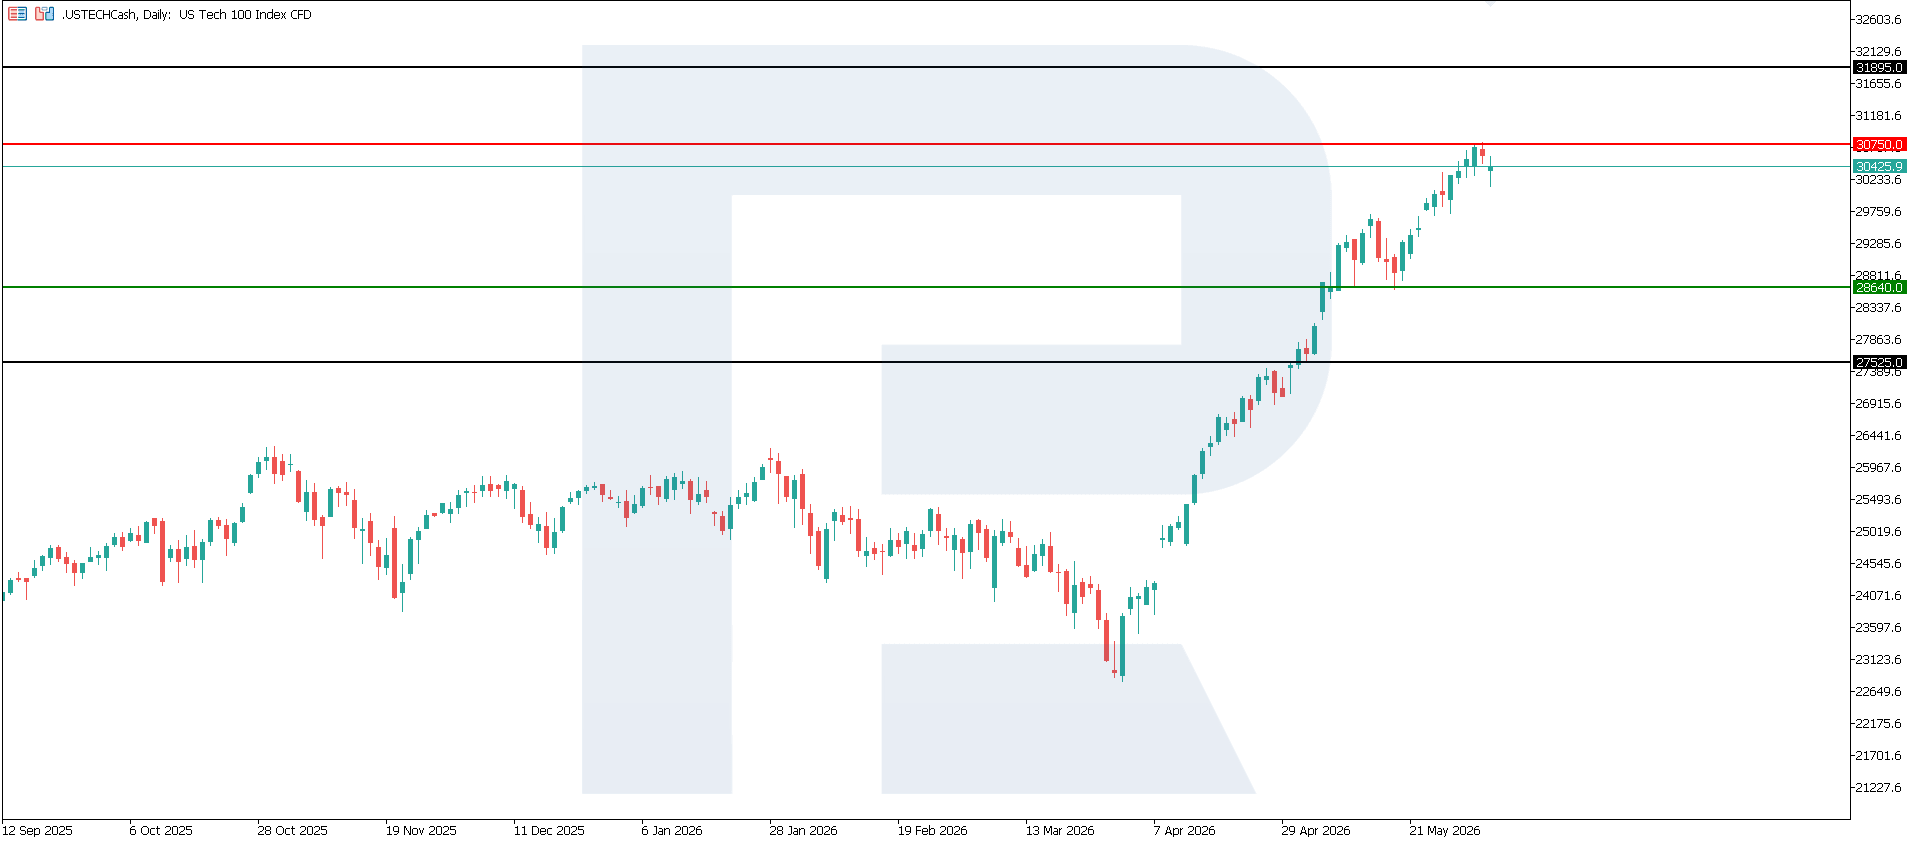
The US Tech index began to pull back after reaching a new all-time high. The resistance level formed around 30,750.0, while the nearest support stands at 28,640.0. The trend continues to strengthen, so another all-time high remains possible. If the rally extends, the next upside target could be around 31,895.0.
The US Tech price forecast outlines the following scenarios:
- Pessimistic US Tech scenario: a breakout below the 28,640.0 support level could send the index down to 27,525.0
- Optimistic US Tech scenario: a breakout above the 30,750.0 resistance level could boost the index to 31,895.0
Summary
Overall, the release is moderately negative for the market in terms of economic momentum, but not critical, as the indicator remains above 50.0. For the US Tech, the key will be the bond market reaction and Fed rate expectations. If the weaker PMI pushes yields lower and strengthens expectations of policy easing, the tech index may rebound or even extend gains. However, if investors focus on slowing growth and potential earnings downgrades, the US Tech index could shift into a post-rally correction. The nearest upside target could be 31,895.0.
Editors’ picks
 EURUSD forecast 2026–2027: technical analysis, price levels & predictions
The ECB holds rates at 2.15% while the Fed stays at 3.75% — and that divergence is the central driver of EURUSD in 2026. The pair is range-bound between 1.1400 and 1.1915, with Deutsche Bank targeting 1.2500 and Morgan Stanley calling for 1.3000 by year-end. We analyse the technicals, break down the macro factors, and outline three trading scenarios with specific entry levels.
 Gold (XAUUSD) forecast 2026: technical analysis, price levels & predictions
Where is gold headed after pulling back from the all-time high of 5,597 USD? XAUUSD is consolidating near 4,518 USD between key levels 4,220 USD and 4,855 USD, with major banks targeting 5,243–6,200 USD by year-end. Read our comprehensive gold forecast: technical analysis across three timeframes, trading scenarios with specific entry levels, Fed policy and central bank demand outlook, and institutional predictions for 2026 and beyond.
Forecasts presented in this section only reflect the author’s private opinion and should not be considered as guidance for trading. RoboForex bears no responsibility for trading results based on trading recommendations described in these analytical reviews.