
US Tech forecast: the index continues to trade sideways
The US Tech index is trading sideways without a clear trend. The US Tech forecast for next week is positive.
US Tech forecast: key takeaways
- Recent data: US services PMI came in at 51.2 in June 2026
- Market impact: the current data has a negative impact on the technology sector
US Tech fundamental analysis
US services PMI data appears moderately negative for the market, but it does not represent a strong stress signal. The actual PMI reading was 51.2, compared to the forecast of 51.3 and the previous reading of 51.3. The indicator remained above the 50-point mark, indicating continued growth in the service sector, although a slight decline relative to expectations points to some weakening in business activity. For the US Tech index, this news may trigger a restrained reaction, as technology companies depend heavily on expectations for economic growth, corporate spending, and future earnings.
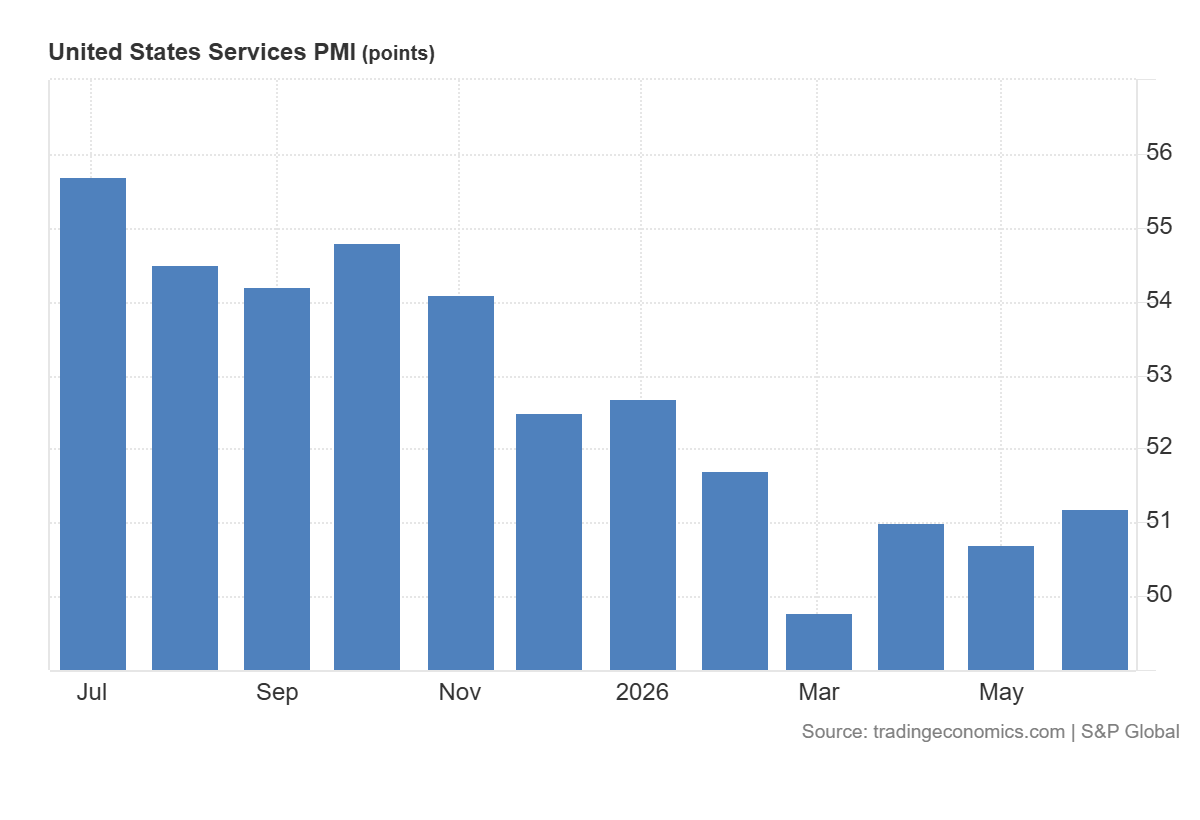
For the US Tech, the impact could be mixed. On the one hand, weaker PMI indicates slower activity across the largest part of the US economy, which may reduce revenue expectations for companies involved in software, cloud services, digital advertising, and corporate IT spending. If businesses become more cautious, they may be slower to increase budgets for technology, automation, and new digital products.
US Tech technical analysis
For the broader US stock market, the news appears to be broadly neutral to negative. The service sector remains in growth territory, so it is premature to speak of a sharp deterioration in the economic environment. However, the fact that the indicator came in below the forecast may increase investor caution. The market may start to assess more carefully whether consumer demand and corporate activity are cooling gradually.
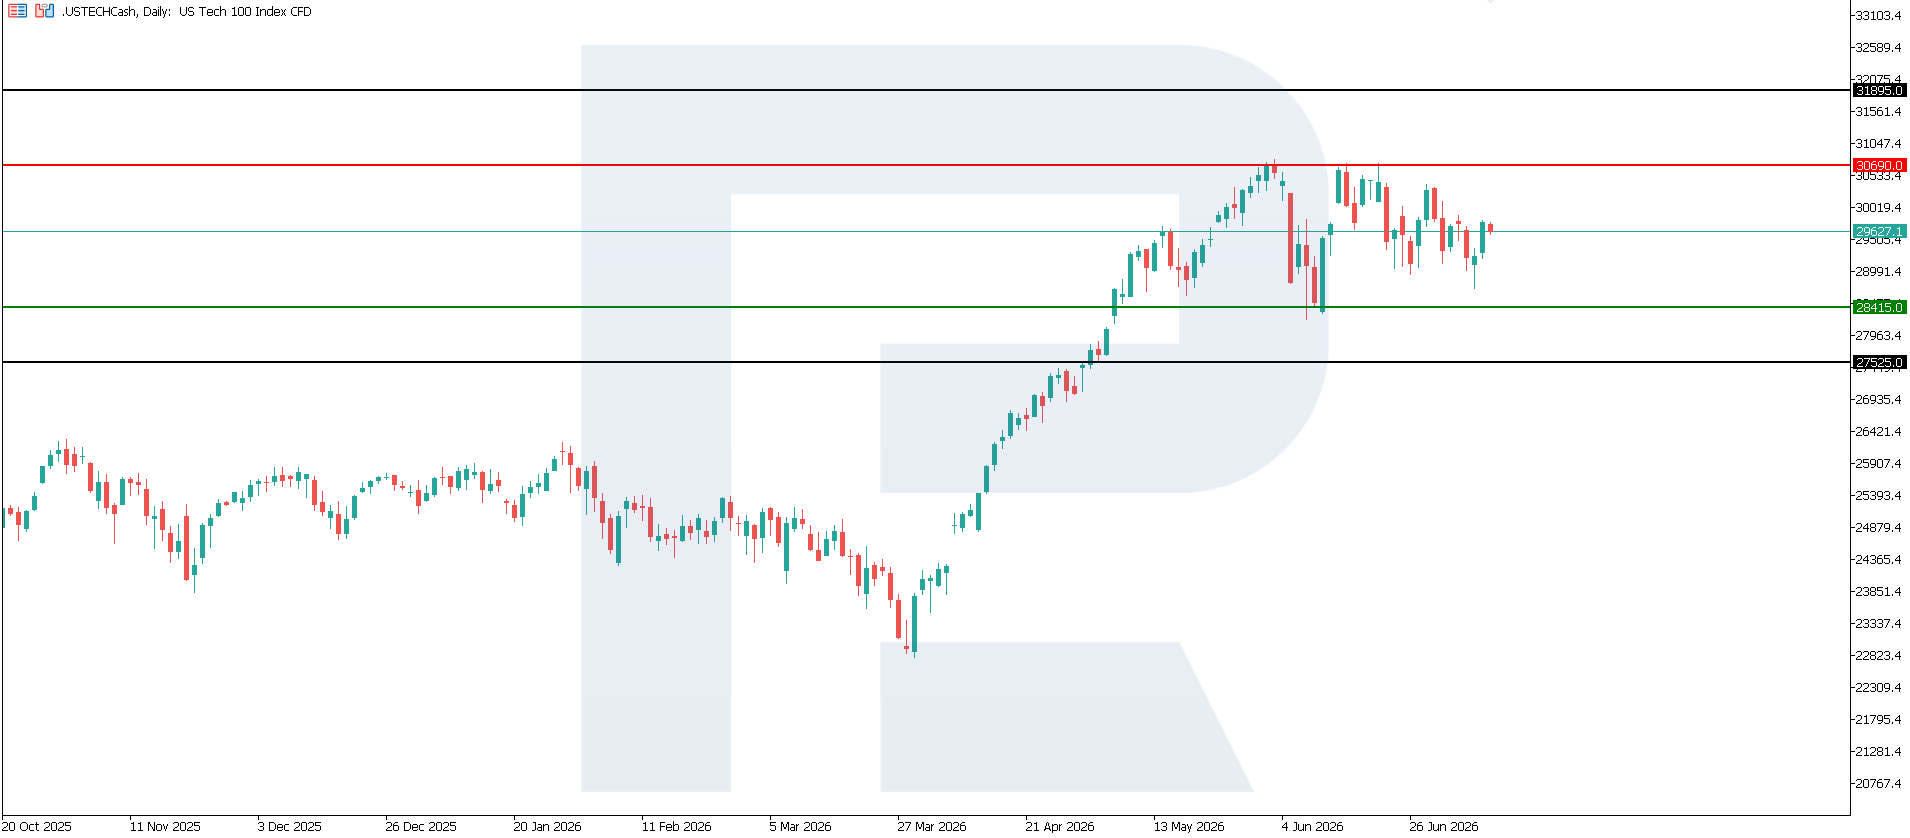
The US Tech index continues its corrective movement, although the potential for further decline may gradually weaken, increasing the likelihood of a consolidation phase. The nearest resistance level formed around 30,690.0, while key support is located at 28,415.0. Despite the current correction, the broader uptrend remains intact; however, without strong buying momentum, the market may shift to sideways movement. If growth resumes, the next potential target for the index could be 31,895.0.
The US Tech price forecast outlines the following scenarios:
- Pessimistic US Tech forecast: a breakout below the 28,415.0 support level could push the index down to 27,525.0
- Optimistic US Tech scenario: a breakout above the 30,690.0 resistance level could boost the index up to 31,895.0
Summary
Overall, the current publication does not appear weak enough to sharply change the market direction, but it may increase caution in assessing further growth in US stocks. For the US Tech, the key issue will be how investors interpret the data: as a sign of mild economic cooling, favourable for future rate cuts, or as a signal to revise expectations for company earnings. While the indicator remains above 50 points, the baseline scenario looks moderately stable, but upside potential may become more limited if the next macroeconomic data also shows a slowdown. The nearest upside target could be 31,895.0.
Editors’ picks
 EURUSD forecast 2026–2027: technical analysis, price levels & predictions
The ECB holds rates at 2.15% while the Fed stays at 3.75% — and that divergence is the central driver of EURUSD in 2026. The pair is range-bound between 1.1400 and 1.1915, with Deutsche Bank targeting 1.2500 and Morgan Stanley calling for 1.3000 by year-end. We analyse the technicals, break down the macro factors, and outline three trading scenarios with specific entry levels.
 Gold (XAUUSD) forecast 2026: predictions based on fundamental and technical analysis
Gold has corrected over 25% from its all-time high of 5,597 USD and is now trading near 4,100 USD — testing a critical support zone. Is this the bottom, or will the downtrend continue? We break down the key levels (support 3,920 USD, breakout trigger 4,500 USD), three trading scenarios with entry levels, and what J.P. Morgan, Goldman Sachs and Deutsche Bank are forecasting for gold in 2026.
Forecasts presented in this section only reflect the author’s private opinion and should not be considered as guidance for trading. RoboForex bears no responsibility for trading results based on trading recommendations described in these analytical reviews.