AI Portfolio for Two Weeks: Can GPT-6 Sol Beat the US 500 This Time?

This AI portfolio is the second round of an experiment we run in public. The AI model GPT-6 Sol builds a portfolio for a 10,000 USD demo account in StocksTrader with a horizon of 10 trading days, using leverage of up to 1:2 on stocks and ETFs and up to 1:50 on currencies. All eight positions opened on 12 October after the US market open, and they close no later than 23 October. The result goes up on this page next to a US 500 position of about the same size.
Previous AI portfolio
The first AI portfolio, 28 September to 9 October, earned 148.43 USD, or 1.48% of the deposit. A US 500 position of the same size made 182.50 USD with dividends, so the index finished 34.07 USD ahead. In the new portfolio the AI bets more on events of the next two weeks: bank and TSMC earnings and demand for AI hardware.
Horizon
10 trading days, 12 to 23 October 2026
Deposit
10,000 USD on a demo account in StocksTrader
Built by
GPT-6 Sol: instruments, sizes, Take Profit and Stop Loss
Benchmark
The US 500, 2 lots, about the same size as the portfolio
AI Portfolio Status
| Stage | Status |
|---|---|
| Portfolio built | 12 October 2026, before the US market opens |
| Positions opened | 12 October 2026 after the US open, all eight |
| Positions closed | No later than 23 October 2026, after the US open |
| Result | Published on this page when the portfolio closes |
Open a RoboForex Account
Trade stocks, ETFs, currencies and indices from one account.
How the AI Portfolio Experiment Works
The portfolio was built with GPT-6 Sol, and the AI does the whole selection. It assesses the market, picks the instruments, splits the budget, and calculates the position size, Take Profit and Stop Loss for every trade. Our part is technical: we check the quotes in StocksTrader before sending the orders, open the positions on the demo account and record the result.
The request sent to the AI, translated from the original:
Prompt
Build a portfolio for 12 to 23 October for a 10,000 USD deposit in StocksTrader. Use leverage of no more than 1:2 on stocks and ETFs and no more than 1:50 on currencies. Select a core, a defensive, a currency and a tactical block. Calculate the volume, reference entry, Take Profit and Stop Loss. Keep some funds free as a reserve.
The portfolio follows six rules:
- Fixed horizon. Positions open on Monday 12 October after the US market opens. Everything still open is closed on Friday 23 October after the US open, whatever the result.
- Early exit. If the total profit of the portfolio, counting open positions, reaches 500 USD before 23 October, all remaining positions are closed at once.
- Levels follow the entry. Take Profit and Stop Loss keep the distance in percent that the AI set from its reference price, counted from the actual entry. A move before the order then shifts the levels and leaves the risk of the trade unchanged.
- No second attempt. A position closed at its Stop Loss is not reopened within the same portfolio.
- Leverage. Up to 1:2 on stocks and ETFs, up to 1:50 on currencies.
- Reference prices. Stock and ETF prices are based on the close on 9 October. EUR/USD, oil, gold and BTC are the prices around midday on 12 October. The actual entry prices are listed under the positions table.
Market Backdrop for the Next Two Weeks
- US stocks. The S&P 500 finished 9 October near 7,812 points, and SPY near 779 USD. The market enters the earnings season close to its highs. Strong company results can support further gains, while after a rise investors react sharply to weak reports and forecasts.
- Fed rate and bonds. The Fed rate stands at 3.75% to 4.00%, and the yield on 10-year US government bonds rose to 5.24% by the end of last week. The next Fed meeting is on 27 and 28 October, after the portfolio closes. Over the next ten sessions the main risk for stocks is a shift in rate expectations after the inflation data.
- US dollar. On the morning of 12 October EUR/USD traded near 1.1200. The high rate and demand for the dollar in uncertain markets support it. A sell of EUR/USD can help the portfolio if high inflation pushes stocks lower and the dollar higher, and it can lose money if inflation comes in unexpectedly weak.
- Gold and oil. XAU/USD traded near 4,185 USD per ounce: demand for a safe asset holds up, while high rates limit its rise. Brent stood near 104 USD a barrel on the risk of supply disruptions. The XLE energy fund is in the portfolio with a small size, because easing tension can turn oil prices lower quickly.
How the AI Split the Budget
How GPT-6 Sol split 15,673.01 USD of trades across four blocks
15,673 USD
8 trades
Core block
7,318.36 USD · 46.7% of the portfolio
- QQQ3,005.08 USD
- NVDA2,751.36 USD
- XLE1,561.92 USD
Large technology companies, a stronger bet on AI, and energy on expensive oil.
Currency block
3,360.00 USD · 21.4% of the portfolio
- EUR/USD, sell3,360.00 USD
Can make money if high inflation pushes stocks lower and the dollar higher.
Defensive block
2,423.08 USD · 15.5% of the portfolio
- XLV1,366.48 USD
- KO1,056.60 USD
Healthcare and consumer goods, to lean less on technology.
Tactical block
2,571.57 USD · 16.4% of the portfolio
- JPM1,664.95 USD
- TSM906.62 USD
Bets on the JPMorgan report on 13 October and the TSMC report on 15 October.
Hover over a block, or tap it, to see what is inside.
- Core block: QQQ, NVDA and XLE. QQQ follows large US technology companies, NVDA strengthens the bet on AI, and XLE adds the energy sector. The block comes to about 7,318 USD. NVIDIA has announced a larger share buyback, while high bond yields remain a risk for technology stocks.
- Defensive block: XLV and KO. The healthcare fund and Coca-Cola shares take 2,423 USD. They can soften a fall in technology stocks, although they can also lose value when the whole market falls.
- Currency block: sell EUR/USD. The trade sells 3,000 EUR at 1.1200, a position of 3,360 USD. It is a small bet on a stronger dollar and partial protection against high inflation weighing on stocks.
- Tactical block: JPM and TSM. The block comes to about 2,572 USD. JPMorgan reports on 13 October and TSMC on 15 October. TSMC's revenue for September rose 54.6% from September last year. The next big event for the shares is the quarterly report on 15 October, where investors will watch the profit and the forecast. Both reports can move the price sharply either way.
The rest of the deposit stays free as a reserve.
The portfolio counts on QQQ, NVDA, JPM and TSM rising faster than the broad market. XLE adds a bet on expensive oil, XLV and KO reduce the dependence on technology, and the EUR/USD sell can help if the dollar strengthens. The main risks for this setup are high inflation and a weak TSMC report.
AI Portfolio Positions
Entry prices below are the reference prices listed in the rules. Take Profit and Stop Loss are the levels the AI set, with their distance from the entry in percent; at the open they are placed at the same distance from the actual entry. Charts for every stock and fund are on the RoboForex stock charts page, and the currency pair is on the EURUSD live chart.
| Instrument | Trade | Entry | Take Profit | Stop Loss | Volume | Size, USD | Why |
|---|---|---|---|---|---|---|---|
| QQQ | ↑ Buy | 751.27 | 780.00 (+3.82%) | 735.00 (-2.17%) | 4 shares | 3,005.08 | Core position in large technology companies |
| NVDA | ↑ Buy | 229.28 | 250.00 (+9.04%) | 218.00 (-4.92%) | 12 shares | 2,751.36 | A possible recovery in AI stocks |
| XLE | ↑ Buy | 65.08 | 70.00 (+7.56%) | 62.50 (-3.96%) | 24 shares | 1,561.92 | Expensive oil supports energy companies |
| XLV | ↑ Buy | 170.81 | 178.00 (+4.21%) | 167.00 (-2.23%) | 8 shares | 1,366.48 | Less dependence on the technology sector |
| KO | ↑ Buy | 88.05 | 91.50 (+3.92%) | 85.50 (-2.90%) | 12 shares | 1,056.60 | Consumer business in the defensive block |
| EUR/USD | ↓ Sell | 1.1200 | 1.1050 (-1.34%) | 1.1300 (+0.89%) | 3,000 EUR | 3,360.00 | A stronger dollar on a high Fed rate |
| JPM | ↑ Buy | 332.99 | 355.00 (+6.61%) | 324.00 (-2.70%) | 5 shares | 1,664.95 | A possible positive reaction to the bank's report |
| TSM | ↑ Buy | 453.31 | 485.00 (+6.99%) | 439.00 (-3.16%) | 2 shares | 906.62 | TSMC report and demand for AI chips |
If QQQ, NVDA, XLE, XLV, KO, JPM or TSM opens at or beyond its Take Profit or Stop Loss on 12 October, that position is not opened. The quote is checked again right before each order, and this page lists every position left out in the update.
Actual Entry Prices
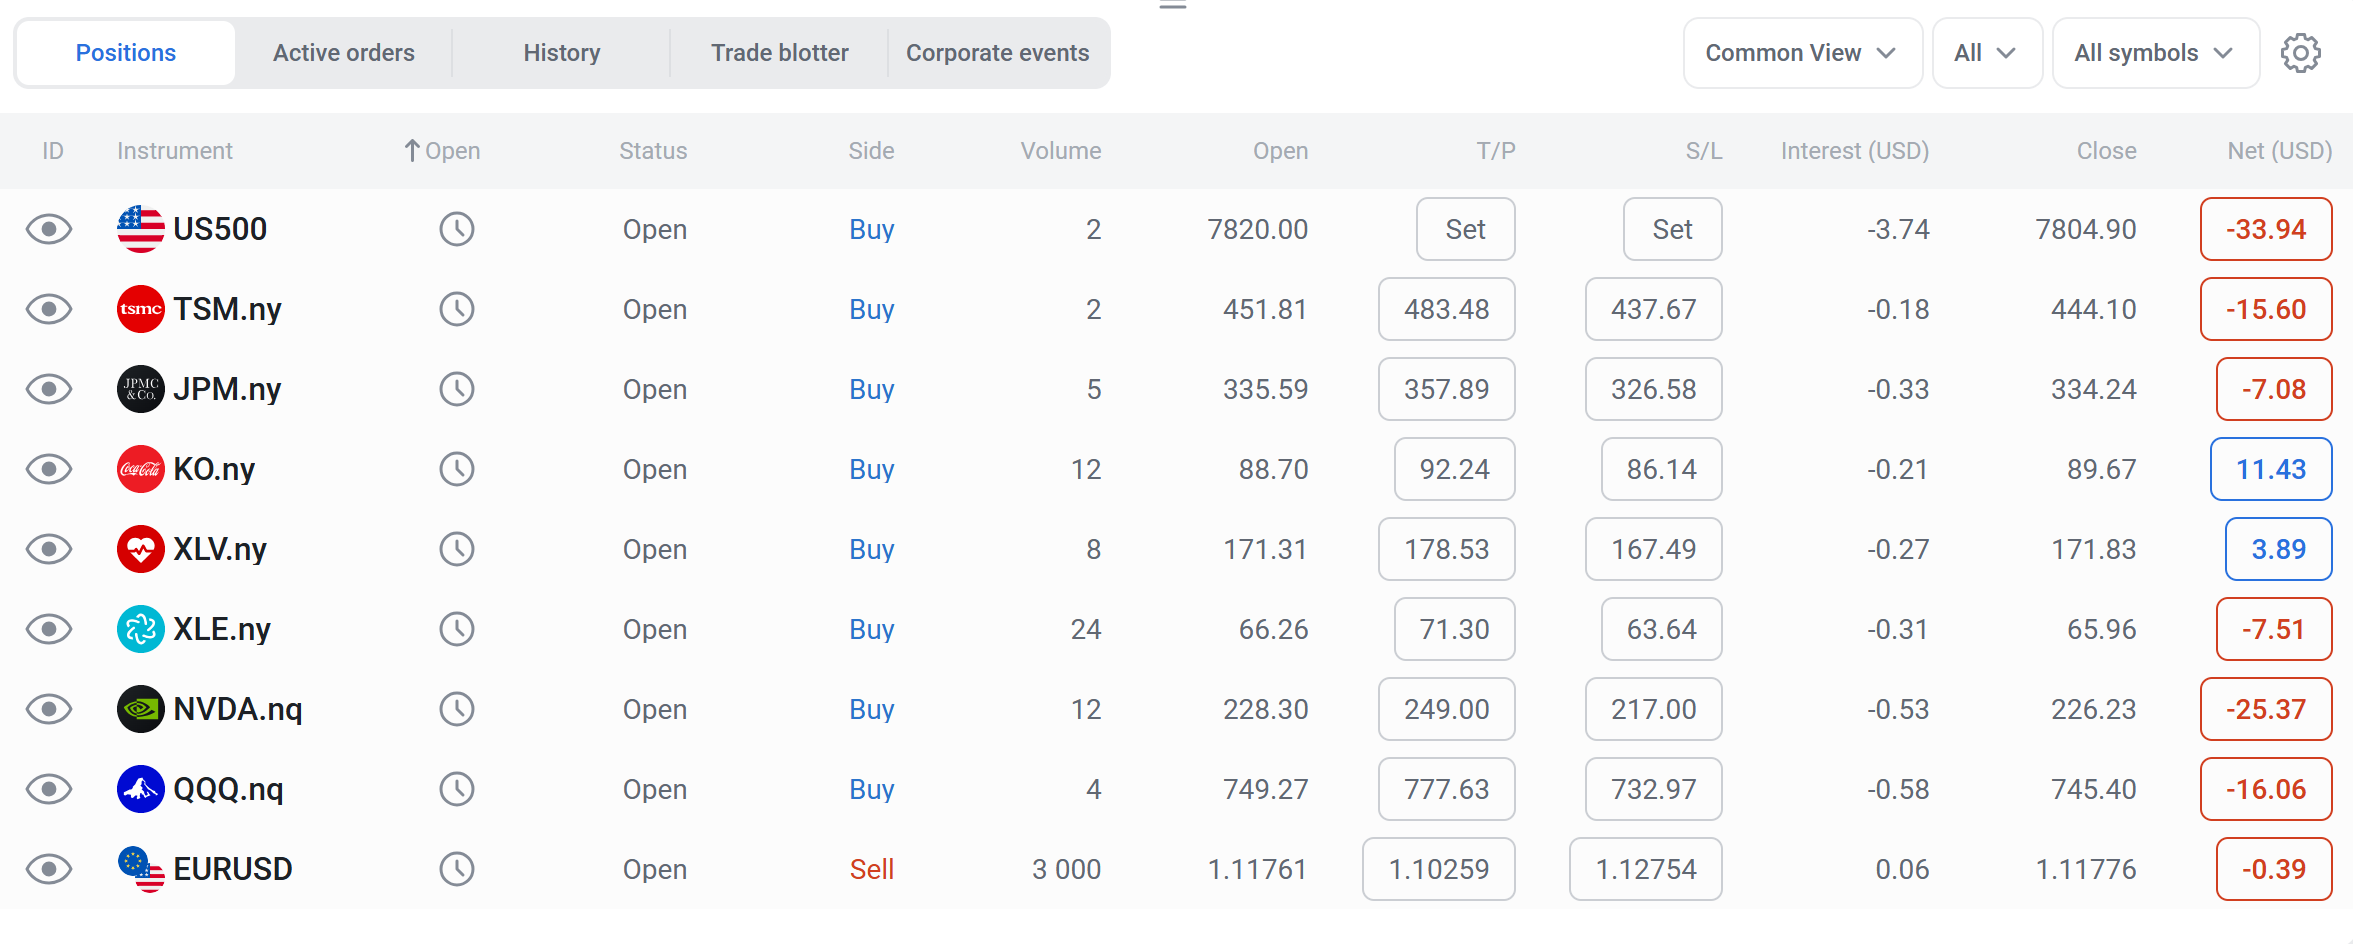
All eight positions opened on 12 October after the US market open, together with the US 500 benchmark. None of the stocks or funds opened beyond its Take Profit or Stop Loss. Take Profit and Stop Loss moved with the entry, keeping the distance in percent that the AI set.
| Instrument | Planned entry | Actual entry | Take Profit | Stop Loss |
|---|---|---|---|---|
| QQQ | 751.27 | 749.27 | 777.63 | 732.97 |
| NVDA | 229.28 | 228.30 | 249.00 | 217.00 |
| XLE | 65.08 | 66.26 | 71.30 | 63.64 |
| XLV | 170.81 | 171.31 | 178.53 | 167.49 |
| KO | 88.05 | 88.70 | 92.24 | 86.14 |
| EUR/USD | 1.1200 | 1.11761 | 1.10259 | 1.12754 |
| JPM | 332.99 | 335.59 | 357.89 | 326.58 |
| TSM | 453.31 | 451.81 | 483.48 | 437.67 |
| US 500 | Benchmark | 7,820.00 | Not set | Not set |
Build Your Own Portfolio in RoboForex StocksTrader
Stocks, ETFs and currencies from this portfolio, all on one platform.
Potential Profit and Risk of the Portfolio
At the actual entry prices, if all eight Take Profit levels are reached and the portfolio is not closed early, the profit comes to about 803 USD, or 8.0% of the deposit, before the spread and overnight fees. If all eight Stop Loss levels are hit exactly at their prices, the loss comes to about 428 USD, or 4.3%. After an earnings report the price can jump past a stop, so the actual loss can be larger.
The total size of all eight open trades is 15,696.20 USD. Stocks and ETFs account for about 12,343 USD of it, within the 20,000 USD the account can hold at the maximum leverage of 1:2.
Closing rule
If the total profit of the portfolio, counting open positions, reaches 500 USD before 23 October, all remaining positions are closed. Otherwise they are closed on Friday 23 October after the US market opens, whatever the result.
Five dates shape the cycle. Two company reports and two inflation releases on the economic calendar fall in the first four days.
AI portfolio cycle 2: from the first order to the result
- 12 OctoberNowPortfolio openedAll eight positions after the US open, together with the US 500 benchmark.
- 13 OctoberJPMorgan reportThe bank publishes its quarterly results, the event behind the JPM trade.
- 14 OctoberUS consumer inflationThe consumer price index for September, the main test for rate expectations.
- 15 OctoberProducer inflation and TSMCUS producer prices and the TSMC quarterly report on the same day.
- 23 OctoberPortfolio closesAll remaining positions close after the US open, and the result goes up on this page.
Three Trades With the Best Target-to-Stop Ratio
The ratio compares the distance to the target with the distance to the stop. At the actual entry prices the same three trades lead:
- JPM, about 2.48 to 1. The distance to the target is 2.48 times the distance to the stop. The report on 13 October can lift the shares quickly if the bank shows steady income and keeps a confident outlook.
- TSM, about 2.24 to 1. Strong September revenue raises interest in the report on 15 October. For the shares to rise, the company needs to confirm high demand and give a convincing forecast.
- XLE, about 1.92 to 1. If oil stays expensive, energy stocks can beat the broad market. The main risk is a fast drop in oil prices on supply news or an easing of the conflict.
AI Portfolio vs the US 500
To check how well the AI built the portfolio, we compare it with a simple alternative: about the same total size in the US 500, 2 lots bought at 7,820.00 at the same moment as the portfolio. That is 15,640 USD against 15,696 USD in the AI portfolio's open trades. If the AI portfolio closes early at its profit target, the US 500 comparison ends at the same moment, or at the next market open.
Dividends count on both sides: dividend adjustments on the US 500 and any dividends on the stocks and funds in the portfolio.
AI Portfolio Result After 10 Trading Days
The result is published on this page when the portfolio closes, on 23 October 2026 or earlier if the closing rule is triggered, together with a screenshot of the account history and the outcome of every position.
AI portfolio vs the US 500, 12 to 23 October 2026
AI portfolio
Published on 23 October
US 500, 2 lots
Published on 23 October
The difference between the two, in percentage points, goes here when the portfolio closes.
What This AI Portfolio Tests
The second AI portfolio is more concentrated on events than the first. It counts on technology and AI stocks, adds bank and TSMC earnings as catalysts, keeps oil through XLE, and hedges with healthcare, consumer goods and a sell of EUR/USD. The first tests come in the first four days: the JPMorgan report, two inflation releases and the TSMC report.
On 23 October this page will show whether the AI closed the 34 USD gap to the US 500 from the first cycle, and the running score after two rounds.
FAQ
What is the AI portfolio experiment?
The AI model GPT-6 Sol builds a portfolio for a 10,000 USD demo account in StocksTrader with a horizon of 10 trading days. The AI chooses the instruments, the position sizes and the Take Profit and Stop Loss levels. We open the positions, close them on schedule and publish the result next to a US 500 position of the same size.
How did the previous AI portfolio do?
The first AI portfolio, 28 September to 9 October 2026, earned 148.43 USD, or 1.48% of the deposit. A US 500 position of the same size made 182.50 USD with dividends, so the index finished 34.07 USD ahead.
What did the AI put in this portfolio?
Eight positions in four blocks. QQQ, NVDA and XLE form the core, XLV and KO are defensive, a sell of EUR/USD is the currency block, and JPM and TSM are the tactical block, built around their earnings reports. Part of the deposit stays free as a reserve.
How much can the AI portfolio gain or lose?
At the actual entry prices, all eight Take Profit levels would bring about 803 USD, or 8.0% of the deposit, before costs. All eight Stop Loss levels would cost about 428 USD, or 4.3%, and a price jump after an earnings report can make the loss larger.
When will the results be published?
On 23 October 2026, after the positions are closed at the US market open. If the portfolio reaches a total profit of 500 USD earlier, it closes early and the result is published then.
Any forecasts contained herein are based on the author's independent analysis and reflect their personal opinion. These articles should not be construed as trading recommendations or a call to action. The authors and RoboForex accept no responsibility for the results of any trades made on the basis of these recommendations and reviews. Past performance is not indicative of future results. Trading stocks and CFDs involves a high risk of capital loss.