Why Are Treasury Yields Rising? Two Explanations and How to Check Them

Why are Treasury yields rising? The 10-year US Treasury yield stood near 4.87% on 9 November after trading above 5.25% in early October, CNBC reported. Two explanations compete for the credit, a rising fiscal risk premium and heavy bond issuance by AI companies, and this article shows the indicator that separates them.
TL;DR
- Economist Robin Brooks points to a rising fiscal premium. Some Wall Street analysts point to AI-company bond issuance, Fortune reported.
- The indicator that separates them is the 10y10y forward rate. Brooks says it did not fall during last week's AI sell-off, and he reads that as support for the fiscal version. A calculated version on TradingView rose about 2 basis points from 4 to 6 November while the 10-year yield fell about 3.
- Goldman expects a 4.75% to 5.0% range for the 10-year yield if risk assets, such as stocks, stabilise and lower energy prices hold. The three scenarios below are the author's hypotheses.
Last updated: 10 November 2026
This article explains the move in plain words, sets the two explanations side by side, shows how to read the 10y10y forward rate and lists the conditions that would point the yield to different levels. Both explanations are opinions. The numbers come from CNBC, Fortune and Brooks' own post.
Follow Stock Markets in RoboForex MobileTrader
Quotes, charts and orders in one app, on your phone or in Telegram.
Why Are Treasury Yields Rising? What Happened to the 10-Year Yield
The 10-year Treasury yield is the annual return investors earn by lending money to the US government for ten years. When investors want more for that loan, the yield goes up and the price of the bonds already in circulation goes down.
According to Fortune, the 10-year yield rose by more than 100 basis points, went above 5% and at one point reached its highest level in 24 years before dipping. A basis point is one hundredth of a percentage point, so 100 basis points equal one full percentage point. Fortune links the start of the rise to the war with Iran that began in late February, which pushed oil prices up and raised expectations that the Federal Reserve would hike rates.
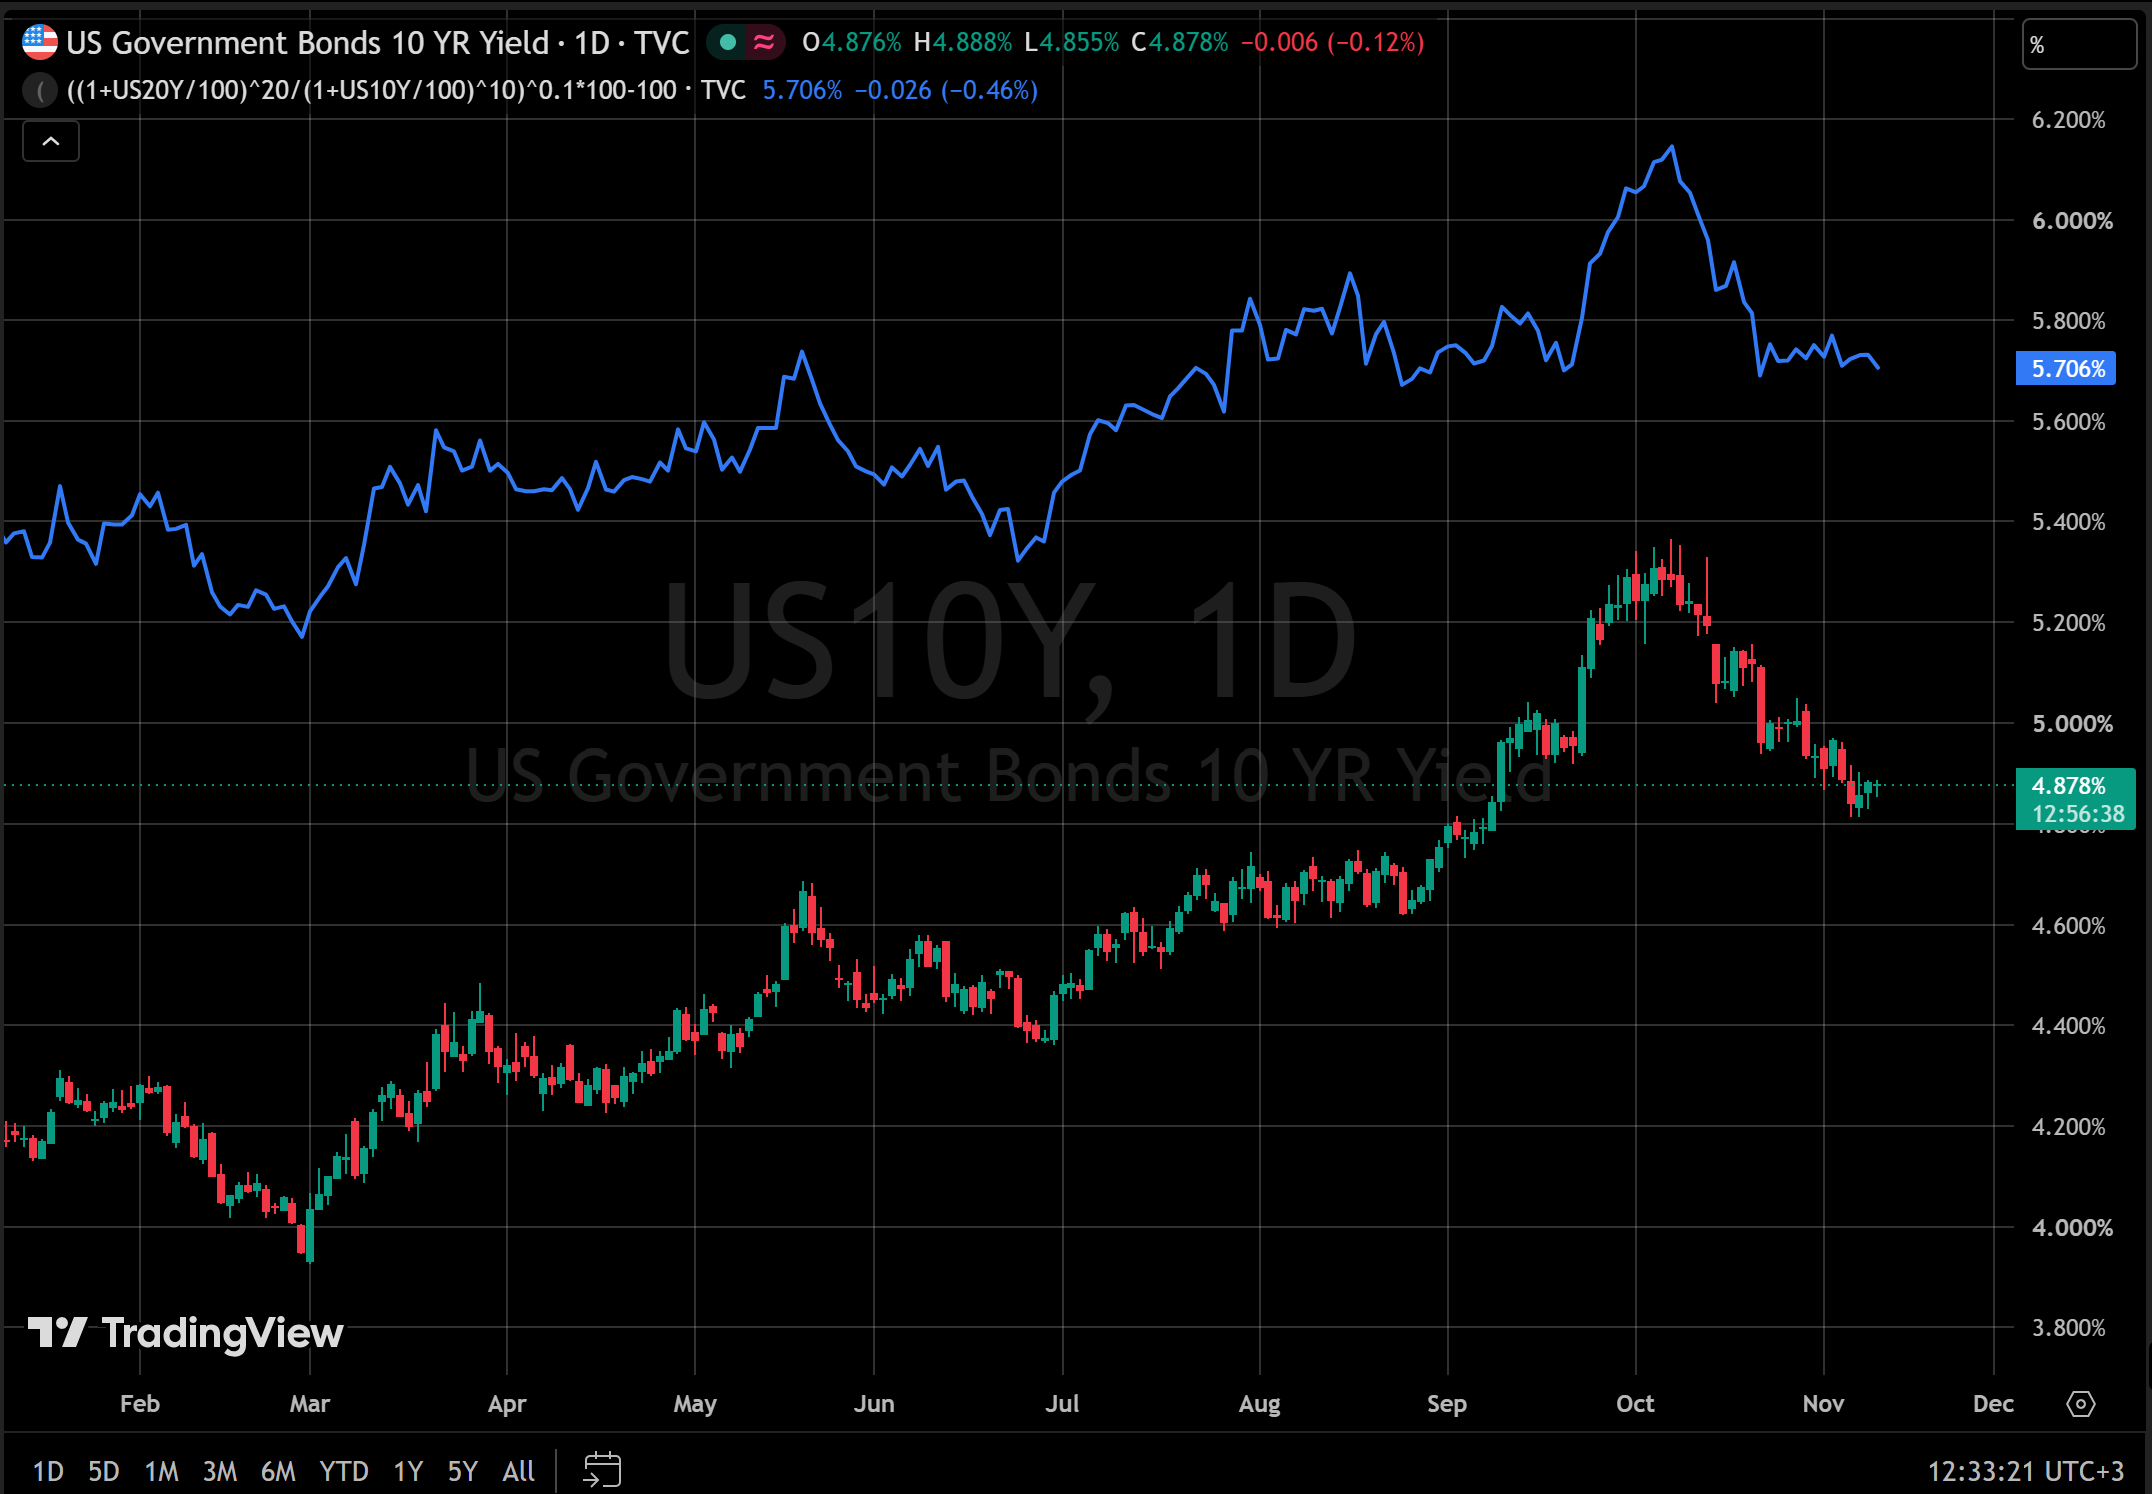
On 9 November the yield stood near 4.87%, against more than 5.25% in early October, CNBC reported. TradingView data give more detail. The yield stood at 5.289% on 30 September, reached 5.365% at its October peak, stood at 4.843% on 5 November and traded near 4.88% on 10 November, before the CPI release. The sources do not give the date when the 100 basis point count starts or the date of the peak, so this article does not state them.
The chart below shows the 10-year yield as candles. The blue line is the 10y10y forward rate, which a later section explains.
Explanation One: A Rising Fiscal Premium
What the premium means
A fiscal risk premium is the extra yield investors ask for when they lend to a government with large deficits and a growing debt. The bigger the borrowing, the more they demand for holding the bonds for a long time. Brooks, an economist at the Brookings Institution, argues in a 7 November post that this premium drives the rise in long-term yields. This is his view, and it is one of two views in this article.
The numbers behind it
Fortune reports figures for the US budget in fiscal 2026. They are the evidence this explanation rests on.
| Item | Fiscal 2026 | Comparison |
|---|---|---|
| Budget deficit | 1.99 trillion USD | 1.78 trillion USD in fiscal 2025, 12% larger |
| Revenue | 5.4 trillion USD | Up 3% |
| Spending | 7.4 trillion USD | Up 6% |
| Net interest payments | 1.05 trillion USD | Up 8% |
| Net interest as a share of GDP | 3.2% | Peterson Foundation estimate, the highest since 1991 |
Spending grew twice as fast as revenue, 6% against 3%, and the interest bill grew 8%. Fortune also reports that gross interest costs reached 1.36 trillion USD at an average interest rate of 3.53%. These are budget facts. What they mean for yields is the question Brooks answers with the indicator in the next sections.
Brooks' reading
Brooks says the long end of the Treasury market moves with public borrowing. In his post he sets this against corporate borrowing, which he describes as nowhere near the levels of the early-2000s technology bubble, while public borrowing is historically high, Fortune wrote.
Explanation Two: Bond Issuance by AI Companies
The second explanation looks at supply. Large technology companies, called hyperscalers because they run very large data-centre networks, have been issuing a lot of new debt in connection with AI. Fortune reports that some Wall Street analysts say this debt crowded out US government bonds and forced the Treasury to offer higher yields at its auctions. The logic is simple: when more bonds compete for the same pool of investor money, borrowers have to pay more.
Brooks disputes this. In his post he argues that corporate borrowing is far below the level of the early-2000s bubble and that public deficits are the more likely driver. The two sides agree on what happened to the yield and disagree on the cause, which is why an indicator that reacts differently to each cause is useful.
How to Check Which Explanation Fits the Data
The 10y10y forward rate
The 10y10y forward rate is the 10-year yield that the bond market implies for a loan starting ten years from today. It looks past the next decade of interest-rate policy and the business cycle. Fortune describes it as a gauge of the premium investors demand for holding Treasuries over the long term, including debt and deficit risks.
The reading rule comes from Brooks. If AI-company issuance were pushing long yields up, the 10-year yield and the 10y10y forward should fall together when AI stocks fall. If the 10y10y forward stays put while the 10-year yield falls, the long-term premium has not eased, and that supports the fiscal version. The sources give no level for the 10y10y forward. The blue line on the first chart is an approximation calculated from the 10-year and 20-year Treasury yields, so it can differ from the series Brooks uses. It stood near 5.7% on 10 November, before the CPI release. The next section applies the reading rule to its closing values.
A natural experiment
Brooks calls last week's AI sell-off a natural experiment. During the sell-off in AI-related stocks the 10-year and two-year yields fell, while the 10y10y forward did not, according to Fortune. In his reading, AI borrowing is not the main force behind the rise in long yields.
TradingView closing values for the calculated 10y10y line show the same pattern. From 4 to 5 November the 10-year yield fell from 4.890% to 4.843%, about 5 basis points, while the 10y10y line rose from 5.710% to 5.723%. The moves are small, a few basis points, so they support Brooks' reading without proving it.
| Date | 10-year yield | 10y10y forward (calculated) |
|---|---|---|
| 4 November | 4.890% | 5.710% |
| 5 November | 4.843% | 5.723% |
| 6 November | 4.859% | 5.731% |
| Change, 4 to 6 November | Down 3.1 basis points | Up 2.1 basis points |
He adds a second observation from the jobs report. Payrolls, the monthly count of new US jobs, came in at 165,000 against a consensus, the average forecast of economists, of 70,000. The two-year yield rose about 5 basis points after the release, and Fortune reports it rose more than strong growth alone explains. Brooks says the reaction was not muted, as it would be if AI were central to US growth.
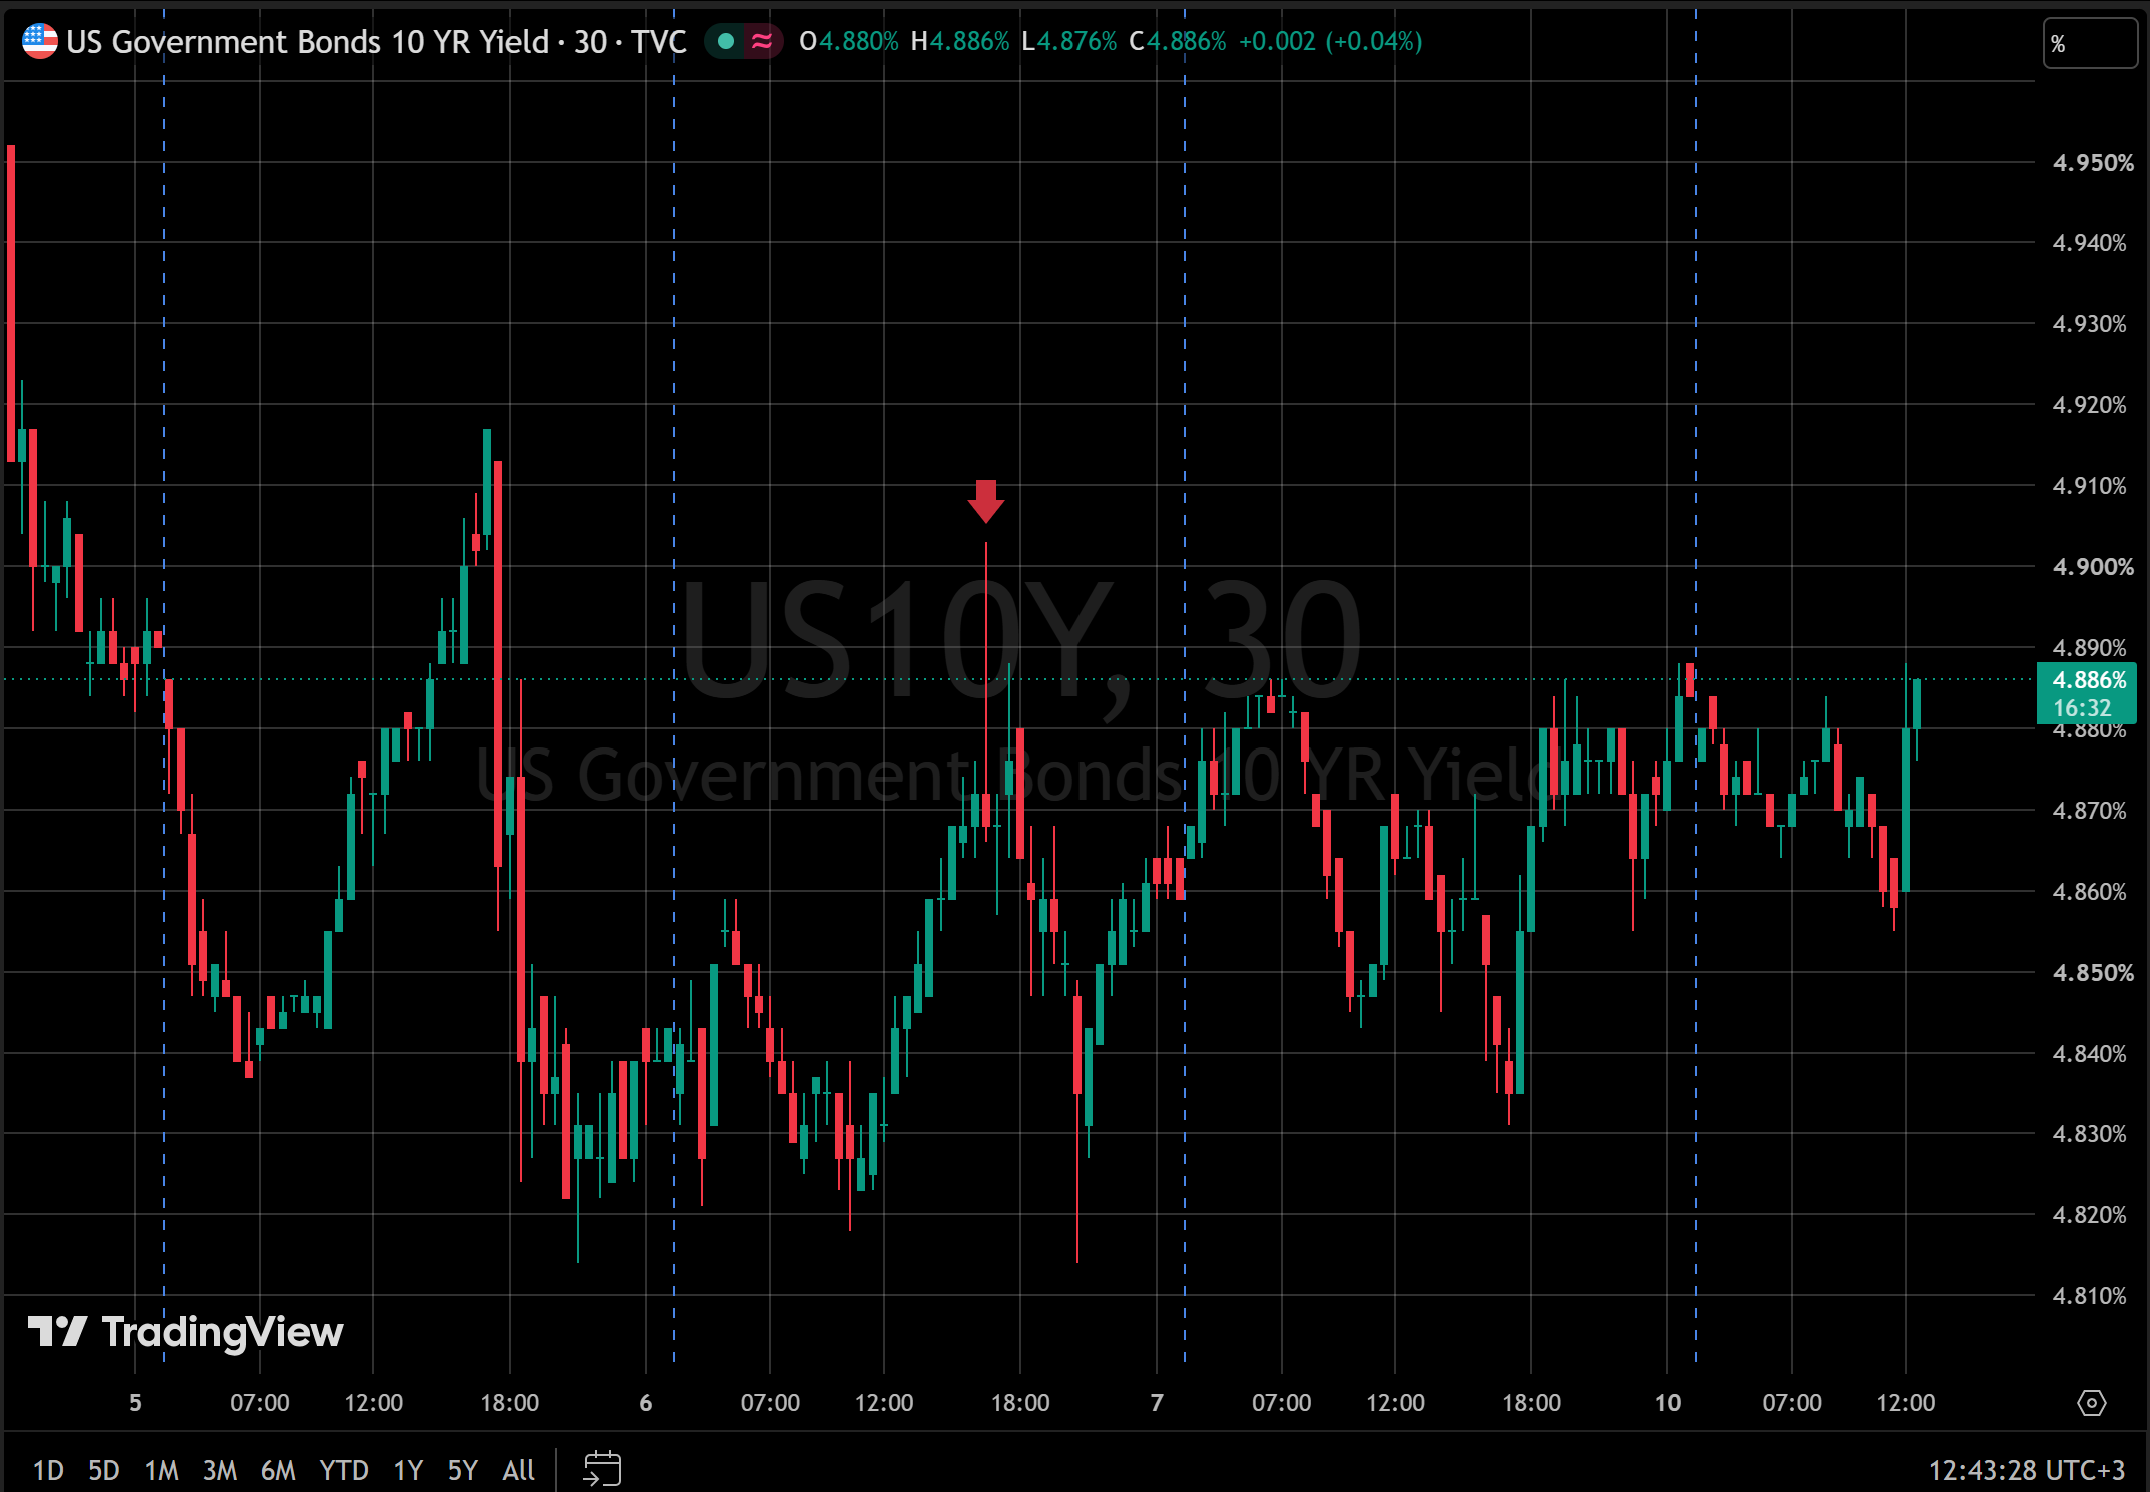
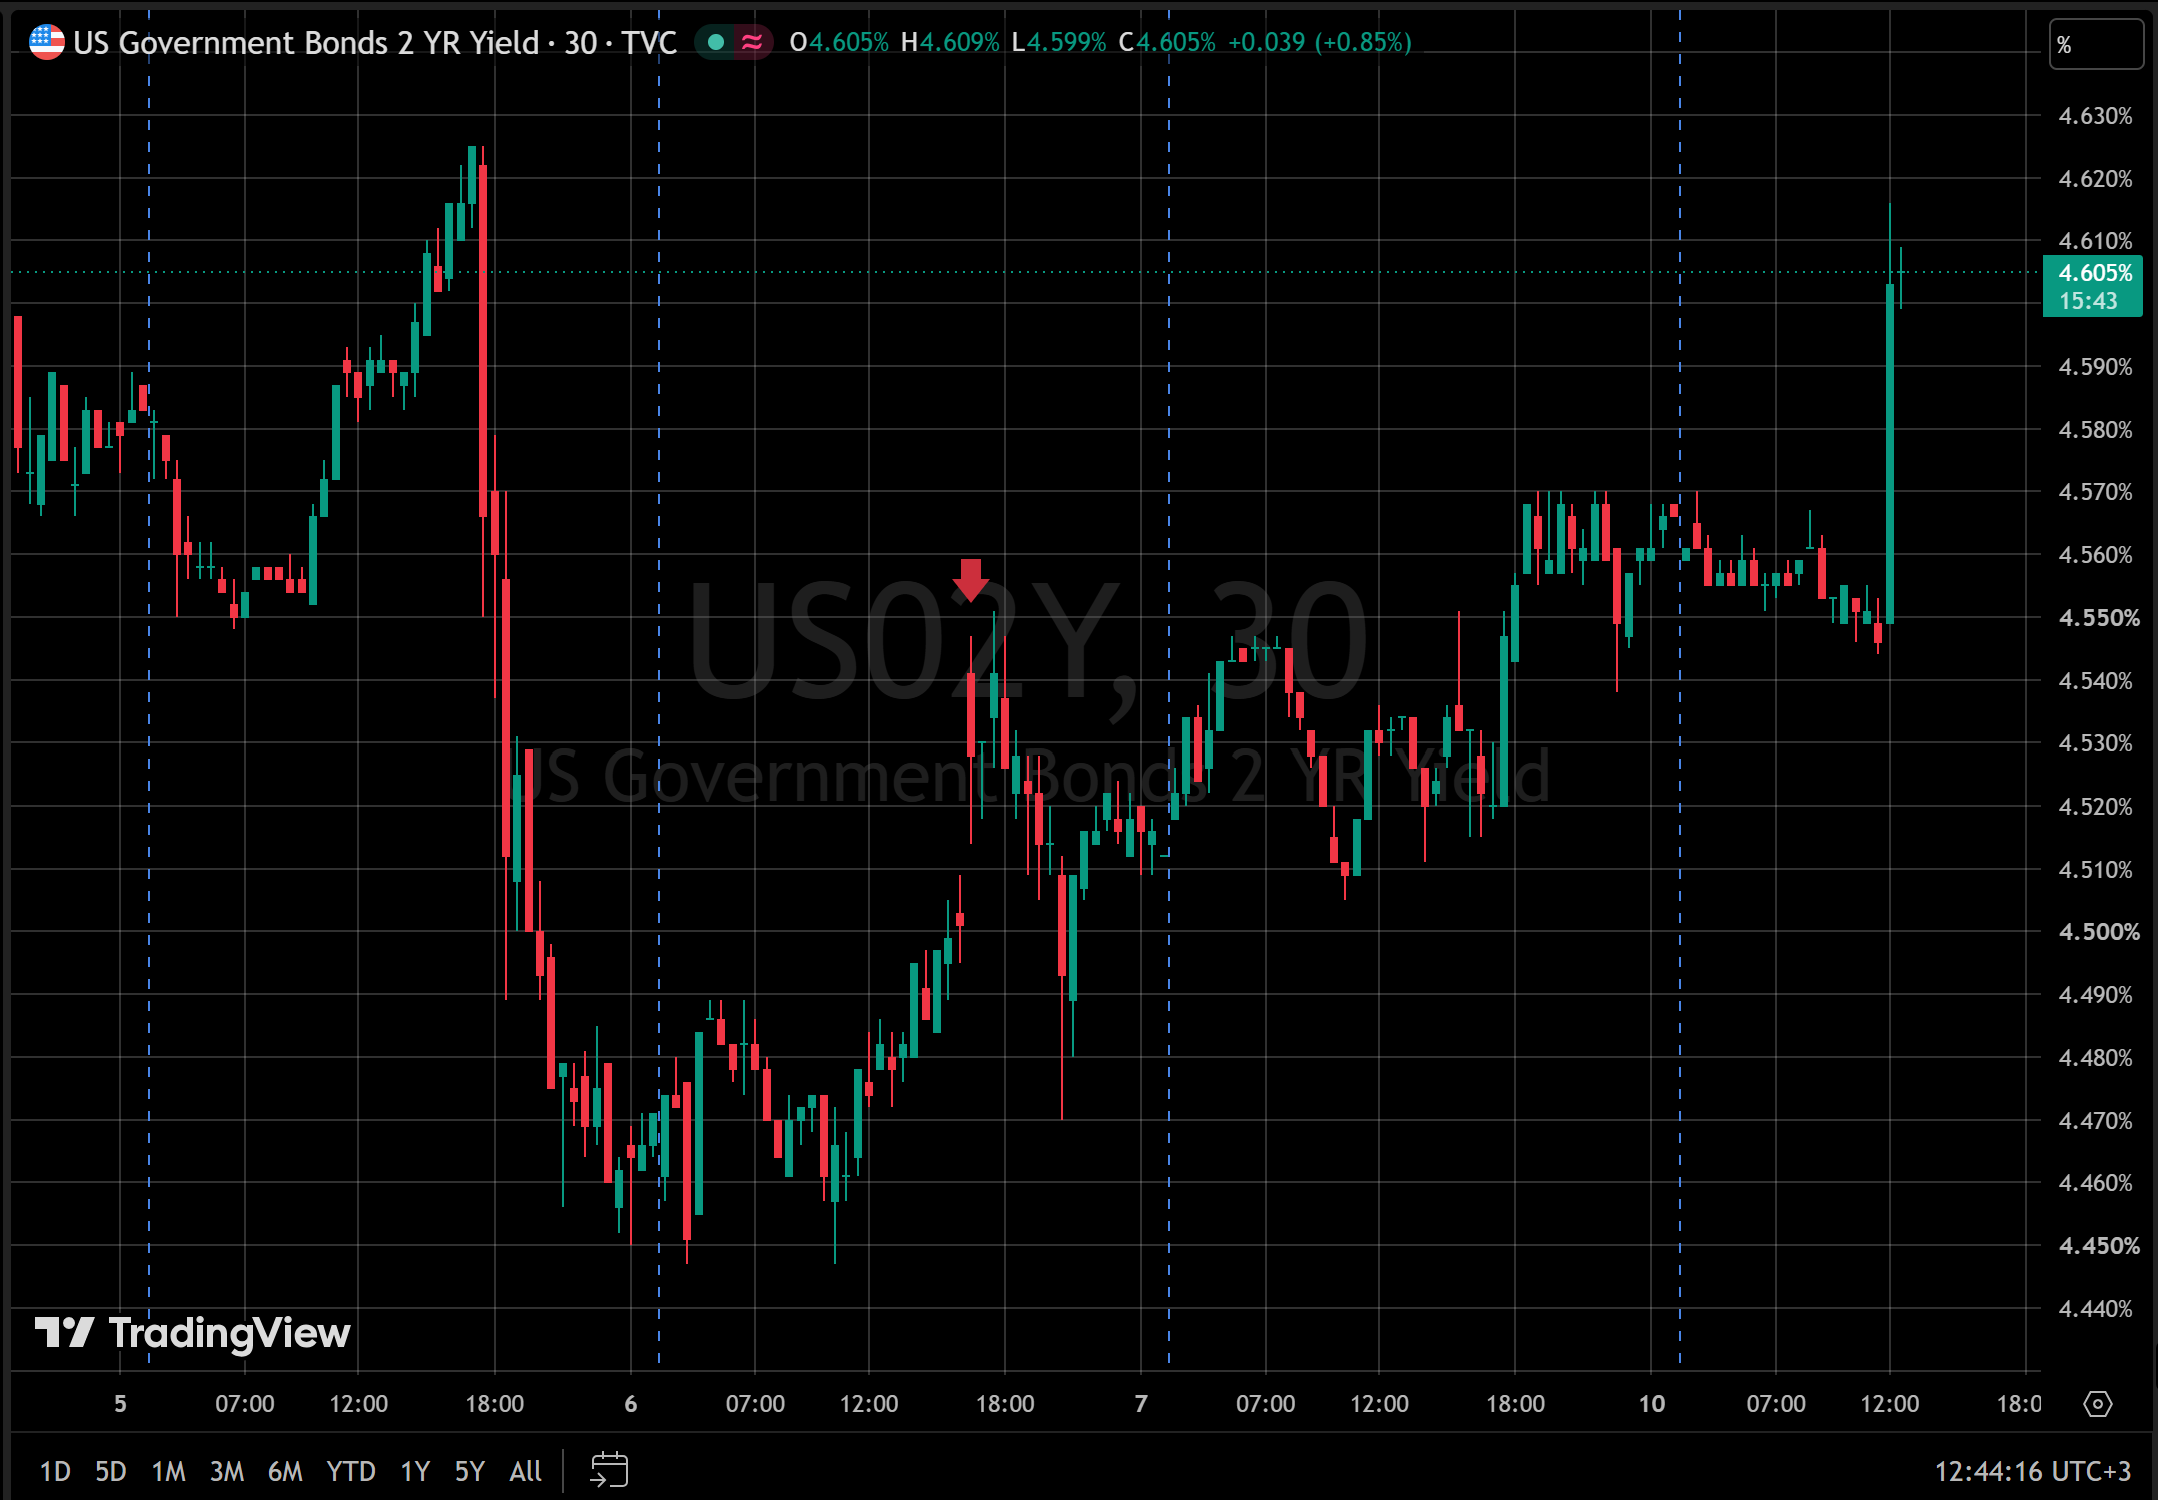
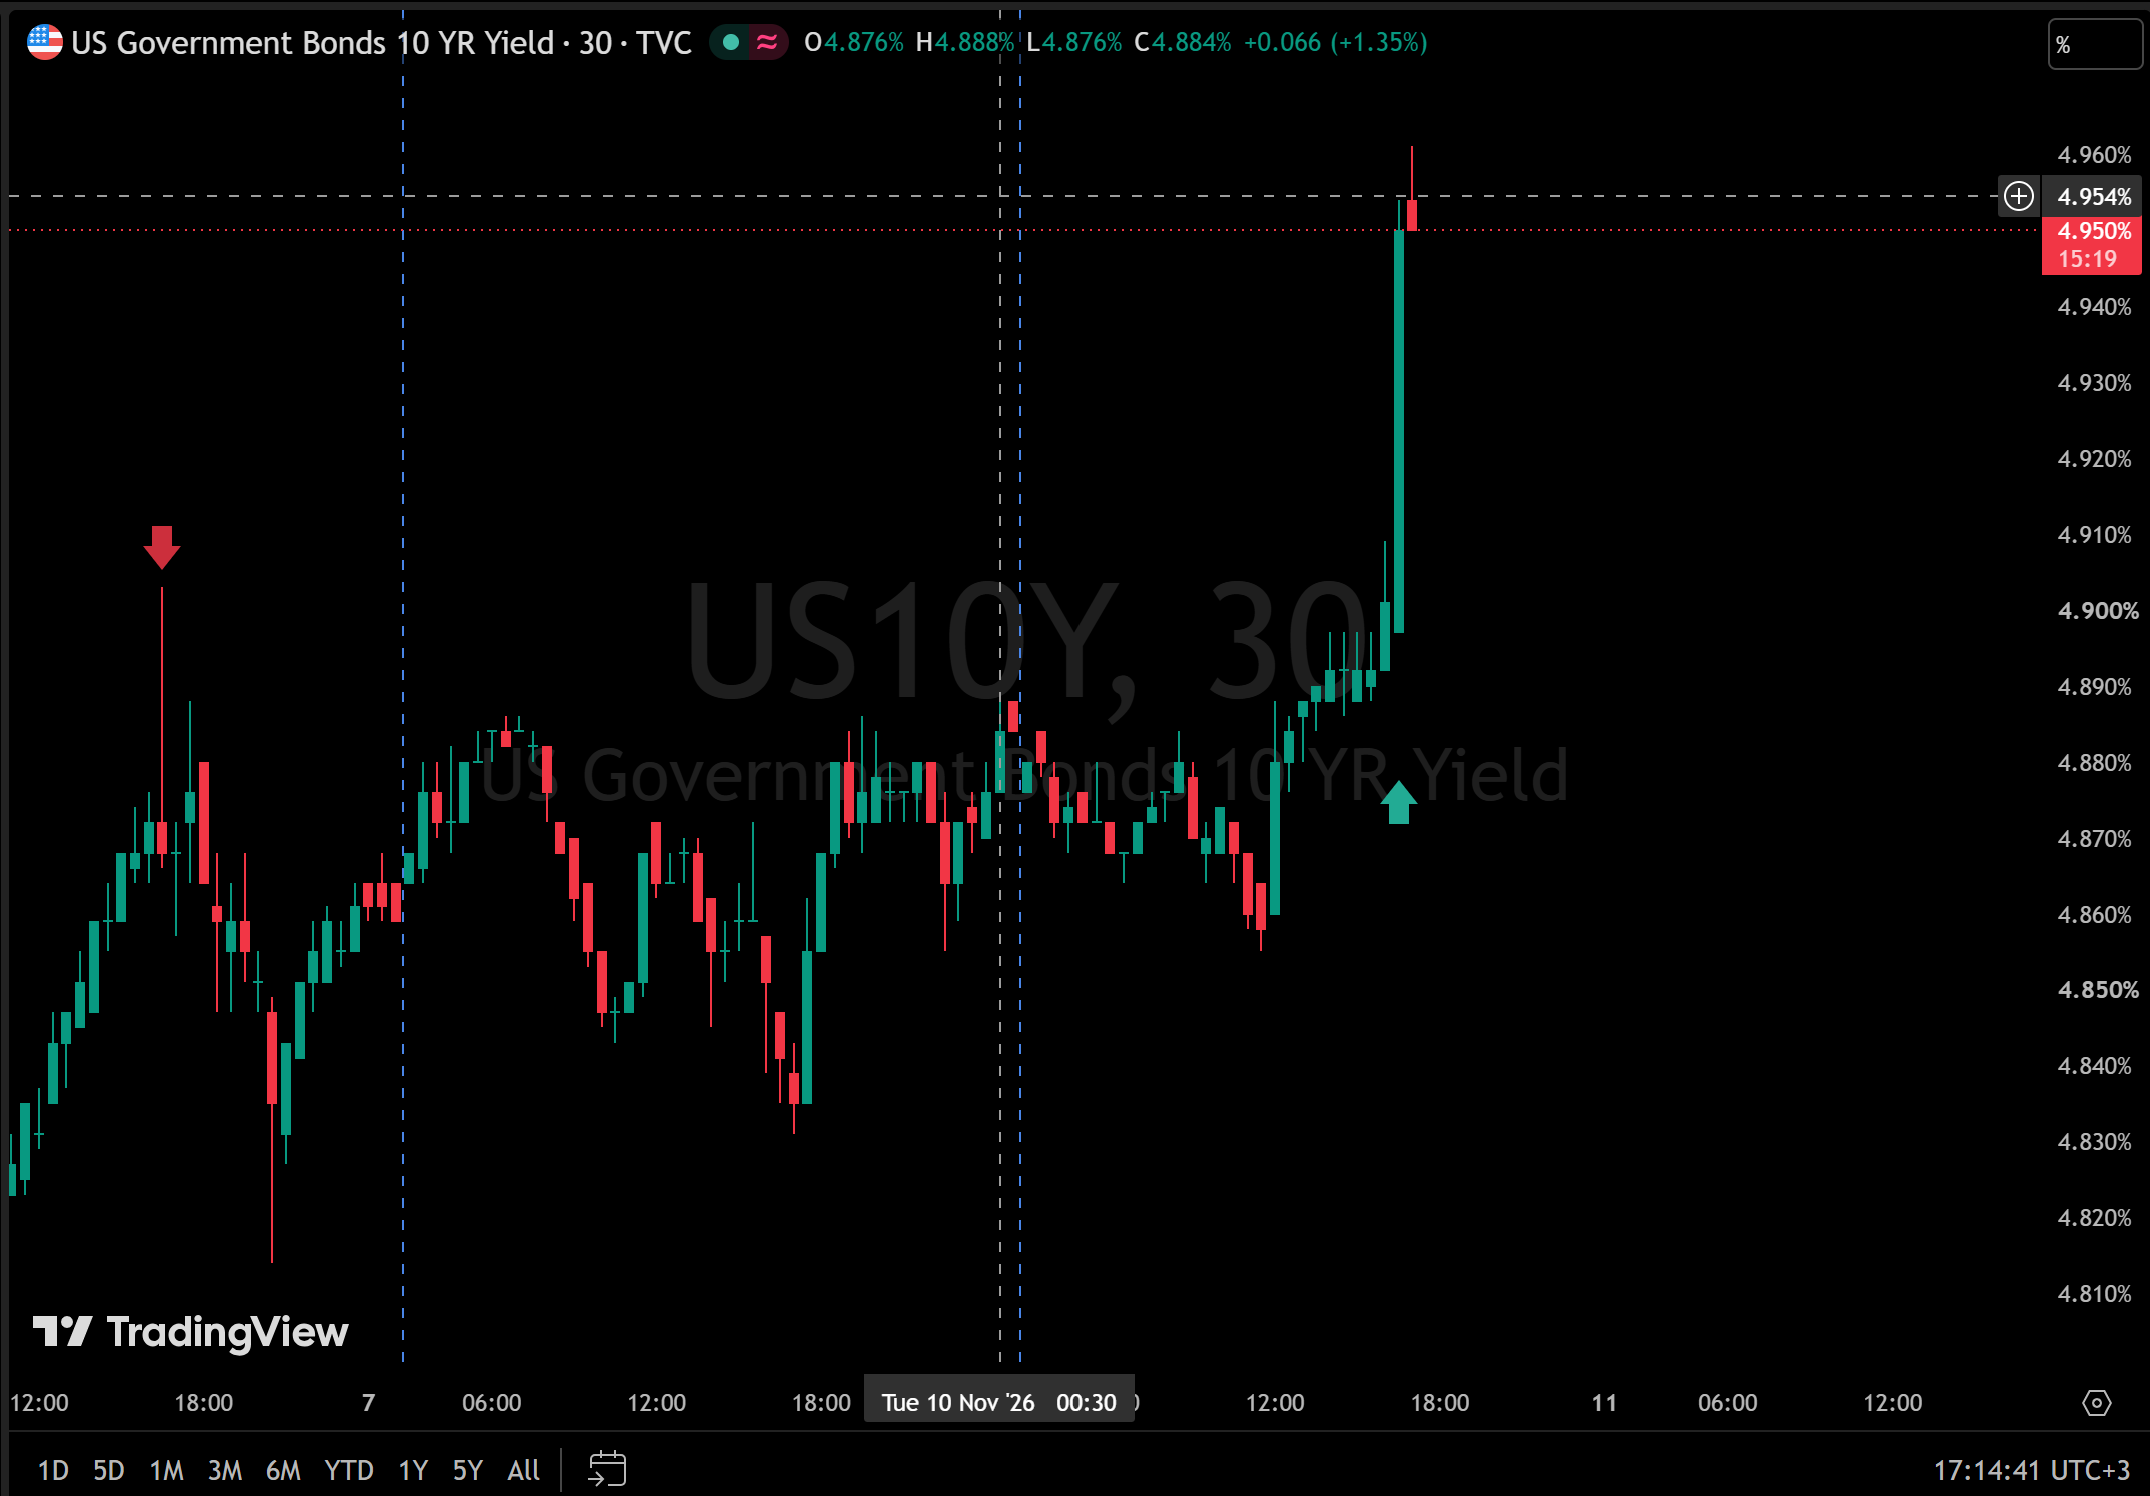
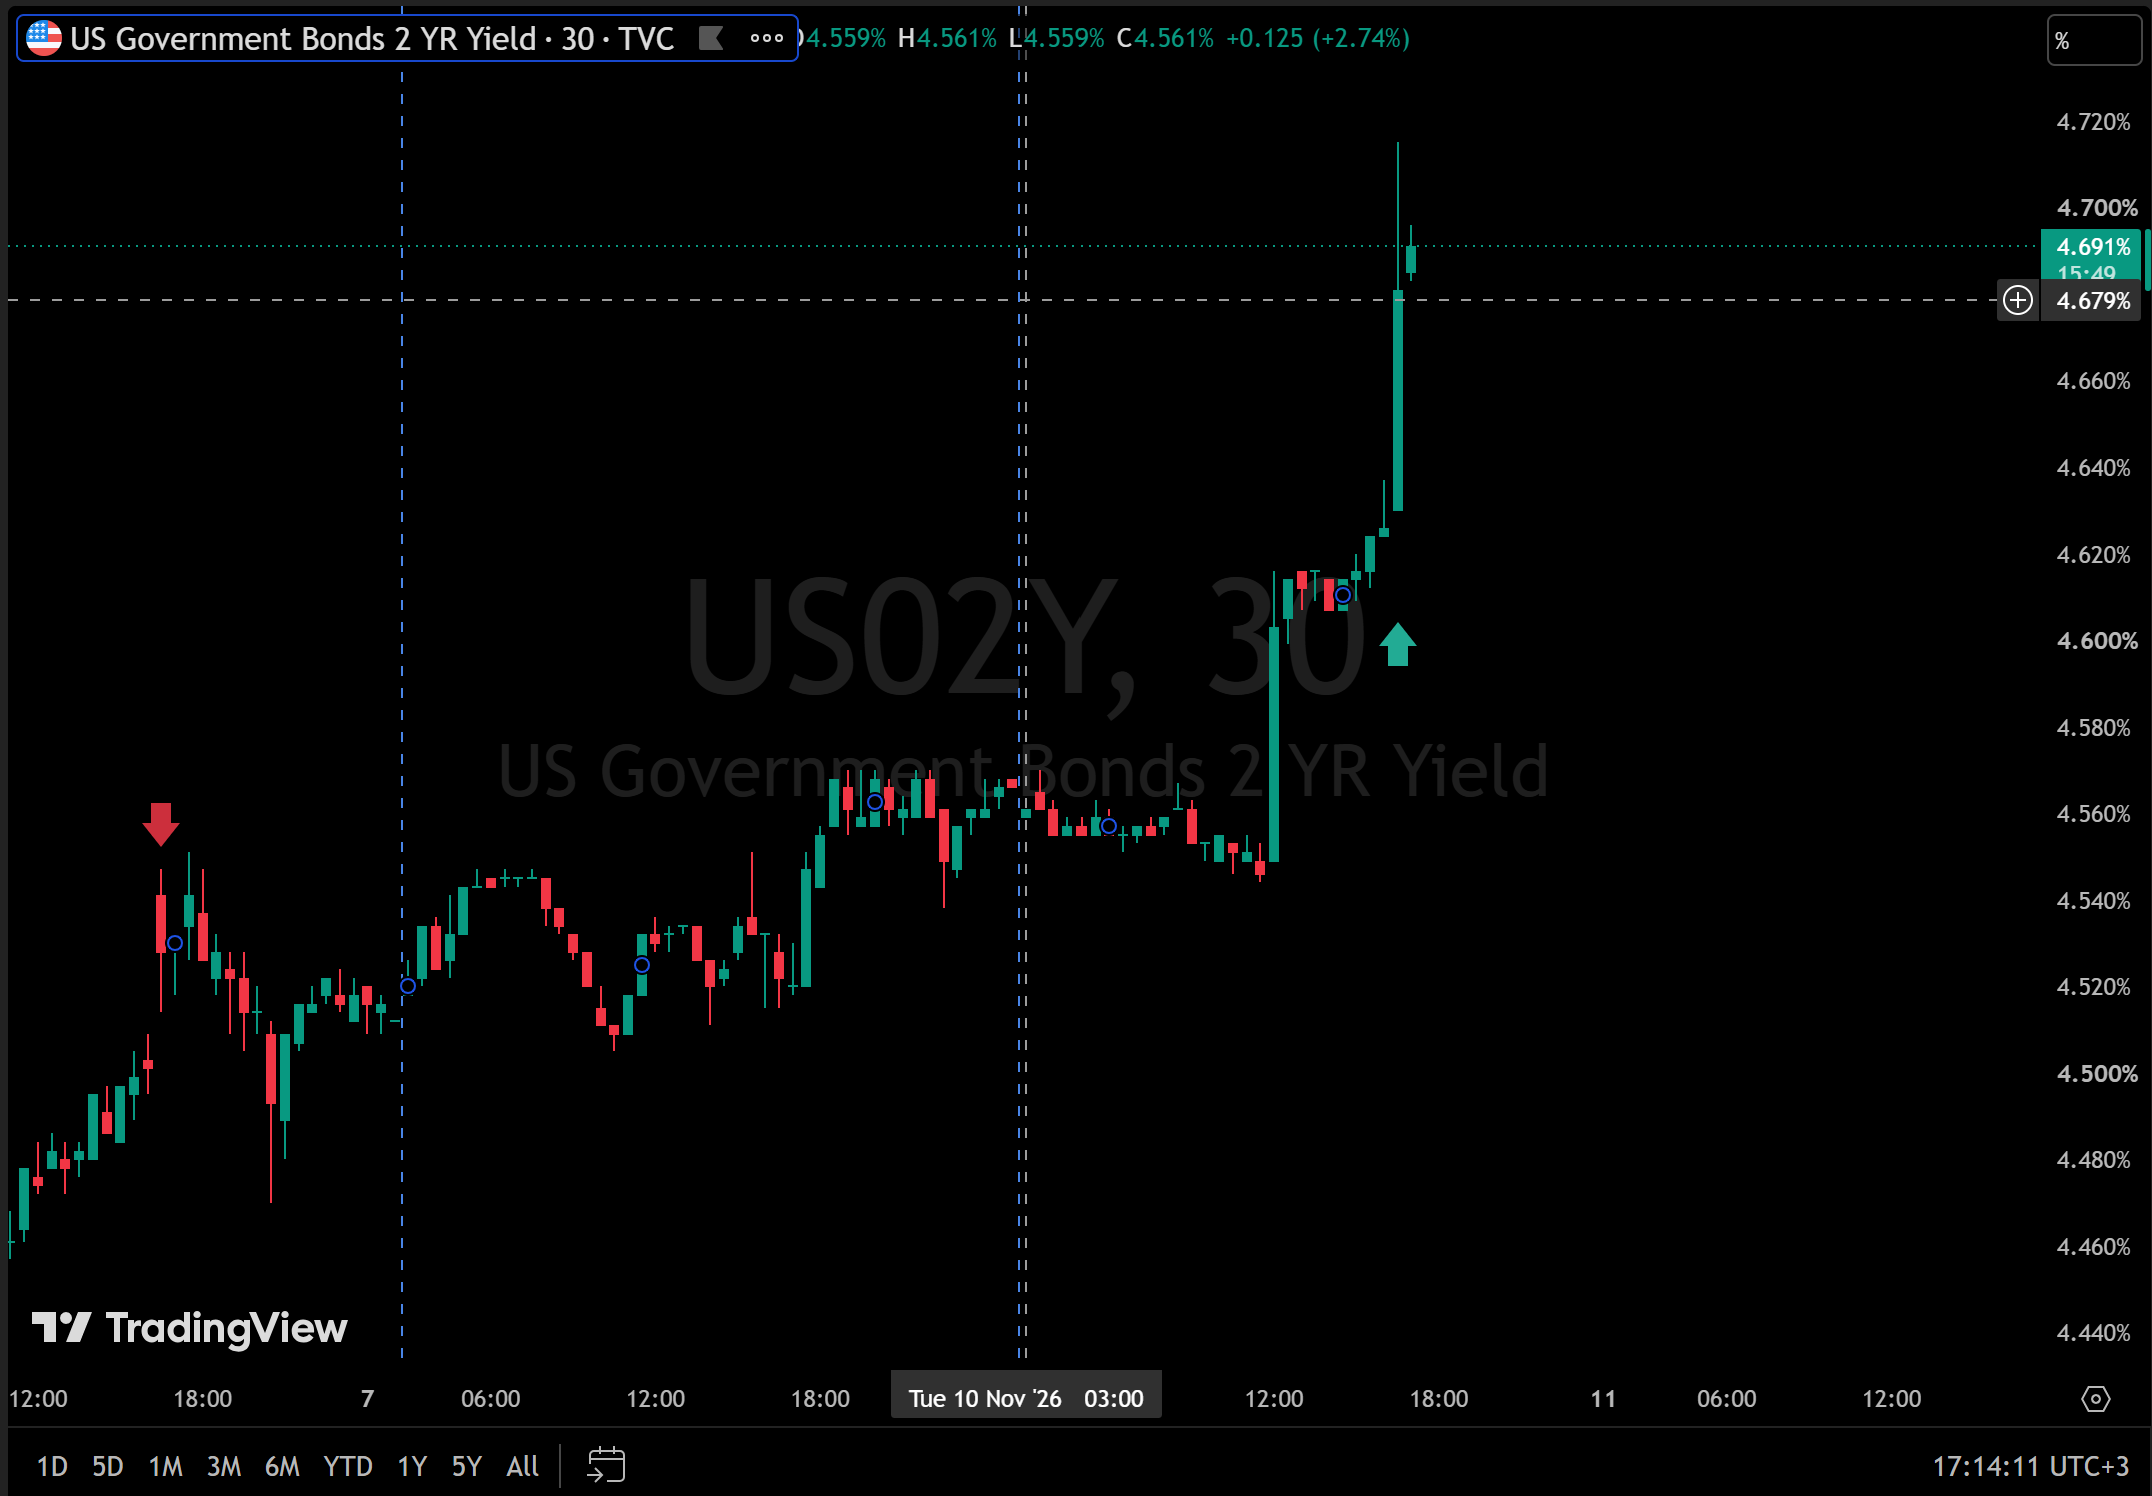
The two charts below show 30-minute candles for the 10-year and two-year yields from 5 to 10 November. Axis times are UTC+3. Both yields fell sharply on the evening of 5 November, and the red arrow marks the 6 November jobs report.
| Explanation | Who points to it | What the 10y10y forward should do when AI stocks fall | What Brooks found |
|---|---|---|---|
| Rising fiscal premium | Robin Brooks, Brookings | Stay put, because the premium on government debt has not changed | It did not fall with the 10-year and two-year yields |
| Bond issuance by AI companies | Some Wall Street analysts (Fortune) | Fall together with the 10-year yield, because less AI borrowing means less supply | No fall, which he reads against this version |
The table is a reading aid, built from Brooks' argument. One week is a short sample, and the 10y10y line on the chart is an approximation, so the check shows which version the data favoured this week and does not settle the debate.
The 10-year yield against Goldman's range
4.50%5.00%5.50%
- Goldman range: 4.75% to 5.0%
- 9 November: near 4.87%
- Early October: above 5.25% (the mark shows 5.25%)
Scale from 4.50% to 5.50%. Source: CNBC, 9 November 2026. The range is Goldman's opinion. Levels are approximate.
Where the 10-Year Yield Could Go Next: Three Scenarios
Goldman strategists expect the 10-year yield to settle in a 4.75% to 5.0% range if risk assets such as stocks stabilise and lower energy prices hold, CNBC reported. That is the bank's opinion. CNBC also reported that the MOVE index, which measures expected volatility in Treasury options, stood near 93, against more than 113 in early October. A lower MOVE means the options market expects calmer trading in Treasuries.
The three scenarios below are the author's hypotheses. Each one pairs a condition with a level to watch and a condition that cancels it. They are educational examples and carry no price targets.
Scenario 1. The range holds
If lower energy prices hold and the MOVE index stays near 93 or lower, then Goldman's 4.75% to 5.0% range stays the working picture. Cancelled if the MOVE index returns above 113 or energy prices rise again.
Scenario 2. The fiscal reading gains weight
If risk assets fall again and the 10y10y forward does not fall with the 10-year yield, then the evidence for the fiscal premium grows. Cancelled if the 10y10y forward falls together with the 10-year yield.
Scenario 3. Data lift the yield above 5.0%
If inflation or deficit data come in above forecasts, then the yield has a reason to leave the top of the range. The October CPI, released on 10 November at 08:30 ET as listed in the BLS schedule, came in above forecasts. Headline CPI rose 0.4% on the month against a consensus of 0.3%, and core CPI, which leaves out food and energy prices, rose 0.3% against 0.2%. Cancelled if the data match or undershoot forecasts, which did not happen on 10 November. The yield reaction is shown in the charts below.
The two charts below were taken at 17:14 UTC+3 on 10 November, about 45 minutes after the CPI release. The green arrow marks the release and the red arrow marks the 6 November jobs report. The 10-year yield rose to about 4.95% and the two-year yield to about 4.69%. The 10-year level is still below the 5.0% top of Goldman's range, so the yield moved towards the top of the range and did not leave it.
What Treasury Yields Mean for Stock Investors
Treasury yields are the return on the safest large asset in the market, so they set the bar every other asset has to clear. When the 10-year yield rises, a stock has to offer more to look attractive next to a government bond. Shares of companies whose value depends on profits far in the future tend to feel this most, because their future profits are worth less when discounted at a higher rate.
The sources used here do not quantify the effect on stocks, mortgage rates, the dollar or gold, so this article names the channels and gives no figures for them. To follow the broad stock market while the yield moves, the US 500 live chart shows the index in real time, and the indices page lists the instruments available. Stocks and ETFs trade on StocksTrader. Put the CPI date in the economic calendar, and see how inflation data moves markets in our guide to the consumer price index.
Conclusion
The 10-year yield moved from above 5.25% in early October to near 4.87% on 9 November, and two explanations compete for the rise. A 10y10y forward rate that holds steady while the 10-year yield falls supports the fiscal premium, and a 10y10y forward rate that falls together with the 10-year yield supports the AI issuance version. From 4 to 6 November the calculated 10y10y line rose about 2 basis points while the 10-year yield fell about 3, which fits the fiscal reading over one short window.
FAQ
Why are Treasury yields rising?
Two explanations compete. Economist Robin Brooks points to a rising fiscal premium, the extra yield investors ask for when lending to a government with large deficits. Some Wall Street analysts point to heavy bond issuance by AI companies. Fortune links the start of the rise to the war with Iran, which pushed oil prices up and raised expectations of a Fed rate hike.
What happens if Treasury yields rise?
The price of bonds already in circulation falls, and new government borrowing costs more. Net interest payments in the US budget reached 1.05 trillion USD in fiscal 2026, up 8%, according to Fortune. Higher yields also set a higher bar for stocks, which have to offer more to compete with government bonds.
How do Treasury yields affect the stock market?
A higher 10-year yield makes government bonds more attractive next to stocks and lowers the present value of profits expected far in the future. The sources used in this article give no figures for the size of the effect, so the article describes the channel and gives no measurement.
What is the 10y10y forward rate?
It is the 10-year yield that the bond market implies for a loan starting ten years from today. Fortune describes it as a gauge of the premium investors demand for holding Treasuries over the long term. Brooks says it did not fall with the 10-year and two-year yields during the AI sell-off.
- CPI in Forex Trading: What It Is and How It Moves Prices: how one inflation number reaches bond yields and stocks.
- What Is an Economic Calendar and Why Every Trader Should Use It: how to track CPI, auctions and other dates that move yields.
- US Dollar Index (DXY): What It Is and How to Use It in Forex: the dollar gauge that traders read next to Treasury yields.
Any forecasts contained herein are based on the author's independent analysis and reflect their personal opinion. These articles should not be construed as trading recommendations or a call to action. The authors and RoboForex accept no responsibility for the results of any trades made on the basis of these recommendations and reviews. Past performance is not indicative of future results. Trading stocks and CFDs involves a high risk of capital loss.