Why Is Gold So Expensive? What Drives Gold Prices Right Now
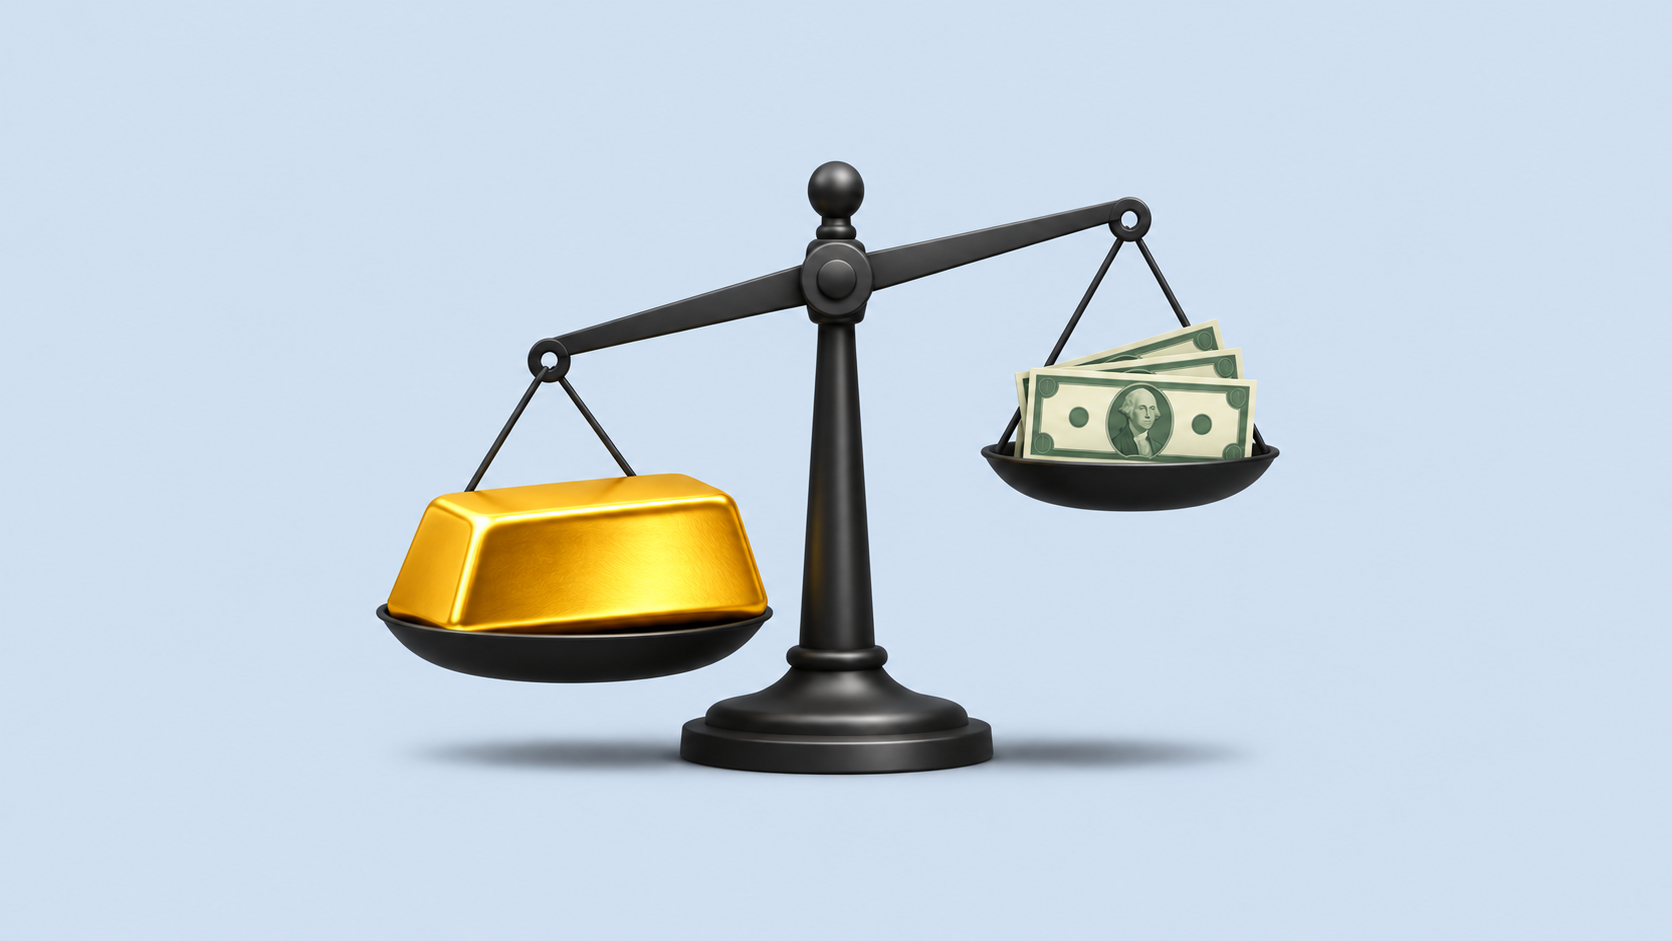
Why is gold so expensive? Even after falling about 25% from its January record, gold averaged 4,262 USD an ounce in the third quarter of 2026, 23% more than a year earlier, according to the World Gold Council. Central banks are buying about 40% faster than their five-year average and investors keep adding to gold funds, while higher US interest rates pull the price the other way.
TL;DR
- Check four numbers each month: Fed rate hike odds, the 10-year real yield, central bank purchases and gold fund flows.
- Rising real yields and a stronger dollar weigh on gold, buying by central banks and funds supports it.
- This page explains why the price moves. For price levels and scenarios, use the Long XAUUSD forecast.
Last updated: 11 November 2026. Data as of 10 November unless a date is given.
This page lists the nine drivers of the gold price with the latest figure for each, ranks the top 10 gold reserves by country, explains what pushed gold down from August to October and what moved it in November, and shows where to check every driver yourself. It is updated once a month.
Why Is Gold So Expensive Right Now?
Gold is expensive because central banks keep buying in large volumes whatever the price, and because investors kept adding to gold funds through the autumn sell-off. The table shows the current reading of each driver and whether it supports the price or weighs on it.
| Driver | Latest data | Effect on gold |
|---|---|---|
| Central bank buying | 321 t in Q3 2026, +42% on a year earlier; 675 t since January | Supports |
| Gold funds (ETFs) | Record holdings of 4,275 t at the end of October, +2.7 billion USD inflow in the month | Supports |
| Fed interest rate | 3.75-4.00% after the September hike; after the 10 November CPI a December hike is almost fully priced, about 85% for 0.25 points and 15% for 0.5 points | Weighs |
| 10-year real yield | 2.63% on 6 November, down from 2.95% on 5 October, up from 2.42% at the end of August | Weighs, less than in October |
| US dollar (DXY) | 101.81 on 9 November; rose in late October, fell after the US election | Mixed |
| Oil and the Iran war | Oil kept inflation fears alive in October; Brent fell 5.85% on 9 November on hopes of a US-Iran deal | Mixed |
| Speculative traders | Sold gold positions worth 8 billion USD between 20 and 27 October | Weighs |
| Jewellery, bars and coins | Jewellery 312.9 t in Q3, -17%; bars and coins 267.8 t, -19% | Weighs |
| Mine supply and recycling | Mine output 1,070.9 t in Q3, a record; recycling 314.5 t, a three-year low | Neutral |
Sources: World Gold Council (Q3 2026 demand trends, ETF flows for October), Federal Reserve, FRED series DFII10, FXStreet and Reuters for 9 November, CME FedWatch via Yahoo Finance for 10 November, CFTC data as reported by Investing.com. Links in the sections below.
Why Is Gold Going Down?
Gold went down from August to October because the Fed raised interest rates and markets expect another hike, real yields climbed to 2.95% in early October and speculative traders sold. According to precious metals refiner Heraeus, quoted by Kitco, gold fell more than 15% from its late-August high and briefly traded below 3,900 USD. RoboForex quotes put that high at 4,697 USD on 25 August, and gold ended October near 3,913 USD, about 17% lower. The World Gold Council puts gold at the end of October around 25% below its January record on the LBMA benchmark price; from the intraday peak near 5,600 USD the fall was about 30%.
How the autumn fall unfolded
- Late JanuaryGold sets its record, near 5,600 USD an ounce.
- 25 AugustGold reaches its late-summer high near 4,700 USD.
- 16 SeptemberThe Fed raises its rate by 0.25 percentage points to 3.75-4.00%, all 12 votes in favour.
- 5 OctoberThe 10-year real yield reaches 2.95%, up from 2.42% at the end of August.
- 20-27 OctoberSpeculative traders sell 8 billion USD of gold positions; the dollar gains 0.6% and Brent crude 4.1%.
- 28 OctoberThe Fed holds its rate; two of 12 voters want another hike.
- 30 OctoberGold drops below 4,000 USD as investors sell metals to cover losses in tech stocks.
- 4 NovemberGold gains 3% after the US midterm elections, its biggest daily rise since 19 August.
- 10 NovemberOctober inflation comes in above forecast and gold falls about 2%.
Sources: Reuters and RoboForex quotes (record and the 25 August high), Federal Reserve (16 September, 28 October), FRED DFII10 (real yield), Investing.com via Yahoo Finance (20-27 October), Yahoo Finance (30 October), Kitco and Reuters (4 November), BLS and Yahoo Finance (10 November).
What Pushed Gold Lower From August to October
The World Gold Council names three likely causes for the October fall: markets repriced the Fed rate path, speculative traders cut their positions, and money rotated for a while from stocks and gold into bonds. It adds that much of the selling may have come through derivatives. The figures below show each of them.
Interest rates. On 16 September the Federal Reserve raised its target range to 3.75-4.00%. Gold pays no interest, so each hike makes holding it more expensive compared with bonds and deposits. On 28 October the Fed held, with two of 12 voters asking for another hike.
Real yields. The yield on 10-year inflation-protected Treasuries, the return a bond pays after inflation, rose from 2.42% on 28 August to 2.95% on 5 October, according to FRED. That is the period of the steepest fall in gold.
Speculative selling, the dollar and oil. Between 20 and 27 October speculative traders sold gold positions worth 8 billion USD, according to CFTC data reported by Investing.com. In the same week the dollar rose 0.6% and Brent crude 4.1%. Gold fell even though real yields dropped 11 basis points that week, so in late October selling pressure mattered more than yields. On 30 October a sell-off in tech stocks added forced selling, as investors sold metals to cover losses, according to ANZ analysts quoted by Yahoo Finance.
Buying by central banks and gold funds continued through the whole fall, and gold funds added 67 tonnes in September alone. RoboForex analyst Anna Rostova explains why it did not hold the price: central bank demand supports gold over years, while the price over days and weeks follows the dollar, bond yields, Fed expectations and speculative positions. Large sales by investors can outweigh central bank buying for a while, which is what happened in October.
What Could Push Gold Lower From Here
Fed hikes in December
If the Fed raises rates again on 8-9 December, as markets now price almost fully, then holding gold becomes more expensive again.
Real yields rise again
If the 10-year real yield climbs back toward its October high of 2.95%, then the driver that weighed most in September returns.
Oil lifts inflation
If the Iran war pushes oil up again, then inflation expectations rise and so do the odds of further hikes.
Follow Gold in RoboForex MobileTrader
Quotes, charts and orders in one app, on your phone or in Telegram.
Why Did Gold Go Up in Early November?
Gold went up in early November as the dollar fell after the US midterm elections. On 4 November gold gained 3%, its biggest daily rise since 19 August, as the dollar tumbled and the Democrats won both houses of Congress, Reuters reported. Hamad Hussain of Capital Economics linked the move to worries about the US fiscal outlook. On 9 November Brent crude fell 5.85% on hopes of a US-Iran deal, which cut the risk premium in oil, and gold traded back above 4,000 USD.
Anna Rostova sees three ways an election reaches gold: the dollar, fiscal policy and rate expectations. Worries about the budget deficit and government debt support gold, while a stronger dollar and higher Treasury yields can cancel that out.
What the October Inflation Data Changed
The October consumer price index, published on 10 November, rose 0.4% in the month against 0.3% expected, and the core measure, without food and energy, rose 0.3% against 0.2%. This time the BLS gives no 12-month figure, because it did not collect data for October 2025. After the release the CME FedWatch tool showed a December hike almost fully priced: about 85% for a quarter-point move and about 15% for a half-point move, up from 0% the day before, Yahoo Finance reported. Gold fell more than 2% on the day as the dollar and Treasury yields rose. Strong jobs data had already pointed the same way: non-farm payrolls rose by 165,000 in October against 65,000 expected. Our CPI explainer shows how traders read the index.
Who Is Buying Gold in 2026?
Central banks are the biggest steady buyers of gold in 2026. They bought 321 tonnes in the third quarter, 42% more than a year earlier and well above their five-year quarterly average of 227 tonnes, according to the World Gold Council. Since January they have bought 675 tonnes.
| Central bank | Q3 2026, tonnes |
|---|---|
| China (PBoC) | +63 |
| Poland | +40 |
| Kazakhstan | +14 |
| Uzbekistan | +14 |
| Czech Republic | +5 |
| Russia | -19 |
Only 120 tonnes of the 321 were reported officially, net of sellers such as Russia. The World Gold Council estimates the rest, about 63% of the total, from trade and market data, so the buyers behind most of the demand are not named. China reported its 24th monthly purchase in a row in October: its reserves rose by 830,000 ounces, about 25.8 tonnes, to 78.3 million ounces, about 2,435 tonnes, China Daily reported. That was its largest monthly purchase since September 2023 and brings its buying since January to about 129 tonnes.
Investors are the second group. Gold funds took in 31 billion USD in the third quarter, a record, and another 2.7 billion USD in October, which lifted their holdings to a record 4,275 tonnes, according to the World Gold Council. In October North American funds were the only ones with outflows, 512 million USD, while European and Asian funds kept buying.
Households are buying less. Jewellery demand fell 17% in the third quarter and bars and coins 19%, as high prices put buyers off.
Gold Reserves by Country: The Top 10
The United States holds the largest official gold reserve, 8,133.5 tonnes, more than Germany and Italy combined. The table lists the ten largest holders with the share of gold in each country's total reserves, from the World Gold Council's World Official Gold Holdings, November 2026 edition, based on IMF data.
| Rank | Country | Tonnes | Gold in total reserves |
|---|---|---|---|
| 1 | United States | 8,133.5 | 81.8% |
| 2 | Germany | 3,349.1 | 81.4% |
| 3 | Italy | 2,451.8 | 77.4% |
| 4 | France | 2,437.0 | 79.2% |
| 5 | China | 2,409.6 | n/a |
| 6 | Russia | 2,264.3 | 41.4% |
| 7 | Switzerland | 1,039.9 | 12.6% |
| 8 | India | 880.5 | 15.6% |
| 9 | Japan | 846.0 | 9.6% |
| 10 | Poland | 672.9 | 30.6% |
Holdings as of September 2026 for most countries; Italy and Switzerland as of August, France as of July. The source gives no share for China. China's own data show 2,435 tonnes at the end of October.
Two of the ten are also among the largest buyers this year. China has added gold for 24 months in a row, and Poland bought 40 tonnes in the third quarter alone. Russia is the only country in the top 10 that sold, 19 tonnes in the third quarter. The four largest holders keep around 80% of their reserves in gold, while for Japan, Switzerland and India gold is a small part of much larger currency reserves.
What Drives Gold Prices?
Gold prices are driven by interest rates, the US dollar, buying by central banks and investors, jewellery demand, supply, and events that raise or lower demand for safe assets. Each driver below shows how it works, what it reads now and where to check it.
Interest Rates and Real Yields
Gold pays no interest. When bonds pay more after inflation, investors give up more income by holding gold, so higher real yields usually weigh on the price. The 10-year real yield was 2.63% on 6 November, below its October high of 2.95% and above the 2.42% of late August. Check it daily on FRED, series DFII10, and check the Fed decision dates on the economic calendar. The next Fed meeting is on 8-9 December.
The US Dollar
Gold is priced in US dollars. A stronger dollar makes gold dearer for buyers who pay in other currencies, which cuts demand. The dollar index stood at 101.81 on 9 November, down 0.46% on the day. Our guide to the US Dollar Index explains how to read it.
Central Bank Buying
Central banks buy gold to hold reserves that do not depend on any one currency or government. They buy for years at a time, and most of them keep buying when the price falls. Russia, which sold 19 tonnes in the third quarter, was the only large seller. The World Gold Council publishes their purchases every quarter, and China reports its holdings early each month.
Gold Funds
Gold exchange-traded funds hold physical gold for their investors. Inflows mean investors are adding to gold, outflows mean they are leaving. The World Gold Council publishes the flows in the first week of each month.
Jewellery and Bars and Coins
Jewellery is the largest single use of gold. Households buy less when prices rise fast: in the third quarter of 2026 jewellery demand fell 17% and bars and coins 19%.
Mine Supply and Recycling
Mines produced a record 1,070.9 tonnes in the third quarter, 3% more than a year earlier, while recycling fell 8% to a three-year low. Supply changes slowly, so it rarely explains a monthly move.
Oil, Inflation and Geopolitics
Wars and crises usually lift demand for gold as a safe asset. In 2026 the Iran war worked the other way as well: it kept oil prices high, high oil kept inflation fears alive, and inflation fears raised the odds of Fed hikes. When oil fell on hopes of a deal on 9 November, gold rose.
Speculative Traders
Hedge funds and other traders trade gold futures with borrowed money and can sell quickly. The CFTC Commitments of Traders report shows their positions every Friday. Their selling of 8 billion USD in a single October week shows how fast this group can move the price.
How to Track Gold Drivers Yourself
You can follow every driver on this page with free data. The table lists where to look and what to compare.
| Driver | Where to check | How often | What to compare |
|---|---|---|---|
| Fed rate | Federal Reserve press releases, economic calendar | 8 meetings a year, next on 8-9 December | The decision against what markets priced before it |
| Real yield | FRED, series DFII10 | Daily | The direction over the last month |
| Inflation | BLS consumer price index, economic calendar | Monthly | The actual figure against the forecast |
| Dollar | US Dollar Index (DXY) | Daily | The direction over the last month |
| Central banks | World Gold Council, PBoC reserve data | Quarterly; China monthly | Purchases against the five-year average of 227 t a quarter |
| Gold funds | World Gold Council ETF flows | Monthly | Inflow or outflow, and which region |
| Speculative traders | CFTC Commitments of Traders | Weekly, on Fridays | Net position against the previous week |
- Open the economic calendar and mark the next CPI release and the Fed meeting on 8-9 December.
- After each release, compare the actual figure with the forecast. A hotter figure raises the odds of a hike, which weighs on gold.
- Watch how XAUUSD reacts on the chart below. For price levels and scenarios, read the Long XAUUSD forecast, and for trading methods, our guide to gold trading.
Conclusion
Gold stays expensive in November 2026 because central banks bought 321 tonnes in the third quarter and gold funds hold a record 4,275 tonnes, while the Fed's 3.75-4.00% rate and a December hike that markets price almost fully set the limit on how far it can recover. The next readings to watch are the Fed decision on 8-9 December and the 10-year real yield, which stood at 2.63% on 6 November.
FAQ
Why is gold so expensive?
Central banks bought 321 tonnes of gold in the third quarter of 2026, 42% more than a year earlier, and gold funds hold a record 4,275 tonnes. Even after falling about 25% from its January record, gold averaged 4,262 USD an ounce in the third quarter, 23% more than a year earlier.
Why is gold going down?
From August to October gold fell because the Fed raised rates in September and markets expect another hike, the 10-year real yield rose to 2.95% and speculative traders sold. Heraeus puts the fall at more than 15% from the late-August high.
Who is buying the most gold?
Central banks are the biggest steady buyers. In the third quarter of 2026 China reported 63 tonnes, Poland 40 tonnes, and Kazakhstan and Uzbekistan 14 tonnes each, according to the World Gold Council. About 63% of central bank buying is not reported officially.
Which country has the most gold reserves?
The United States, with 8,133.5 tonnes, followed by Germany with 3,349.1 tonnes and Italy with 2,451.8 tonnes, according to World Gold Council data based on the IMF, mostly as of September 2026. China, fifth, reported 2,435 tonnes at the end of October.
How do interest rates affect gold?
Gold pays no interest, so when rates and real yields rise, holding gold costs more in lost income. The Fed raised rates to 3.75-4.00% in September, and the 10-year real yield rose from 2.42% to 2.95% by early October while gold fell.
What would make gold go back up?
Lower odds of a December Fed hike, a falling real yield, a weaker dollar and continued buying by central banks and gold funds would all support the price. This page tracks each of them monthly. Price levels are in the Long XAUUSD forecast.
- Gold Trading Explained: 3 XAU/USD Strategies, Best Trading Hours and Risk Rules: how to trade gold once you know what moves it.
- US Dollar Index (DXY): What It Is and How to Use It: the dollar driver in detail.
- CPI in Forex Trading: What It Is and How It Moves Prices: how inflation data reaches the Fed and gold.
- What Is an Economic Calendar and Why Every Trader Should Use It: how to follow the dates that move gold.
Any information provided in articles on this website is based solely on the personal opinions of the authors. These articles should not be construed as trading recommendations or a call to action. The authors and RoboForex accept no responsibility for the results of any trades made on the basis of these recommendations and reviews. Past performance is not indicative of future results. Trading stocks and CFDs involves a high risk of capital loss.