How to Use the US Dollar Index (DXY) in Forex Trading
The US Dollar Index (DXY) measures the value of the US dollar against a basket of six currencies: the euro, the yen, the pound, the Canadian dollar, the Swedish krona and the Swiss franc. In forex it works as a gauge of the dollar trend. When DXY rises, pairs such as USD/JPY usually rise and pairs such as EUR/USD usually fall.
TL;DR
- Check the trend on the DXY chart before you trade any pair with the US dollar in it.
- Buy the dollar against other currencies while DXY trends up, and sell it while DXY trends down.
- Confirm a DXY pattern on a pair that follows the index, such as USD/JPY, or moves against it, such as EUR/USD.
In this article, you’ll be introduced to the US Dollar index, which shows dynamic patterns of the American currency and helps to find additional signals for Forex trading.
What Is the US Dollar Index?
The US Dollar index (DXY or USDX) is an aggregated indicator of the leading global currency cost relative to a basket of other foreign currencies. Technically, the index can be compared with stock indices, such as Dow Jones or S&P 500. Stock indices track the stock market, while DXY shows the USD rate relative to other currencies and its current calculated value.
The US Dollar index started trading in 1973, soon after the dismantling of the Bretton Woods system. Its base value was 100.00. For example, if the index grows up to 110.00, it means that the value of the dollar increased by 10% relative to its base value. Starting from 1973, the index’s high was 160.00, while the year 2008 showed an all-time low at 70.00.
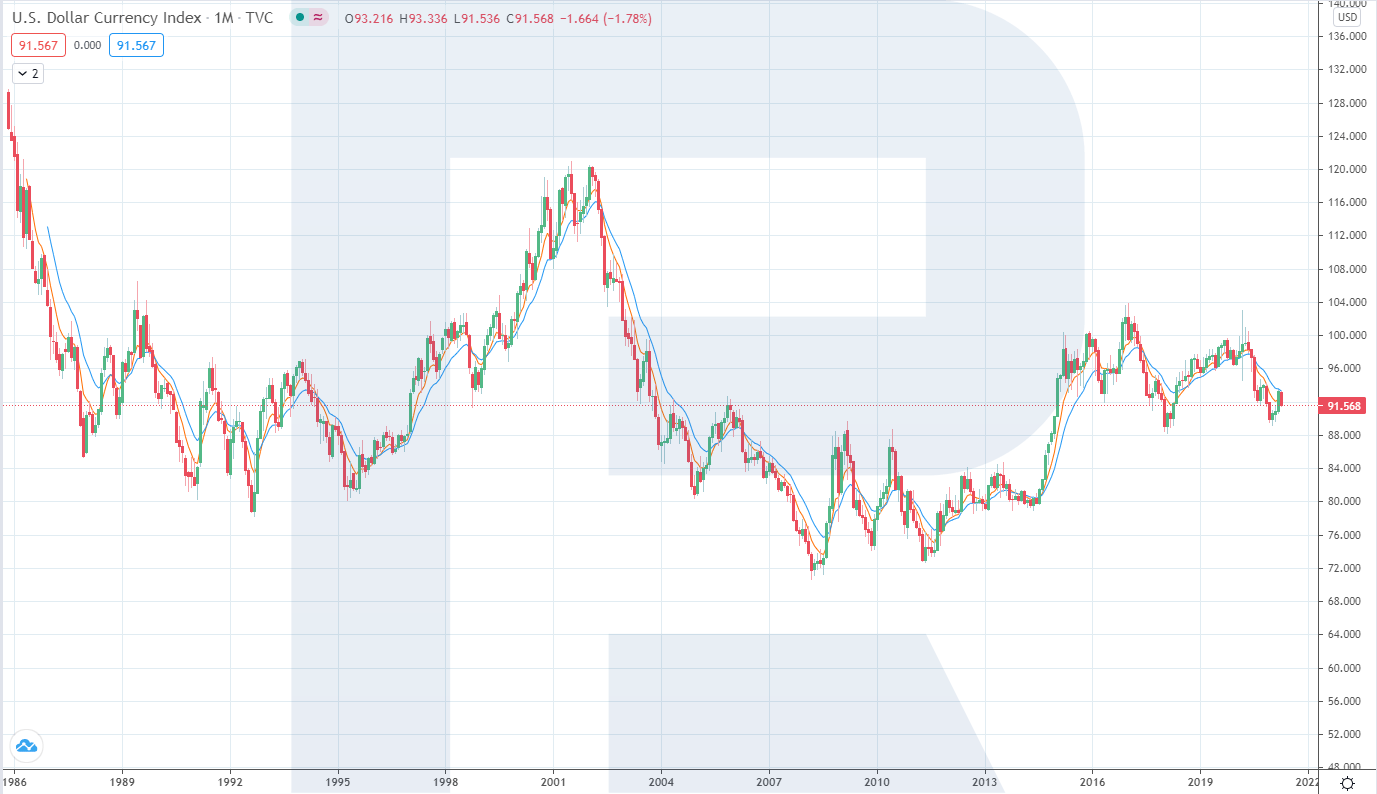
Apart from the major US Dollar index, there are other indices: the Bloomberg dollar index, the Wall Street Journal dollar index, etc. All of them are highly correlated to each other and measure the same thing (the US dollar value) but their calculation formulae are quite different, that’s why they show pretty close but not always the same results.
In this article, we’ll talk about the major and classic US Dollar index (DXY). However, the basic idea of any other US Dollar index will be pretty similar.
Trade on the Go With RoboForex MobileTrader
A portable trading workstation on your phone, on Android and iOS.
What Does the US Dollar Index Consist Of?
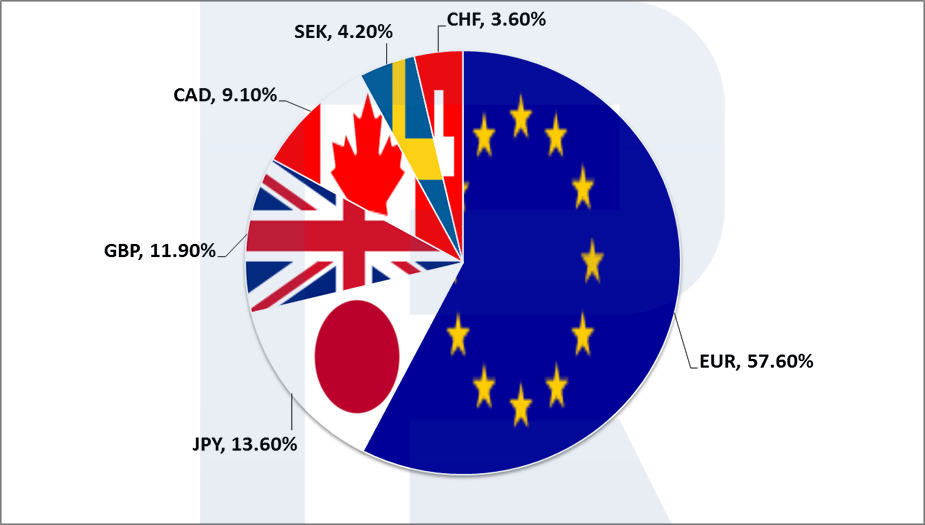
The US Dollar index value is calculated as an average weighted geometric mean of the USD exchange rate relative to a basket of six foreign currencies. Each of these currencies belongs to a country, which is a key trade and economic partner of the USA. These currencies are used for calculating the US Dollar index with a different weight percentage:
- Euro (EUR): 57.6%
- Japanese Yen (JPY): 13.6%
- Great Britain Pound (GBP): 11.9%
- Canadian Dollar (CAD): 9.1%
- Swedish Krona (SEK): 4.2%
- Swiss Franc (CHF): 3.6%
The US Dollar index rises when the USD rises relative to a basket of the above-mentioned currencies and vice versa. As one can see from the index structure, the Euro and other European currencies have the upper hand here.
Some analysts and economic experts believe that the basket for calculating DXY should be revised and added with other global currencies. It should help to reflect the fact that the USA is currently actively trading with such countries as China, South Korea, Mexico, Brazil, and Australia.
The table shows how much each currency moves the US Dollar Index. A currency with a larger weight moves DXY more.
| Currency | Weight in DXY | Effect on the index |
|---|---|---|
| Euro (EUR) | 57.6% | The main driver: EUR/USD and DXY almost mirror each other |
| Japanese yen (JPY) | 13.6% | Noticeable, especially when the Bank of Japan surprises |
| British pound (GBP) | 11.9% | Noticeable on UK data and Bank of England decisions |
| Canadian dollar (CAD) | 9.1% | Moderate, often moves with oil prices |
| Swedish krona (SEK) | 4.2% | Small |
| Swiss franc (CHF) | 3.6% | Small |
How to Use the US Dollar Index in Forex Trading?
The US Dollar index is traded on exchanges in the form of non-deliverable contracts, futures and options, but it can also be used for trading on Forex because the USD is a part of major currency pairs. The DXY chart can be found on different analytical resources, for example, tradingview.com. Let’s consider three ways of using the US Dollar index of Forex trading:
The US Dollar Trend Indicator
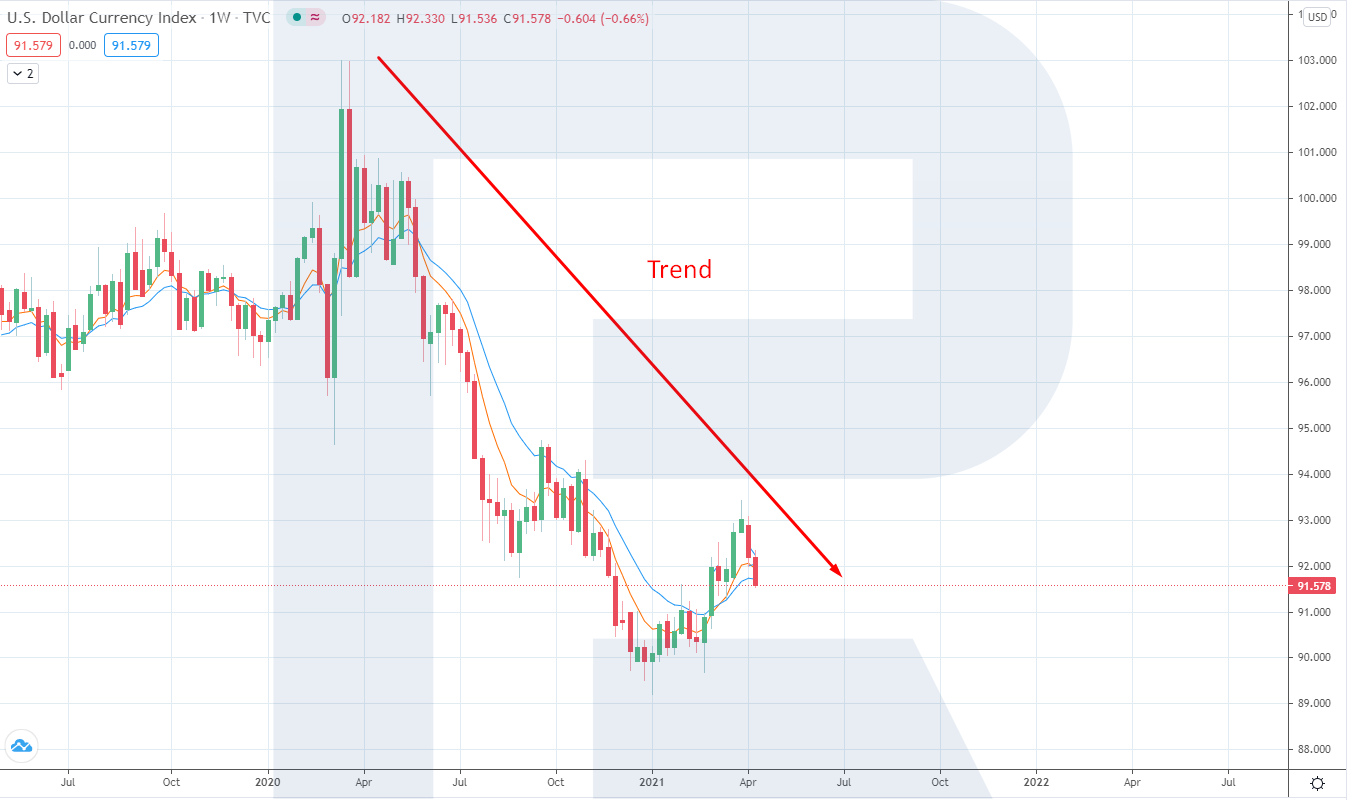
The US Dollar index is the key indicator that one should pay attention to when trying to define the current dollar tendency. As one can learn from the technical analysis course, “trend is our friend” and it is better to open orders in the direction of an active tendency. So, it is necessary to open the US Dollar index chart and define the current trend direction. Trading recommendations are as follows:
- If DXY shows a stable uptrend, one should look for opportunities to buy the USD against other currencies and vice versa.
- If DXY is moving within the downtrend, one should look for opportunities to sell the USD against other currencies.
Start Trading Now
Forex, stocks, indices and gold on MetaTrader 4 and MetaTrader 5, from a free demo account to a live one.
Trading Correlated Currency Pairs
The US Dollar index chart can be used for assessing the current USD trend and for finding additional trading signals. Since many traders and investors both keep track of the US Dollar index and trade it (using futures and options), support and resistance levels, as well as price patterns on the US Dollar index chart, have also a significant influence on the currency market.
Correlated currency pairs are the pairs that move in the same direction as the US Dollar index. In such pairs, USD is the first currency:
- USD/CHF: US Dollar / Swiss Franc.
- USD/JPY: US Dollar / Japanese Yen.
- USD/CAD: US Dollar / Canadian Dollar.
Trading recommendations:
- Find a completely formed technical analysis pattern on the DXY chart.
- Choose a correlated currency pair with a similar technical picture.
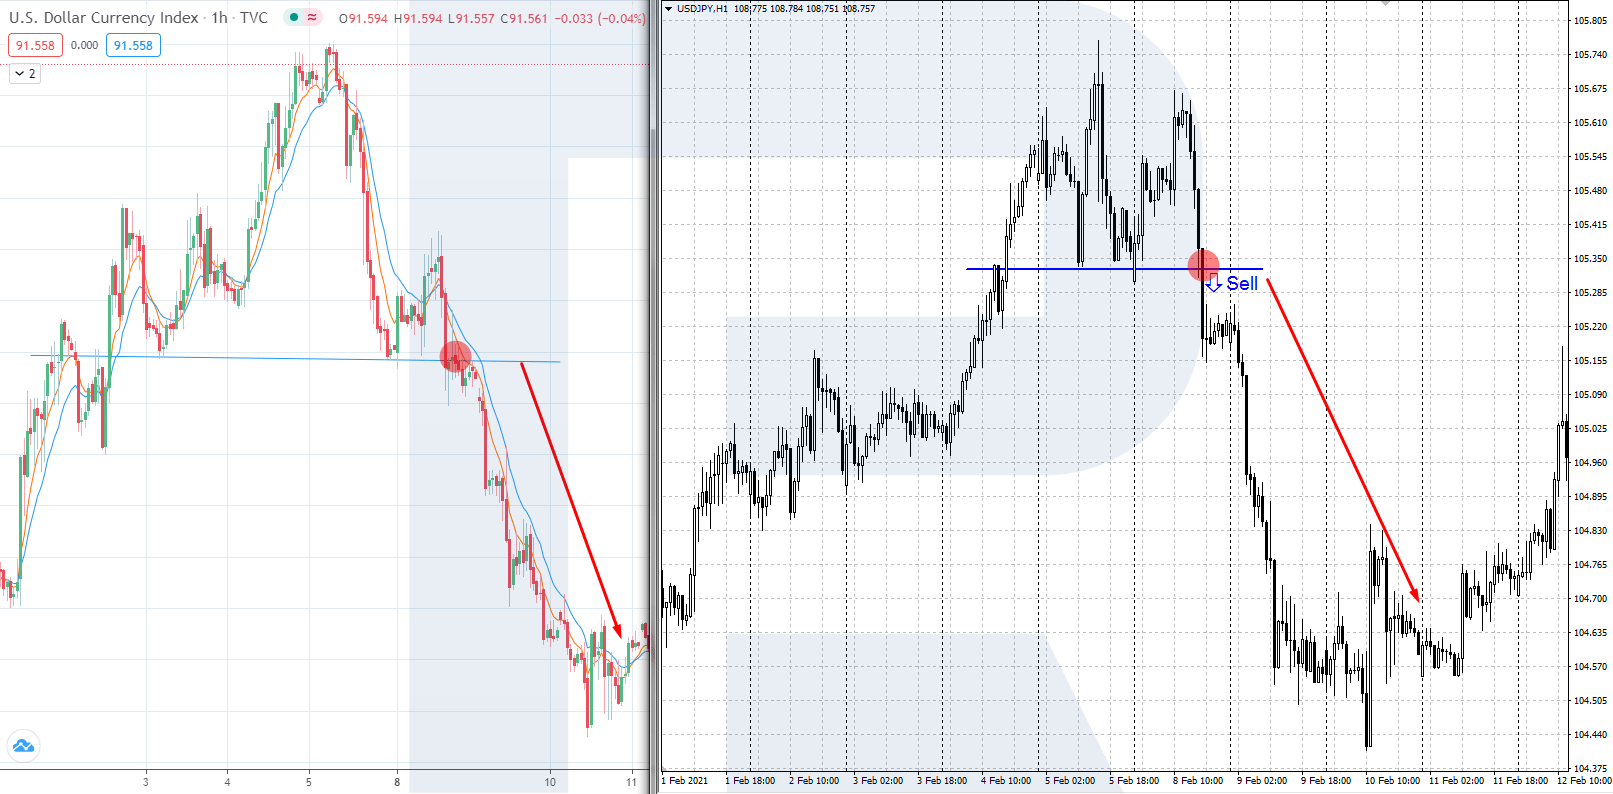
- For pattern materialization, open a position in a correlated currency pair in the direction of the index.
Example:
- In the H1 chart of DXY, there is a formed pattern for selling, Head & Shoulders.
- In the H1 chart of a correlated currency pair, USD/JPY, there is a similar pattern for selling, Triple Top.
- After the index breaks the Head & Shoulders pattern to the downside, open a short position in USD/JPY.
- Place Stop Loss and Take Profit according to the rules of trading technical analysis patterns.
Trading Currency Pairs with an Inverse Correlation
Currency pairs with an inverse correlation are the pairs that move in the direction opposite to the US Dollar index. In such pairs, USD is the second currency:
- EUR/USD: Euro / US Dollar.
- GBP/USD: Pound / US Dollar.
- AUD/USD: Australian Dollar / US Dollar.
- NZD/USD: New Zealand Dollar / US Dollar.
Trading recommendations:
- Find a completely formed technical analysis pattern on the DXY chart.
- Choose a currency pair with an inverse correlation with a similar technical picture.
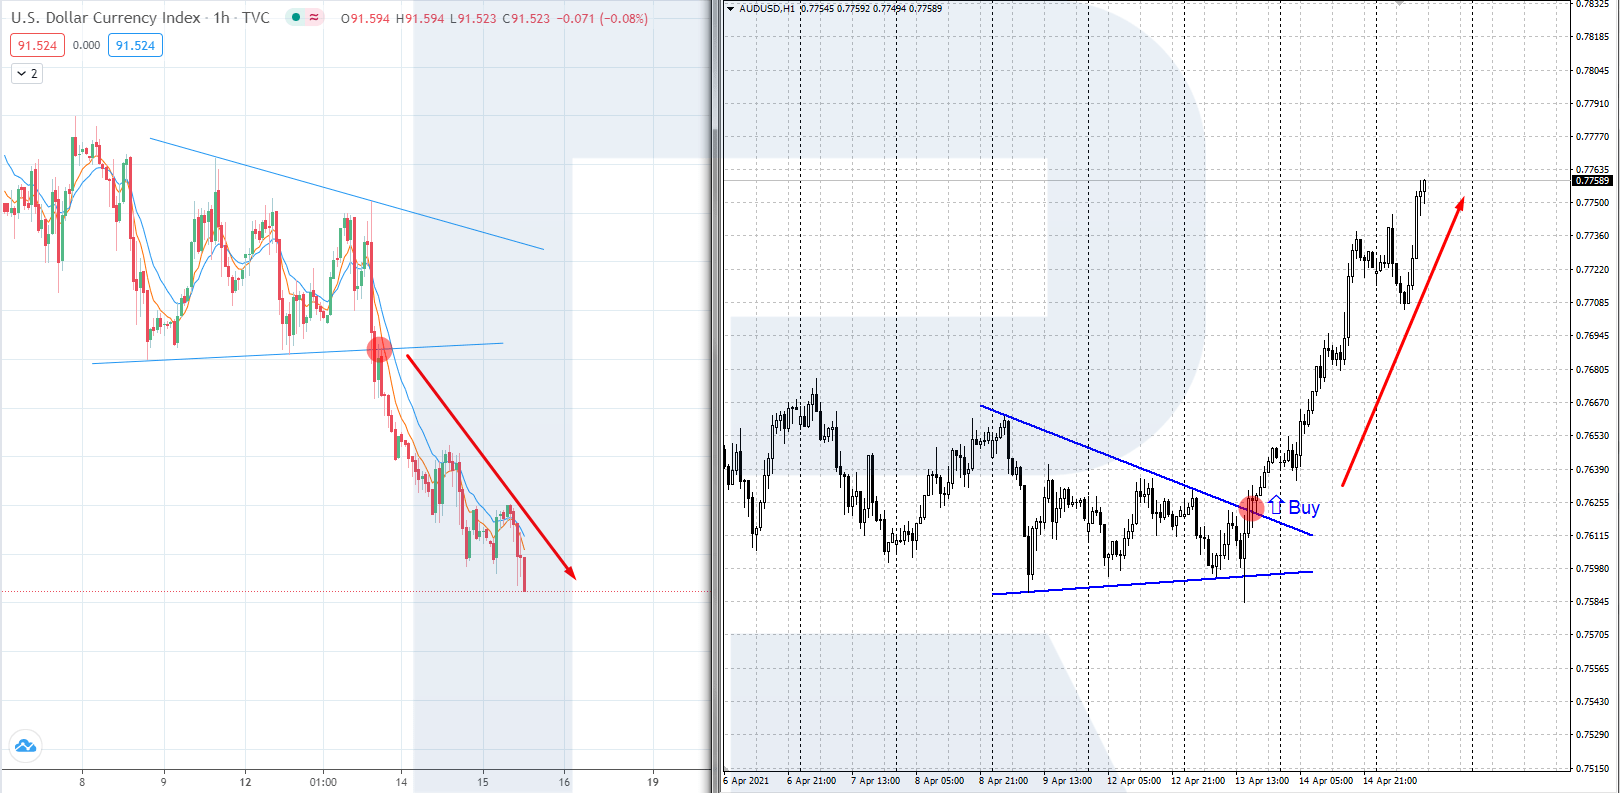
- For a pattern materialization, open a position in a currency pair with inverse correlation in the direction opposite to the index.
Example:
- In the H1 chart of DXY, there is a formed pattern, Triangle.
- In the H1 chart of a currency pair with an inverse correlation, AUD/USD, there is a similar price pattern.
- After the index breaks the Triangle pattern to the downside, open a long position (in the direction opposite to the index) in AUD/USD.
- Place Stop Loss and Take Profit according to the rules of trading technical analysis patterns.
DXY Correlation Table
The US Dollar Index moves with some markets and against others. The table shows the usual direction of each link and how steady it is. These are tendencies, not fixed rules: correlations change, and they break down for days at a time around major news.
| Instrument | Usual link with DXY | Why | How steady |
|---|---|---|---|
| EUR/USD | Moves opposite to DXY | The euro is 57.6% of the index, and the dollar is the second currency in the pair | Very steady |
| GBP/USD, AUD/USD, NZD/USD | Moves opposite to DXY | The dollar is the second currency in the pair | Steady |
| USD/JPY, USD/CHF, USD/CAD | Moves with DXY | The dollar is the first currency in the pair | Usually steady, weaker for USD/CAD when oil moves sharply |
| XAU/USD | Usually moves opposite to DXY | Gold is priced in US dollars, so a stronger dollar makes it more expensive for other buyers | Often, not always: in periods of fear both can rise together |
| US 500 | No stable link | A stronger dollar can weigh on US exporters, but both can rise when the US economy leads | Changes from year to year |
Before you trade a dollar pair on a DXY signal, check that the pair has followed the index over the last few weeks. For the current outlook on the index itself, see the latest DXY forecast. You can also compare the index with the pairs on a DXY chart side by side, as in the examples above.
Closing Thoughts
The US Dollar index is a very important macroeconomic indicator that reflects the current dynamics of the American currency relative to its base value of 100.00. The index movement is closely watched by many traders, analysts, and economic experts. DXY can be used for defining the current tendency in the US Dollar and finding trading signals on Forex. For trading, one can use significant support and resistance levels, price patterns, Price Action patterns.
FAQ
What is DXY in forex?
DXY, the US Dollar Index, shows the value of the dollar against six major currencies, with the euro making up 57.6% of it. Forex traders use it to read the dollar trend, because most major pairs contain the dollar and follow the index up or down.
What currencies are in the US Dollar Index?
Six: the euro 57.6%, the Japanese yen 13.6%, the British pound 11.9%, the Canadian dollar 9.1%, the Swedish krona 4.2% and the Swiss franc 3.6%. The weights have stayed the same since the euro replaced the European currencies it absorbed in 1999.
How does DXY affect EUR/USD?
They move almost as mirror images. The euro makes up more than half of the index, so when DXY rises, EUR/USD usually falls, and when DXY falls, EUR/USD usually rises.
Does DXY affect gold?
Usually yes. Gold is priced in US dollars, so a stronger dollar tends to push XAU/USD down and a weaker one tends to lift it. The link weakens when markets are fearful and both the dollar and gold are bought as safe havens.
How do you use the dollar index in trading?
Read the dollar trend on the DXY chart, then look for trades in the same direction on pairs that follow the index. Patterns and levels on DXY can confirm the same setups on USD/JPY, USD/CHF or USD/CAD, and the opposite setups on EUR/USD, GBP/USD or AUD/USD.
Any information provided in articles on this website is based solely on the personal opinions of the authors. These articles should not be construed as trading recommendations or a call to action. The authors and RoboForex accept no responsibility for the results of any trades made on the basis of these recommendations and reviews. Past performance is not indicative of future results. Trading stocks and CFDs involves a high risk of capital loss.