Divergence and Convergence in Trading: How to Use Signals
Divergence and convergence in trading are mismatches between the price and an oscillator such as the MACD. In a divergence, the price makes a higher high while the indicator makes a lower high, a sign that buyers are weakening. In a convergence, also called a bullish divergence, the price makes a lower low while the indicator makes a higher low, a sign that sellers are weakening.
TL;DR
- Compare the last two highs or lows of the price with the same points on the MACD or the RSI.
- Trade the signal in the direction of the main trend, for example a divergence at the top of an upward correction in a downtrend.
- Enter after the price turns, place the stop loss behind the last extreme and take profit at the next strong level.
This article is devoted to such terms as divergence and convergence as well as their use in trading.
What Is Divergence
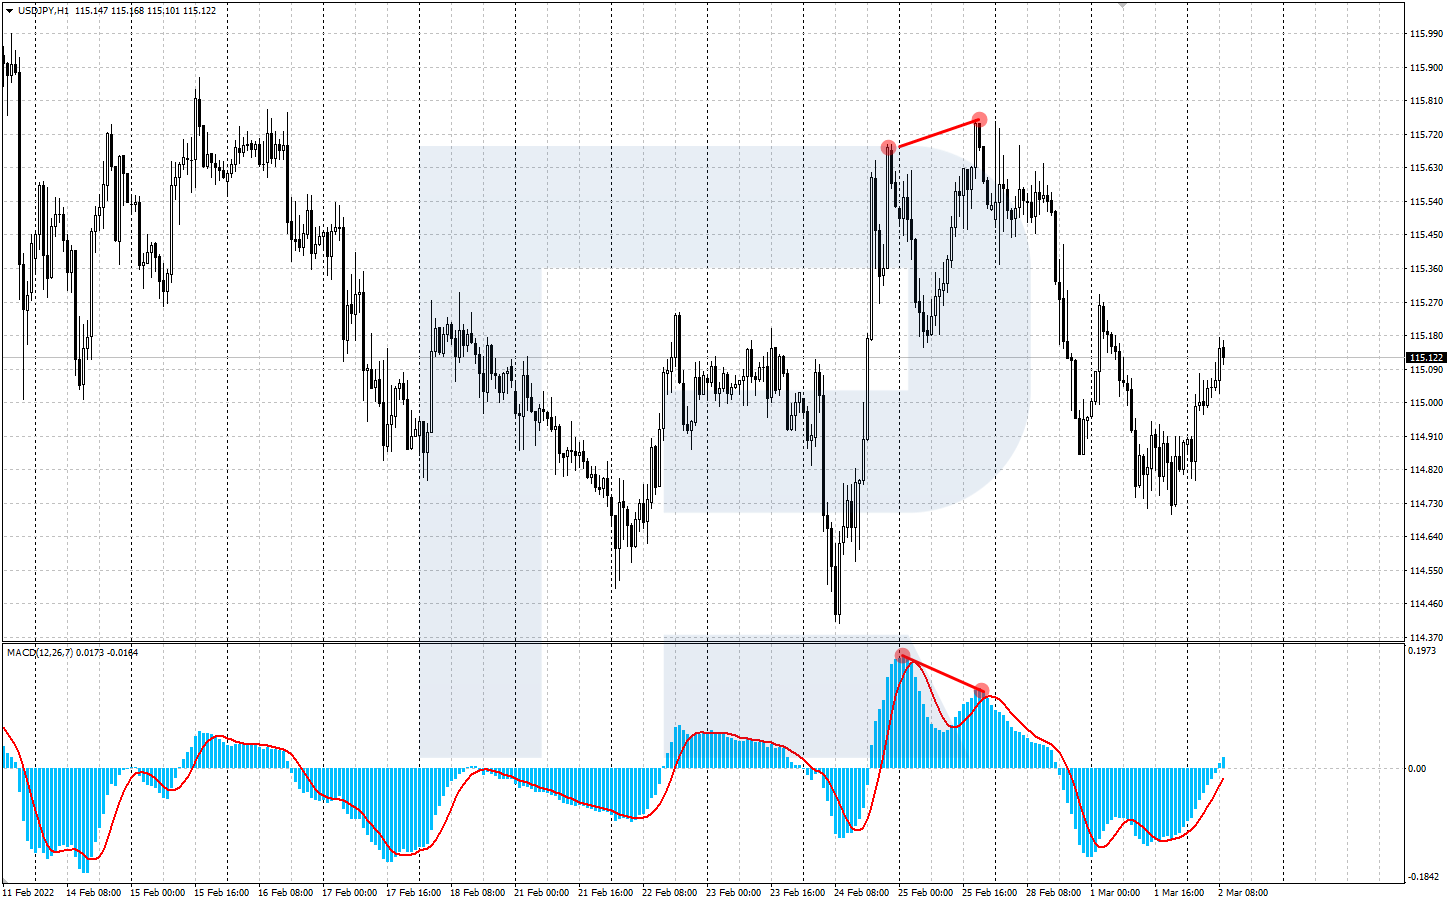
Divergence is the instance when the price chart diverges with the used trading indicator. This looks as follows: in an ascending movement the price chart forms a new high that is higher than the previous one while the indicator shows a high that is no higher than the previous one. This inequality might mean that the bulls are losing power, so next thing a descending correction or even a reversal follows.
A classic divergence consists of two highs of the price chart and two corresponding highs of the trading indicator. One of the most popular indicators for catching divergences is the MACD (Moving Average Convergence/Divergence).
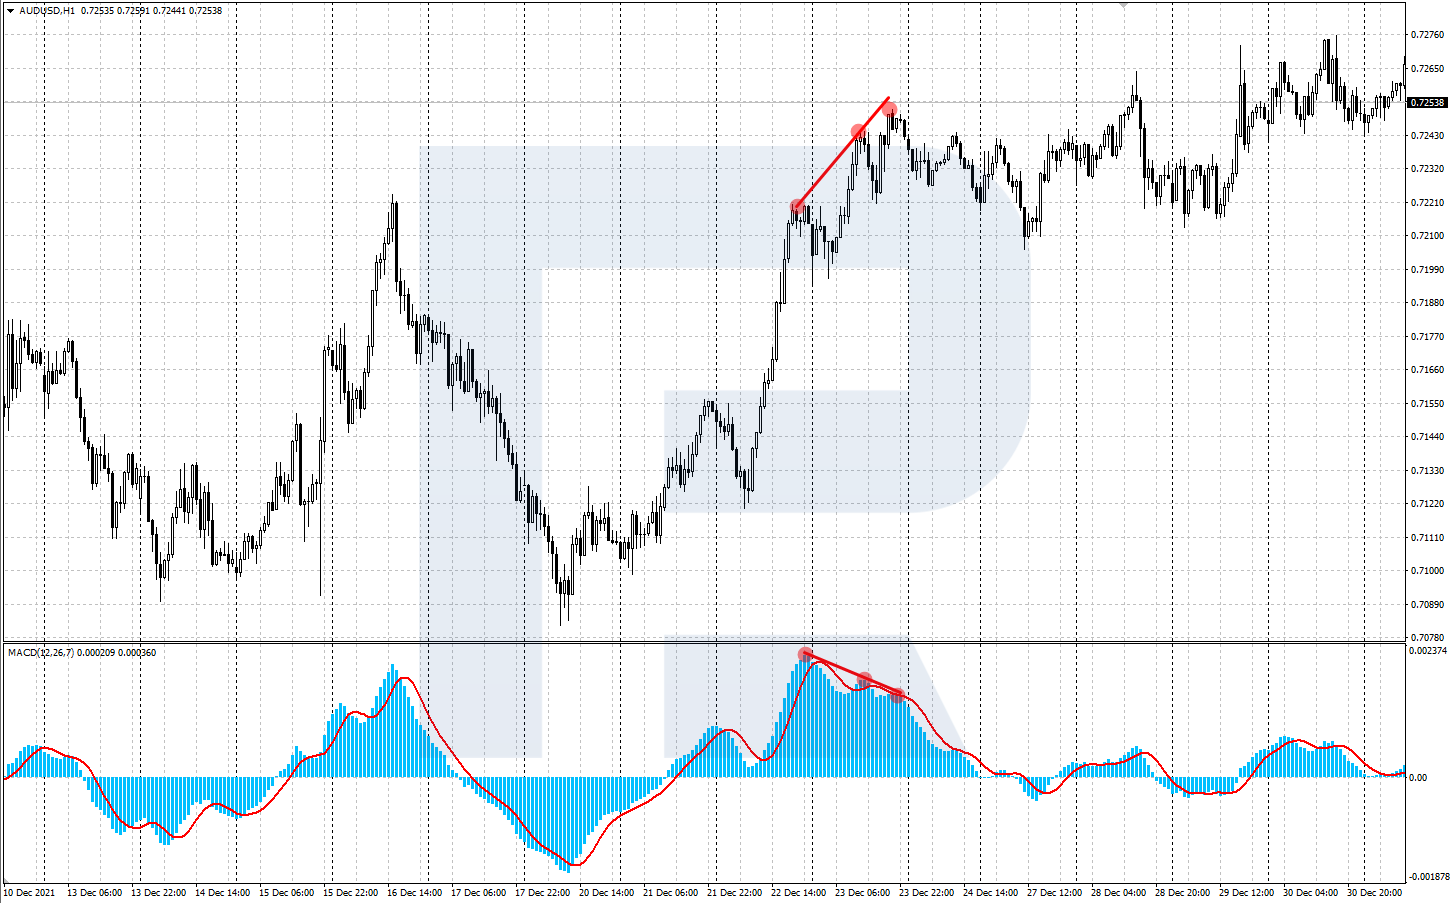
A divergence may not limit itself by two highs if there is quite a strong ascending movement in the market. Before a descending correction or reversal follows, a triple divergence might form. This means the price chart shows three highs, each one higher than the previous one, while the indicator demonstrates three highs, each one lower than the previous one.
Trade on the Go With RoboForex MobileTrader
A portable trading workstation on your phone, on Android and iOS.
What Is a Convergence
Convergence is when the price chart and the indicator chart converge. This looks as follows: in a descending movement, the price chart shows a new low, which is lower than the previous one, while the indicator demonstrates a low higher than the previous one. The indicator does not confirm the decline which means the bears have become weaker, so next step, an ascending correction or reversal can follow.
A classic convergence consists of two lows of the price chart and two corresponding lows of the indicator chart. This situation mirrors the divergence. The term “divergence” is more popular, so traders tend to call convergence a “bullish divergence”. To detect convergences, the MACD also suits well.
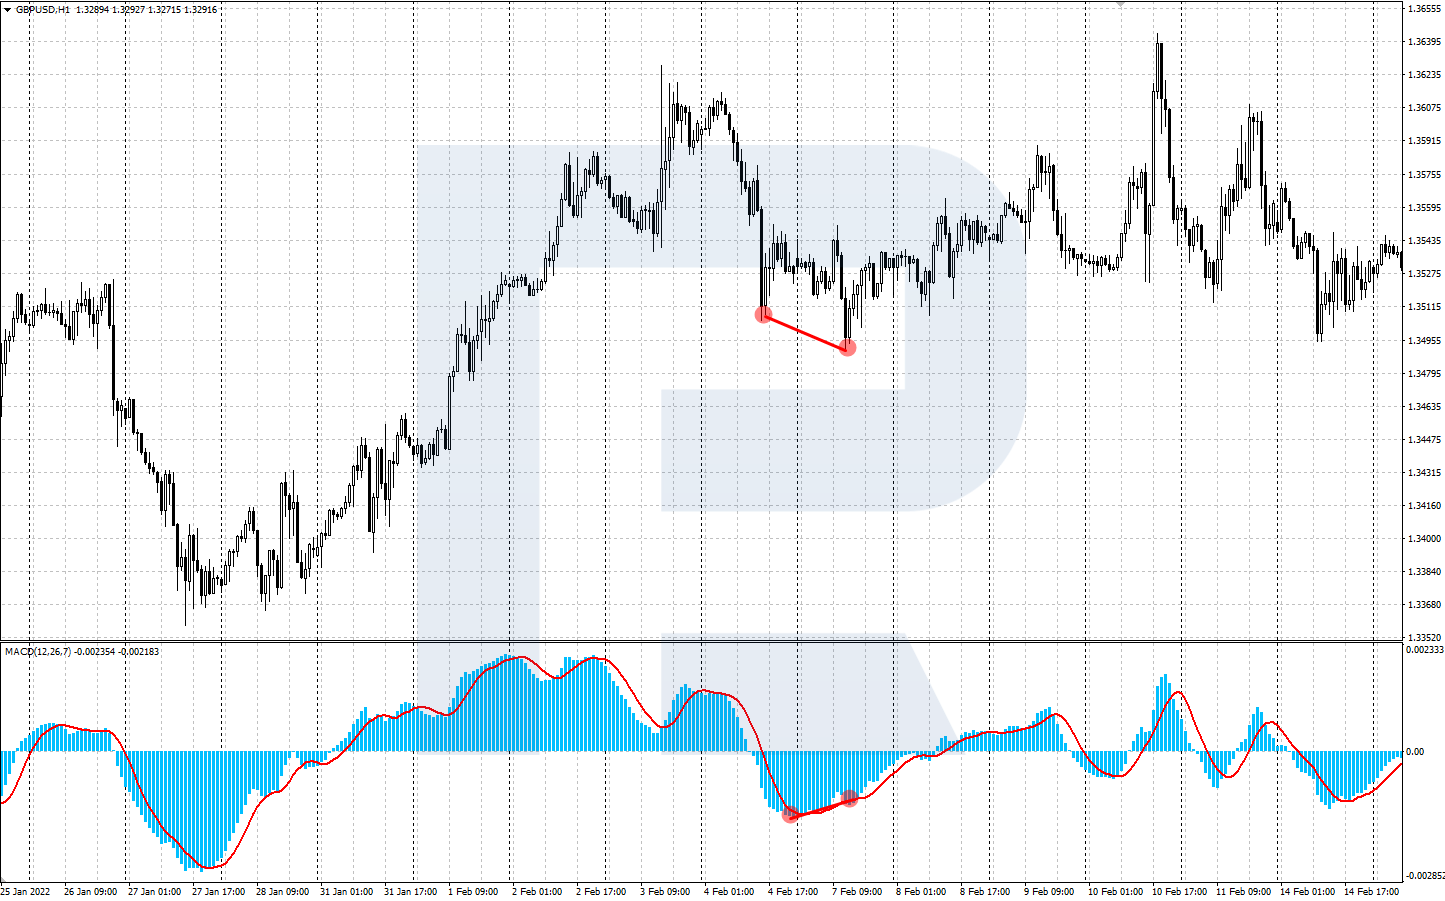
A convergence can also not limit itself by two lows, if there is a stable downtrend in the market. Before a correction or a reversal starts, a triple convergence may form: on the price chart, there will be three subsequently lowering lows, and on the indicator chart, three corresponding lows will be growing.
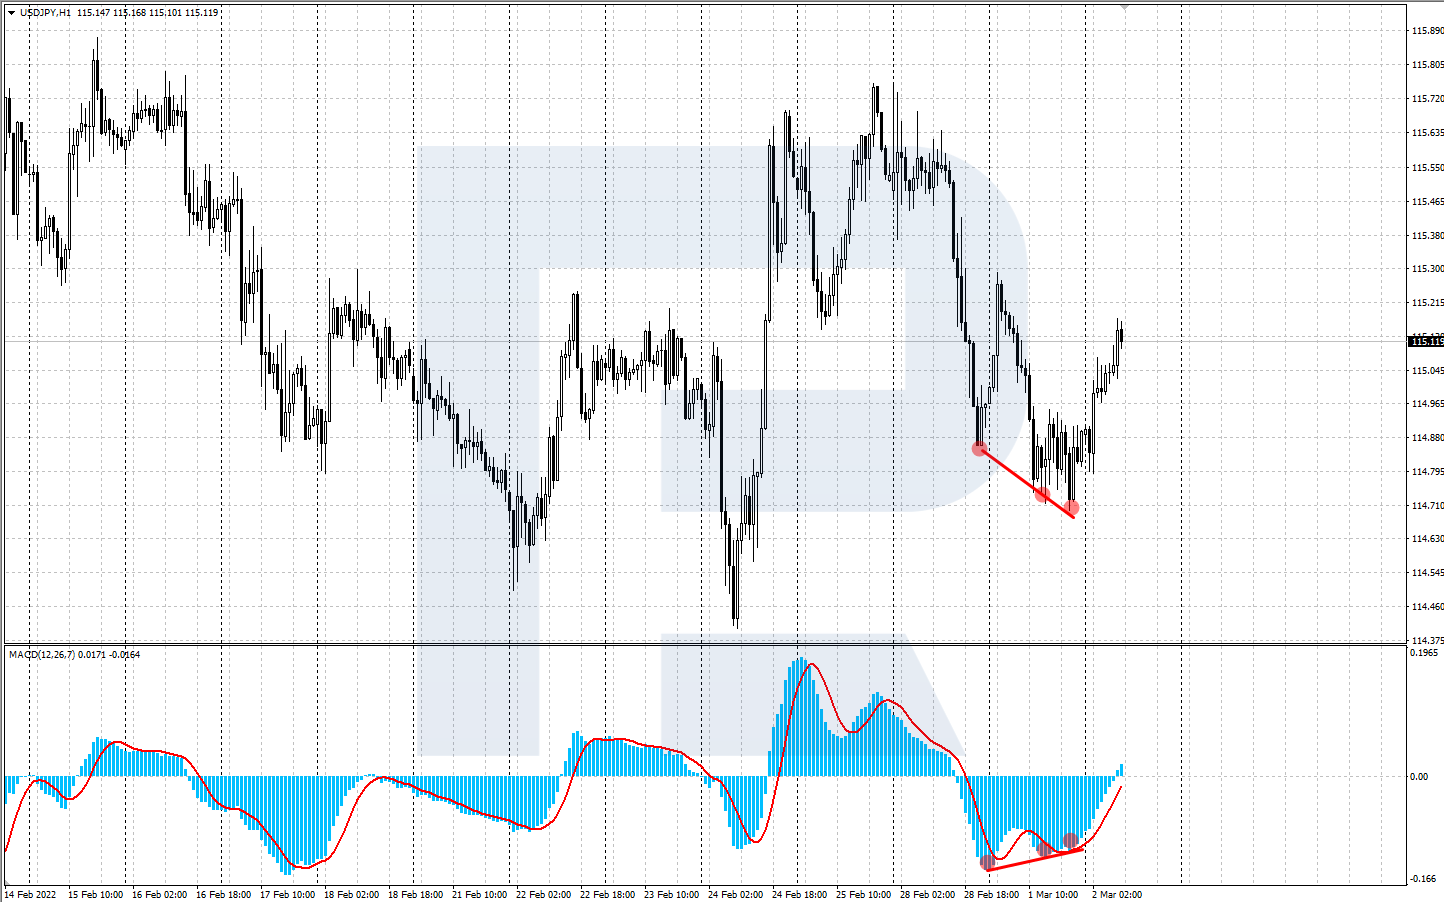
Divergence vs Convergence in Trading
A divergence or a convergence on the chart is considered a useful trading signal. Many traders fish for them to open or close their positions.
If you're asking how to determine convergence and divergence, various indicators can be used, the most popular of them being the MACD, RSI, and Stochastic. Convergences/divergences can be traded on any highly liquid assets, on timeframes from H1 and higher.
The table lists every type of divergence covered in this article, including the hidden divergence explained further down.
| Type | On the price chart | On the indicator | Signal | Reliability |
|---|---|---|---|---|
| Divergence (regular bearish divergence) | A higher high | A lower high | Buyers are weakening, a fall or a correction may follow | Higher on H1 and above, strongest after a long rise |
| Convergence (regular bullish divergence) | A lower low | A higher low | Sellers are weakening, a rise or a correction may follow | Higher on H1 and above, strongest after a long fall |
| Triple divergence | Three rising highs | Three falling highs | The uptrend is running out of strength | Higher than a two-high divergence |
| Triple convergence | Three falling lows | Three rising lows | The downtrend is running out of strength | Higher than a two-low convergence |
| Hidden bearish divergence | A lower high | A higher high | The downtrend is likely to continue | Works best in a clear downtrend |
| Hidden bullish divergence | A higher low | A lower low | The uptrend is likely to continue | Works best in a clear uptrend |
How to Sell with Divergences
When a divergence appears, it gives a signal to sell: the quotes set a new local high but the indicator does not confirm it. However, quite often signals from divergences go against the current trend, giving a good reason for closing profitable positions because a reversal becomes too possible.
As for opening new positions against the trend, here one needs to be extremely careful. Beginners should rather abstain from this. To open new positions, divergences during corrections are better. If there is a correction of a downtrend, and a divergence appears in the meantime, this is a good signal to sell. Positions should be open by the current trend.
Example of Selling by a Divergence
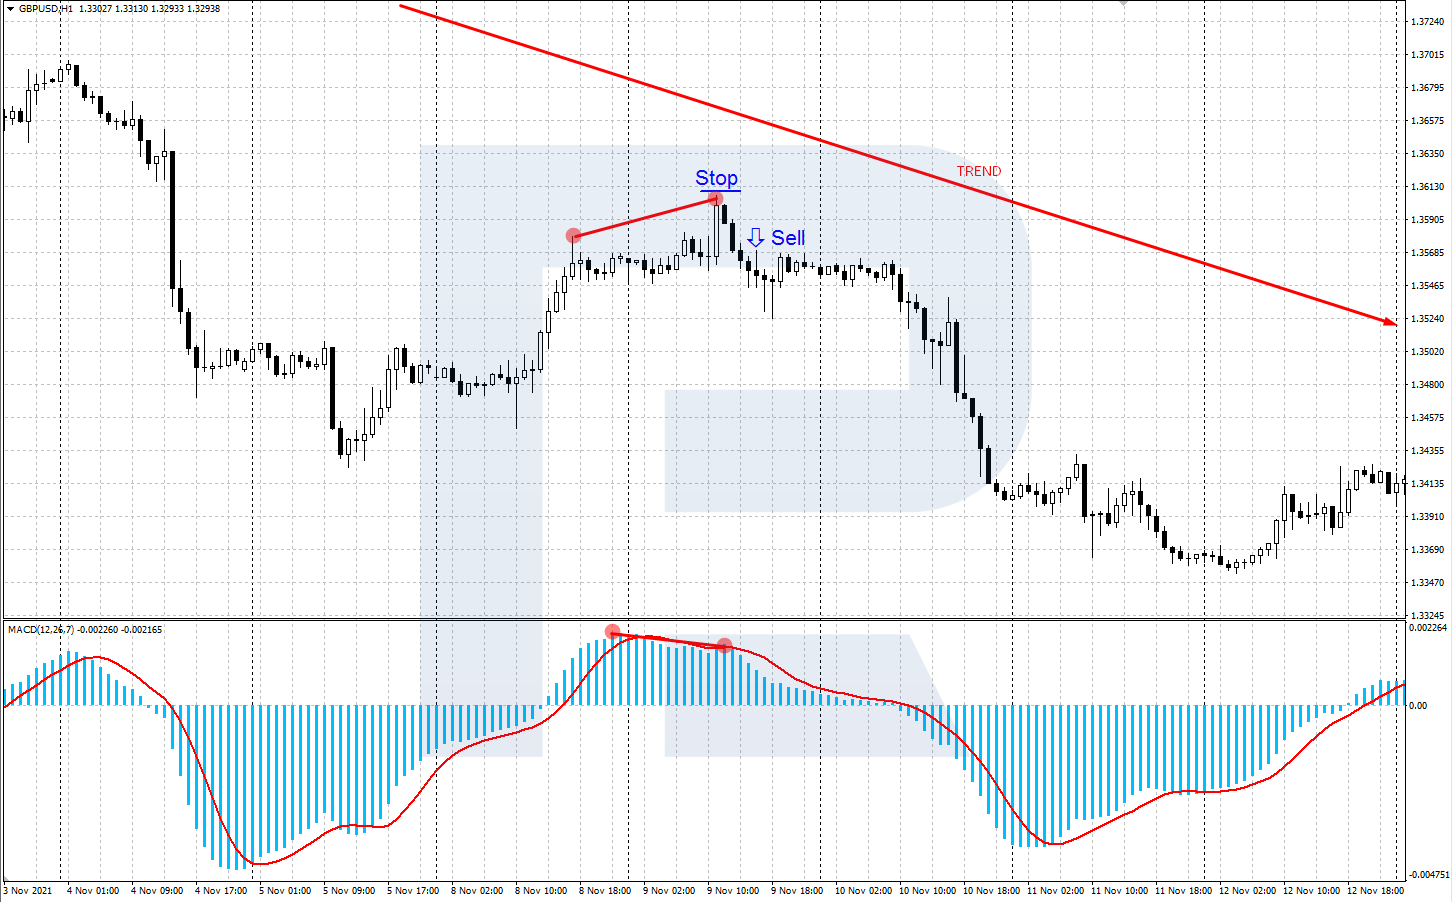
- On H1 of GBP/USD in an ascending correction the MACD signaled about a divergence.
- After a local high formed and the price reversed downwards, a selling position by the trend can be opened.
- Stop Loss is to be placed behind the last high, and Profit can be taken as soon as a strong support level is reached.
Start Trading Now
Forex, stocks, indices and gold on MetaTrader 4 and MetaTrader 5, from a free demo account to a live one.
How to Buy by a Convergence
After a convergence forms, a signal to buy emerges: the price sets a new local low but the indicator does not. As a rule, convergences give signals against the current trend, giving a good reason to close sales because a reversal is highly probable. As with divergences, trading against the trend is a bad idea for beginners.
To open a buying position, a convergence in a descending correction is necessary. If there is a correction in an uptrend, and a convergence forms, this is a good signal to buy. The correction might be coming to an end, so the quotes will start growing soon.
Example of Buying by a Convergence
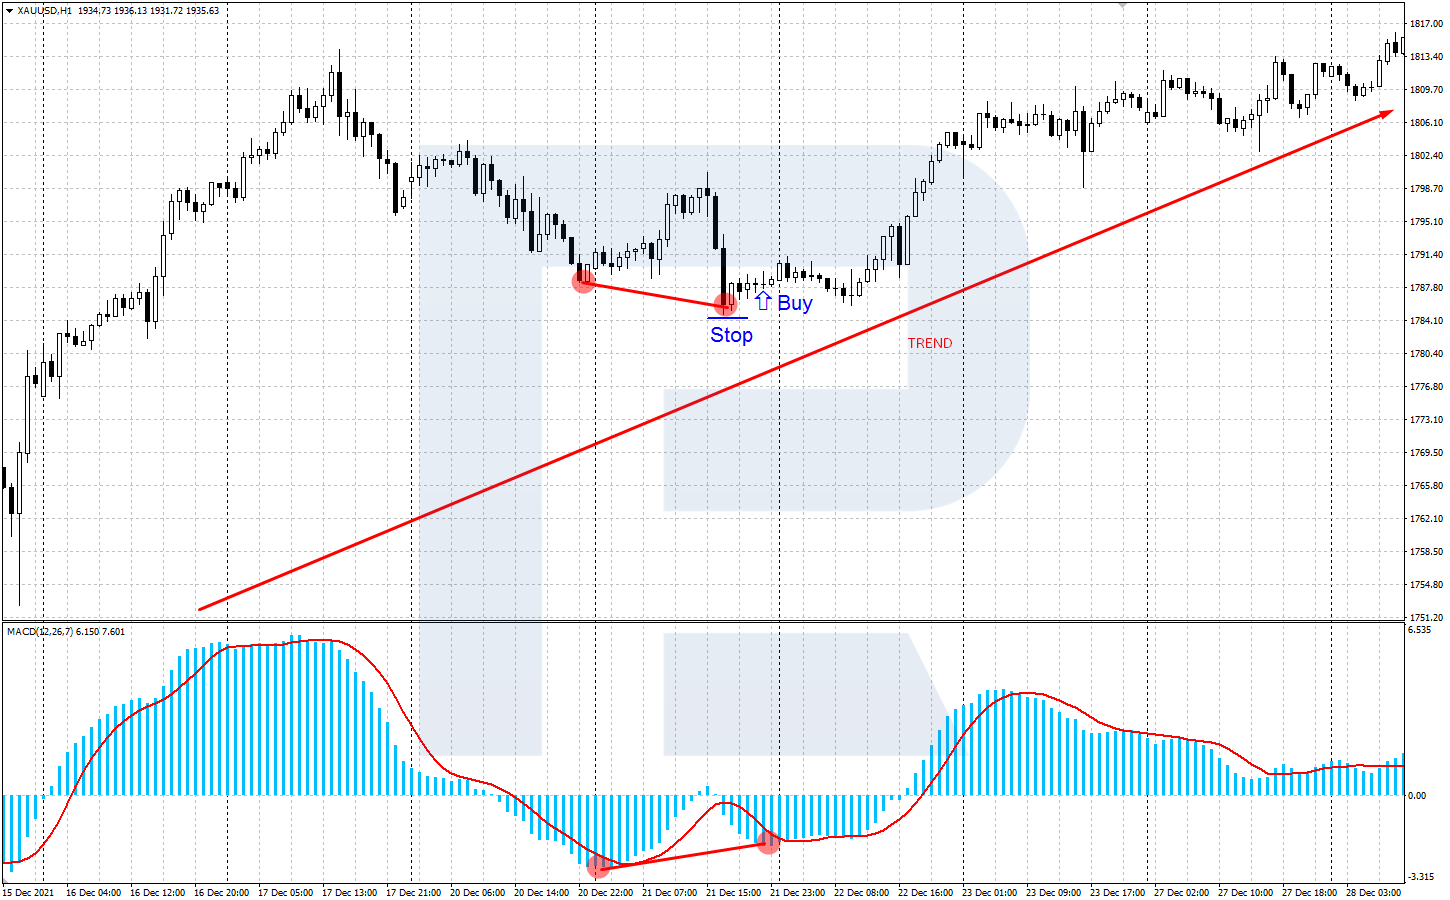
- On H1 of XAU/USD in a descending correction the MACD signals about a convergence.
- After a local low forms and the quotes reverse upwards, a buying position by the main trend can be opened.
- Stop Loss is placed behind the last low, Profit can be taken when a strong resistance level is reached.
Hidden Divergence
The divergences above are regular: they warn that a trend may be ending. A hidden divergence says the opposite. It appears during a correction inside a trend and points to the trend continuing.
In an uptrend, a hidden bullish divergence forms when the price makes a higher low during a pullback while the indicator makes a lower low. The price holds above its previous low even though momentum dipped further, which shows buyers stepping in early, so the pullback is likely to be only a pause. In a downtrend, a hidden bearish divergence forms when the price makes a lower high on a rebound while the indicator makes a higher high.
Traders use hidden divergence to join an existing trend at a better price. It complements the advice earlier in this article: both approaches trade in the direction of the main trend and take the entry at the end of a correction. Enter after the price turns back in the trend direction, place the stop loss behind the low of the pullback in an uptrend or the high of the rebound in a downtrend, and aim for the previous extreme of the trend or the next strong level.
Which Indicators Show Divergence
Any oscillator that swings with momentum can show a divergence. Four are built into MetaTrader 4 and MetaTrader 5, and each gives the signal a slightly different character.
- MACD. The most popular choice, with default settings of 12, 26 and 9. Compare the highs or lows of the MACD histogram or its main line with the price. Signals come less often and are more dependable. The indicator is explained step by step in the guide to the MACD.
- RSI. Usually set to 14 periods. A divergence that forms while the RSI is above 70 or below 30 carries more weight, because the market is already stretched.
- Stochastic. Faster than the MACD and the RSI, so it shows divergences earlier and more often, including more false ones. Use it on H1 and above and confirm it with a level on the chart.
- OsMA. A histogram of the gap between the MACD line and its signal line. It turns earlier than the MACD itself, so a divergence on the OsMA often appears one or two swings sooner.
Two indicators showing the same divergence at the same point give a stronger signal than one. Pick one main oscillator, learn how it behaves on your instrument, and use a second one only as confirmation.
Bottom Line
In this article we described the difference between divergence and convergence. Divergence vs convergence stand for the process of diverging/converging of the price chart and the trading indicator. These are good trading signals used for opening and closing positions.
To make signals more efficient, the divergence/convergence should be used alongside other instruments of tech analysis. Before trading for real, practice on a demo account.
FAQ
What is divergence in forex?
Divergence in forex is a mismatch between the price of a currency pair and an oscillator. The price makes a new high, but the indicator does not confirm it with a higher high of its own. It shows that the move is losing strength and that a correction or a reversal may follow.
What is the difference between divergence and convergence?
In this article, divergence appears at highs: the price rises to a higher high while the indicator makes a lower high, a bearish sign. Convergence appears at lows: the price falls to a lower low while the indicator makes a higher low, a bullish sign. Many traders call convergence a bullish divergence.
What is hidden divergence?
Hidden divergence appears during a correction inside a trend and signals that the trend will continue. A hidden bullish divergence is a higher low on the price with a lower low on the indicator; a hidden bearish divergence is a lower high on the price with a higher high on the indicator.
Which indicator is best for divergence?
The MACD is the most widely used, because its signals are less frequent and more dependable. The RSI works well when the divergence forms above 70 or below 30. The Stochastic shows divergences earlier but gives more false signals.
Which timeframe works best for divergence trading?
H1 and higher. On minute charts, oscillators swing so often that divergences appear constantly and carry little meaning. The higher the timeframe, the fewer the signals and the stronger each one is.
Any information provided in articles on this website is based solely on the personal opinions of the authors. These articles should not be construed as trading recommendations or a call to action. The authors and RoboForex accept no responsibility for the results of any trades made on the basis of these recommendations and reviews. Past performance is not indicative of future results. Trading stocks and CFDs involves a high risk of capital loss.