False Signals in Forex: Why They Appear and How to Filter Them

False signals are entries that meet the rules of your strategy, after which the price goes the other way. They come mostly from three sources: news that reverses the market right after the release, indicators distorted by a sharp move, and false breakouts of support and resistance. No strategy is free of them, and a few filters cut their number: a candle close beyond the level, the trend on a higher timeframe and signals tested in advance on history.
TL;DR
- Check the economic calendar and how the market reacted to the same news before, and wait a few minutes after a release.
- Enter a breakout only after a candle closes beyond the level, or on the retest of the broken level.
- Backtest your indicator signals and trade only the patterns you know well; after a stop loss, wait before opening an opposite trade.
Having opened a position, many traders ponder at the question: “Why did it close with a loss if I seemed to do everything right? Almost all signals by the strategy were there but in the end, the price went in the opposite direction”. The keyword in the question is “almost”. Sometimes the market makes movements that you cannot forecast or calculate, in which case indicators turn out virtually useless. What was the point? What went wrong? The answer is simple: the trading strategy gave a false signal, and the trade turned out losing.
Let us try to make it clear why such things happen and why false signals appear.
Why Do False Signals Appear?
A false signal is a setup that looks complete by the rules of the strategy and still fails. Indicators, levels and candlestick patterns are all built on past prices, so they describe what the market has done, and a sharp new move can break the picture at any moment. The risk is highest in three situations. The first is news: the price runs ahead of a release and then turns sharply. The second is the moment right after a sudden spike, when indicators still count the spike and give distorted readings. The third is a level that the price pierces for a short time before returning, the classic false breakout. In each case the trader usually enters too early, before a candle has closed or before a second signal confirms the first. Low timeframes add their own noise, so the same setup fails more often on M5 than on H4 or D1.
The News
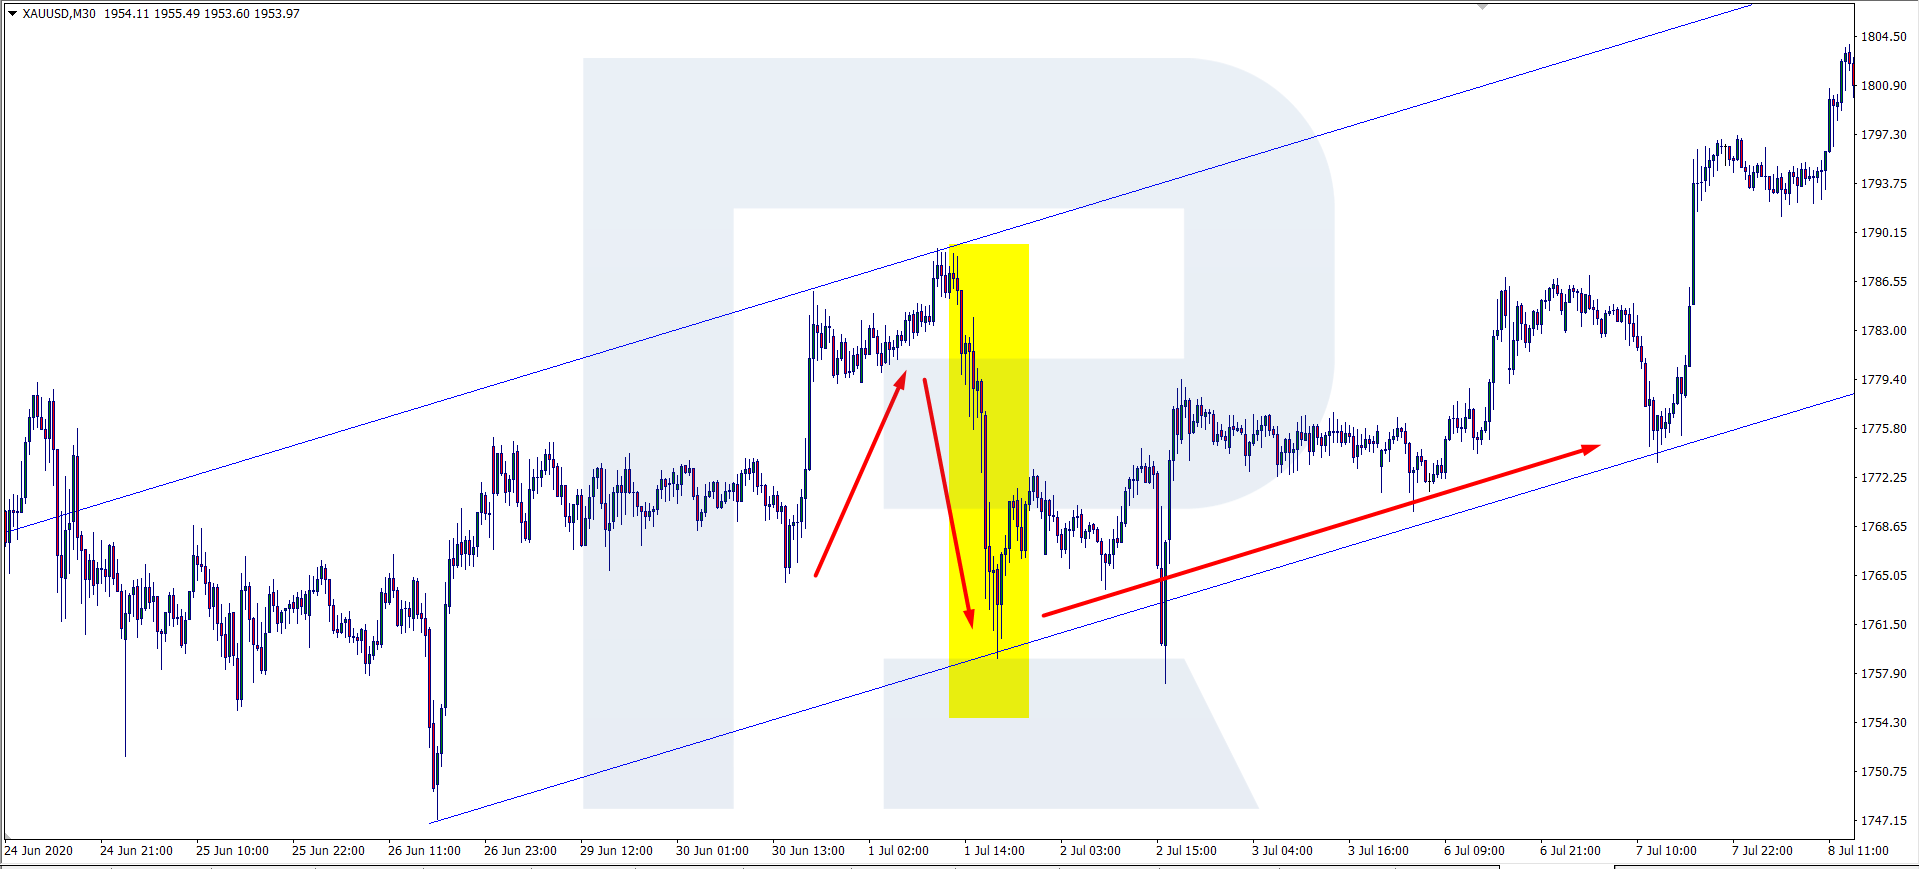
News is, perhaps, the most frequent reason for false signals. As you know, the market accounts for everything, and before some news is officially published, the quotations react and start moving in a certain direction. Normally, if some preliminary results turn out better than expected (such as the GDP reports), the quotations will grow. However, practice shows that the quotations start growing before the publication of the news itself, and at the renewal of the data, the market makes an abrupt reversal and starts a steep decline.
At this moment, Stop Losses trigger at the positions opened beforehand, and impatient market participants worsen the situation, craving for a swift and large profit. Several minutes after the publication of the news, the market calms down, and the price starts going in the correct direction.
Errors in Indicator Calculations
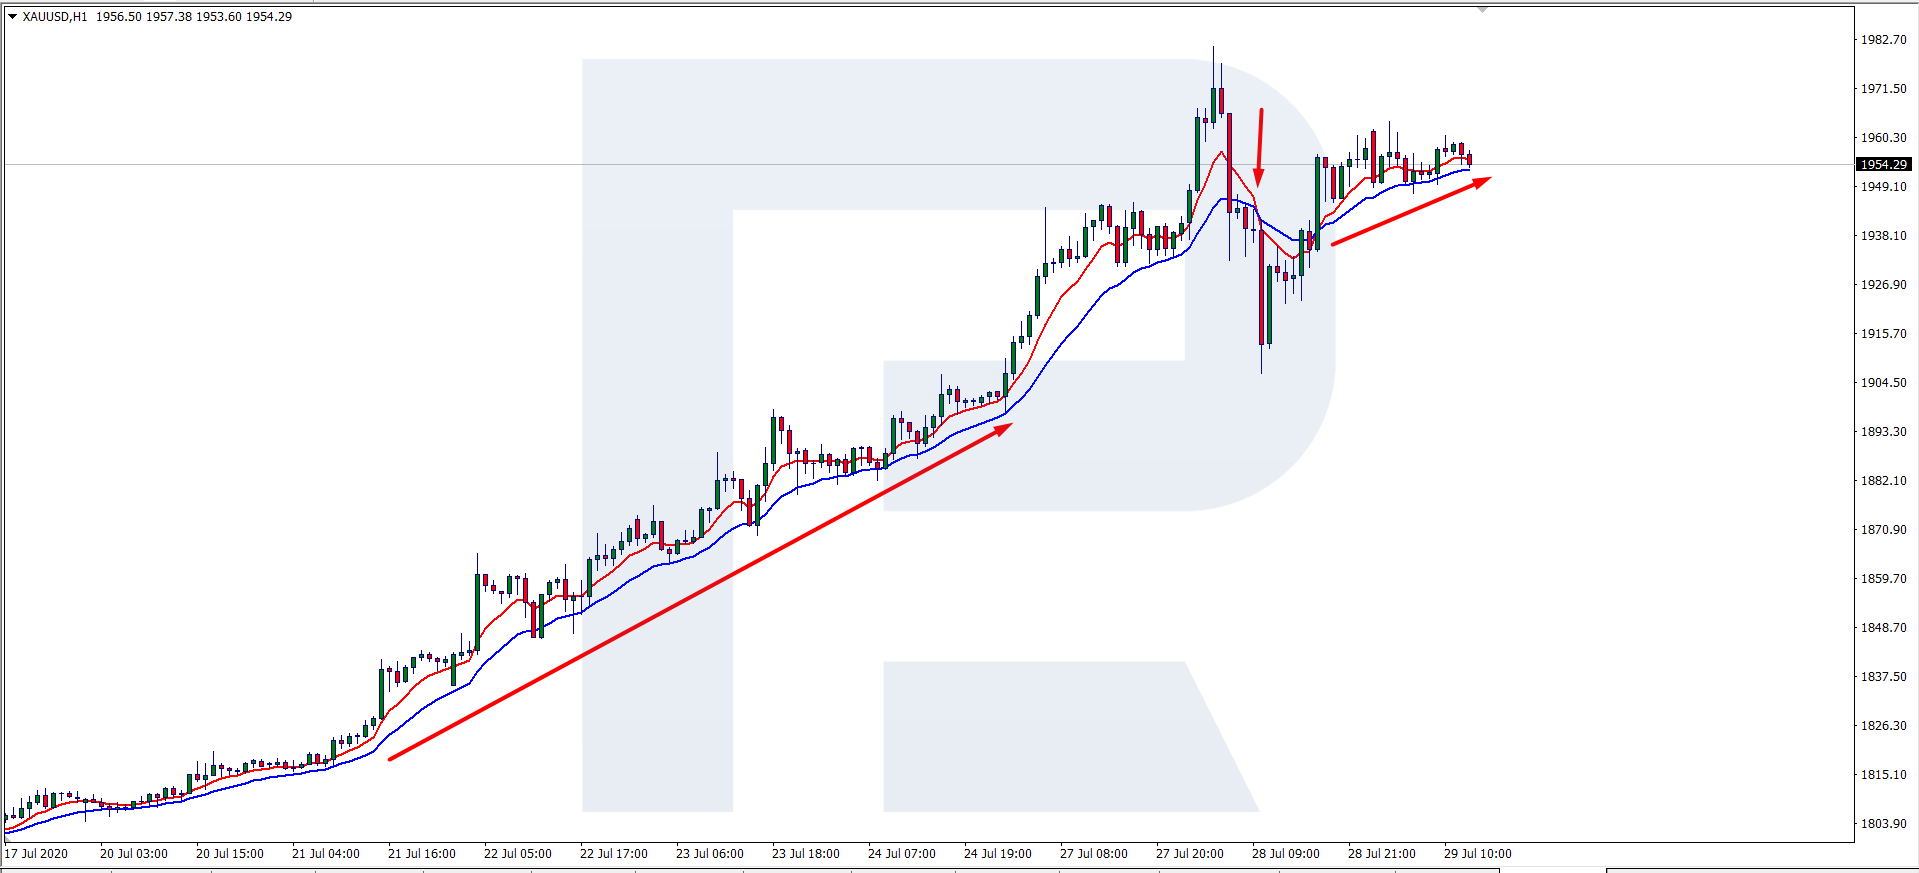
Another reason for the appearance of false signals is errors in the indicator calculations. Many traders tend to forget that after abrupt market movements the data they receive is heavily distorted, and their indicators make mistakes. Impatient traders decide that this is an entry signal and get a losing position.
Trade on the Go With RoboForex MobileTrader
A portable trading workstation on your phone, on Android and iOS.
False Breakouts of Levels
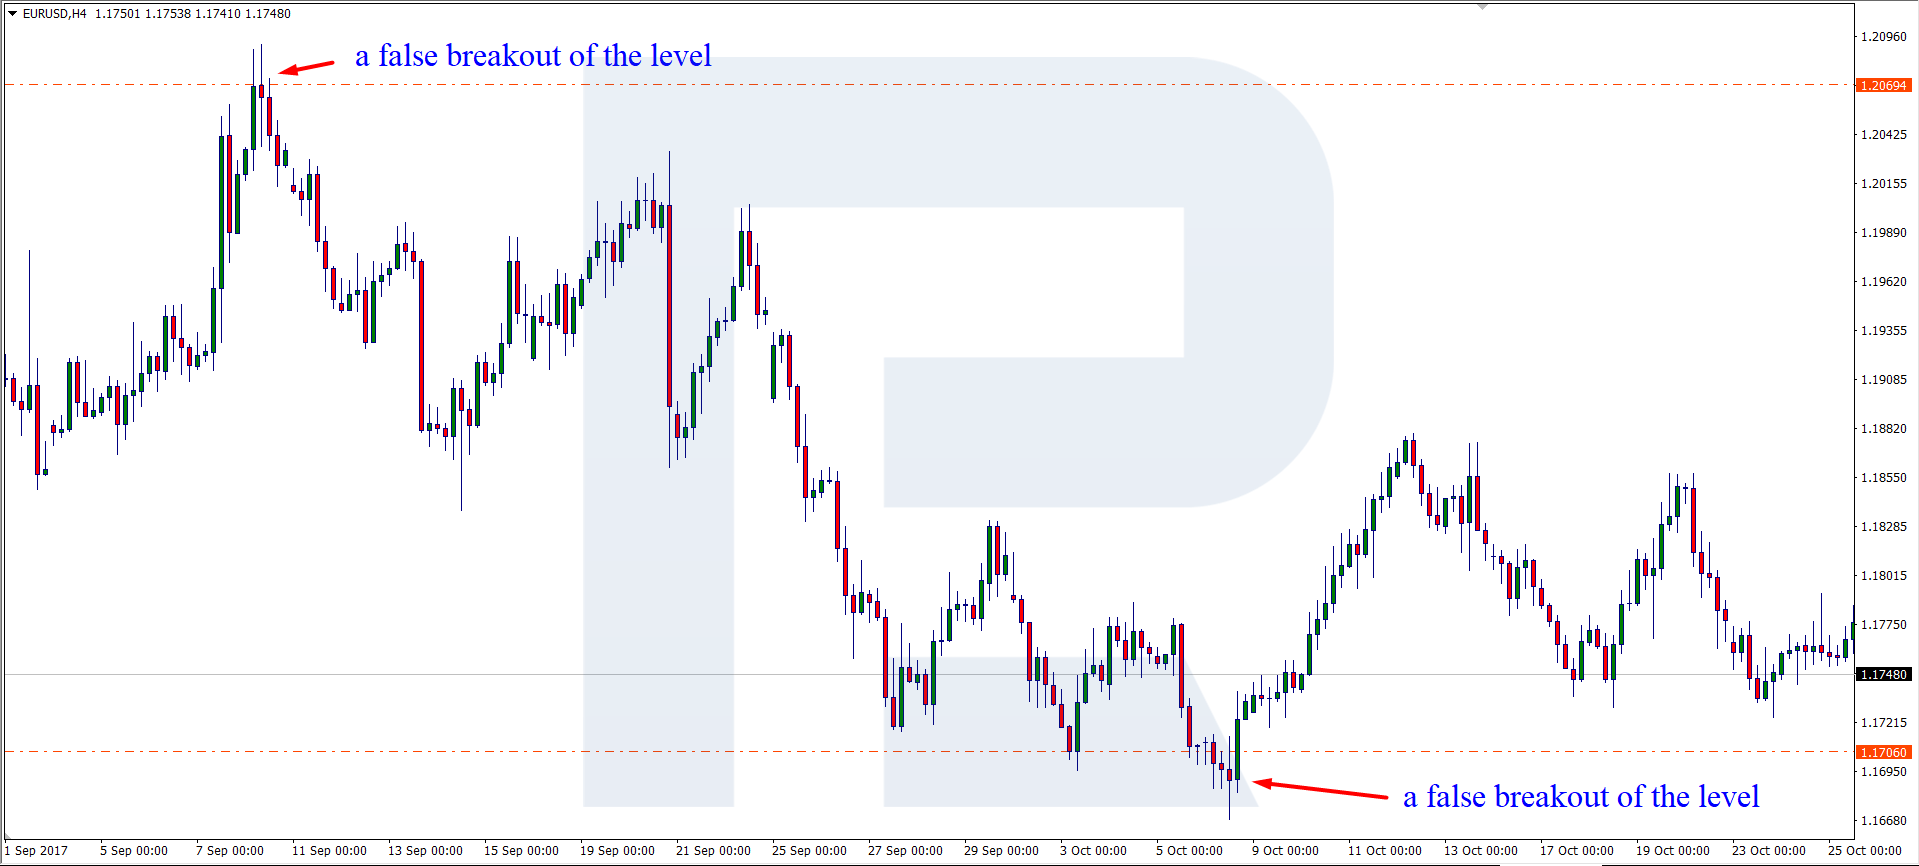
In tech analysis, the most widespread false signals are false breakaways of levels. There are two options of trading support and resistance levels: to trade bounces off them or their breakaways. Here is where market players get mistaken.
Let us imagine trading bounces off the resistance level. The price reached the level, and the trader decided to open a selling trade. They placed the SL behind the level (in a safe zone) but the price broke the level away and closed the trade by the SL.
What do impatient traders do in such cases? Normally, they open an opposite (buying) trade and get their position closed by the SL again. The conclusion is simple: impatience and hurry will never do you good in trading.
If you use candlestick analysis, things are almost the same. The trader hurries to open a position beforehand and ends up with a losing trade. To avoid losing positions or at least minimize their number, study the principle of the formation of Japanese candlesticks and opening signals in more detail.
The table sums up the causes from this article, how to recognise each one and what to do.
| Cause | How to recognise it | What to do |
|---|---|---|
| News | The price runs ahead of a scheduled release, then turns sharply on the data | Check the calendar, study past reactions to the same release, wait a few minutes after it |
| Indicator errors | A signal appears right after an abrupt move that the indicator still counts | Wait for the market to calm down, confirm with price action or a second indicator |
| False breakout | The price pierces a level with a wick and closes back on the other side | Enter only after a candle closes beyond the level, or on the retest |
| Early candlestick entry | The trade is opened before the pattern candle has closed | Wait for the close and trade only patterns you have backtested |
| Moving averages that only touch | Two MAs meet and move apart again without a real crossing | Add a filter: Fractals or the close of the previous candle |
| Emotional opposite trade | A reverse position opened right after a stop loss, outside the strategy | Pause and return to the plan; the market often resumes the first direction |
How to Filter False Signals

Every filter works in the same way: it asks the market for one more piece of evidence before you commit money. The simplest is time. Wait for the signal candle to close, since many false signals disappear before the close. The second is the higher timeframe: a buy signal on H1 is stronger when D1 is also in an uptrend. The third is a second tool of a different type, for example a trend indicator confirmed by an oscillator, or a level confirmed by a candlestick pattern. Around news, the economic calendar shows when the high-impact releases are due, so you can stay out of the minutes when the price swings hardest. Each filter costs a few entries and some points of the move, and in return keeps you out of many losing trades.
As I have said above, you will hardly exterminate false signals altogether. But minimizing their number is available to almost any trader, just follow several rules:
When Trading the News, Check the History
Using fundamental analysis for trading, study the influence of some news on the market historically. Quite often, the market reacts to the same news in the same way, so you can forecast the reaction and make the right decision.
Wait Before Opening an Opposite Order
If your first position closed by the SL, do not rush at opening an opposite one. In most cases, the market will carry on in the direction of your initial position. Note that an opposite order is usually opened on emotion, outside the strategy.
Use Backtesting and Demo Accounts for Checking Your Entry Points
When using strategies with indicators, make sure to check your entry points by backtesting and using a demo account. After this, you will have a clear understanding of what signals your indicators give and which of the signals are primary and which are secondary. The 15-minute backtest in MetaTrader 5 shows how to run such a check.
The Moving Average is really treacherous from this point of view. The thing is that the signal they give is their crossing but it remains unclear where and when the crossing is complete. Quite often, two MAs just touch and diverge; the trader enters a position, considering it a crossing, and loses money.
In such a case, an additional filter will be optimal: try Fractals or closing of the previous candlestick.
Start Trading Now
Forex, stocks, indices and gold on MetaTrader 4 and MetaTrader 5, from a free demo account to a live one.
Choose Your Graphic Analysis Patterns for Opening Positions
When trading by graphic (chart) analysis, study the figures in advance and decide which ones you will use for opening positions. Practice shows that not all signals are equally good for everyone.
To avoid false entries at patterns, always be sure about the entry point. Quite often, after a breakaway of the neck of the Head and Shoulders pattern the price returns to the broken level and only then starts working off the signal for real.
Choose Several Clear Patterns for Japanese Candlesticks Analysis
If you trade Japanese candlesticks, it is even more important to master the principles of pattern formation and backtest the signals. The best decision is to pick up several clear candlestick combinations and deselect the signals that are unclear to the trader in some dimension.
Each candlestick pattern has its peculiarities. For example, the Pin Bar pattern is based on perplexing market participants by an abrupt movement (say, growth) and an equally unexpected reversal. On the contrary, the Doji pattern is characterized by modest movements, as if the market were speculating about where to go next before reversing.
Bottom Line
When trading by any system you must stick to your algorithm all the time. Do not correct the strategy on-the-go and never try to adjust it for the current situation. It works vice versa: the situation must suit your algorithm.
The key point here is: never rush. Of course, speed is the priority for scalping strategy but you must realize that these strategies would be a heavy duty for market beginners. A thought-out decision is a key to success.
FAQ
What is a false signal in trading?
A signal that meets the rules of your strategy, after which the price moves the other way. Indicators, levels and candlestick patterns can all give them, most often around news and after sharp moves.
What is a false breakout?
A move in which the price pierces a support or resistance level for a short time and then returns to the other side. Traders who entered on the break are stopped out, and the price often goes the opposite way.
How can I tell a false breakout from a real one?
Wait for a candle to close beyond the level. A wick through the level with a close back inside is a warning sign. A retest of the broken level from the other side and a breakout in the direction of the higher timeframe trend make the move more reliable.
Why do indicators give false signals?
Indicators are calculated on past prices, so they lag and can be distorted by a sudden spike. On low timeframes, ordinary noise produces many signals that do not lead to a real move.
Can I get rid of false signals completely?
No strategy is free of them. You can reduce their number with filters, such as a candle close, the higher timeframe trend and a second confirming tool, and limit the damage with a stop loss on every trade.
Any information provided in articles on this website is based solely on the personal opinions of the authors. These articles should not be construed as trading recommendations or a call to action. The authors and RoboForex accept no responsibility for the results of any trades made on the basis of these recommendations and reviews. Past performance is not indicative of future results. Trading stocks and CFDs involves a high risk of capital loss.