7 Harmonic Patterns That Rule the Trading World

Harmonic patterns are price structures of four or five swing points whose legs relate to each other through Fibonacci ratios. Each one ends at a point D, or C for the Shark, where the ratios cluster and a reversal becomes likely. The seven most used are the Gartley, Butterfly, Bat, Crab, ABCD, 5-0 and Shark; they differ in how deep the correction goes and how far the last leg extends.
TL;DR
- Mark the swing points with ZigZag and measure each leg with the Fibonacci tools to see which pattern the ratios match.
- Wait for the price to reach the completion point and confirm the turn with a reversal candle or an oscillator divergence.
- Place the stop loss beyond the completion zone and test the pattern on a demo account before trading it live.
In this article, we will consider the use of harmonic patterns in trading. We will get acquainted with the history of their emergence, and the principles of their formation, and tell you about the most popular patterns.
What Are Harmonic Patterns?
Harmonic patterns are graphical price patterns based on a combination of Fibonacci ratios and Elliott wave elements. The basis for such patterns was laid down in the works of Harold Gartley, a renowned analyst, and technical analysis specialist. His book "Profits in the Stock Market" describes his trading methodology in detail.
The harmonic patterns became widely known and popular at the end of the last century when Gartley's works were further developed by his followers: Scott Carney, Larry Pesavento, and Bryce Gilmore. They have refined the description of already known models, and also identified and described new ones.
Harmonic patterns are versatile: they can be used to trade on different timeframes and financial markets. The most popular are Gartley, Butterfly, 5-0, Crab, ABCD, Bat, and Shark.
The table compares the seven patterns described below, with the ratios given in this article.
| Pattern | Type | XA and AB | BC | CD and completion | Entry point |
|---|---|---|---|---|---|
| Gartley | Reversal | AB about 61.8% of XA | 38.2% to 88.6% of AB | 127.2% to 161.8% of BC, D near 78.6% of XA | D |
| Butterfly | Reversal | AB about 78.6% of XA | 38.2% to 88.6% of AB | 161.8% to 224% of BC, D near 127.2% of XA | D, beyond X |
| 5-0 | Reversal | AB 113% to 161.8% of XA | 161.8% to 224% of AB | D near 50% of BC | D |
| Crab | Reversal | AB 38.2% to 61.8% of XA | 38.2% to 88.6% of AB | 224% to 361.8% of BC, D near 161.8% of XA | D, far beyond X |
| ABCD | Reversal or continuation | AB is the first impulse | 61.8% to 78.6% of AB | 127.2% to 161.8% of BC, CD roughly equal to AB | D |
| Bat | Reversal | AB 38.2% to 50% of XA | 38.2% to 88.6% of AB | 161.8% to 261.8% of BC, D near 88.6% of XA | D, before X |
| Shark | Reversal | AB 113% to 161.8% of XA | 161.8% to 224% of AB, C near 113% of OX | No D: the pattern ends at C | C |
Harmonic Patterns in Trading
Harmonic patterns are not limited to the forex market, as they can also be found in other trading markets such as stocks, futures, ETFs. In trading, harmonic patterns can be used to identify potential reversal points, areas of support and resistance, and entry and exit points.
Harmonic patterns in trading are based on the idea that the market has a cyclic behavior, which can be represented by certain geometric ratios, such as the Fibonacci sequence. These patterns can help traders identify potential trends and reversals, allowing them to make informed trading decisions.
Traders can use harmonic patterns to identify areas of support and resistance. When a harmonic pattern is identified, traders can use other technical analysis tools, such as trend lines, moving averages, or price action analysis, to confirm the pattern and make informed trading decisions.
Harmonic patterns can also be used to identify entry and exit points. For example, traders may use a bullish harmonic pattern to identify an area of support and look for a bullish candlestick pattern or price action signal to confirm the entry point.
Trade on the Go With RoboForex MobileTrader
A portable trading workstation on your phone, on Android and iOS.
Harmonic Gartley Pattern
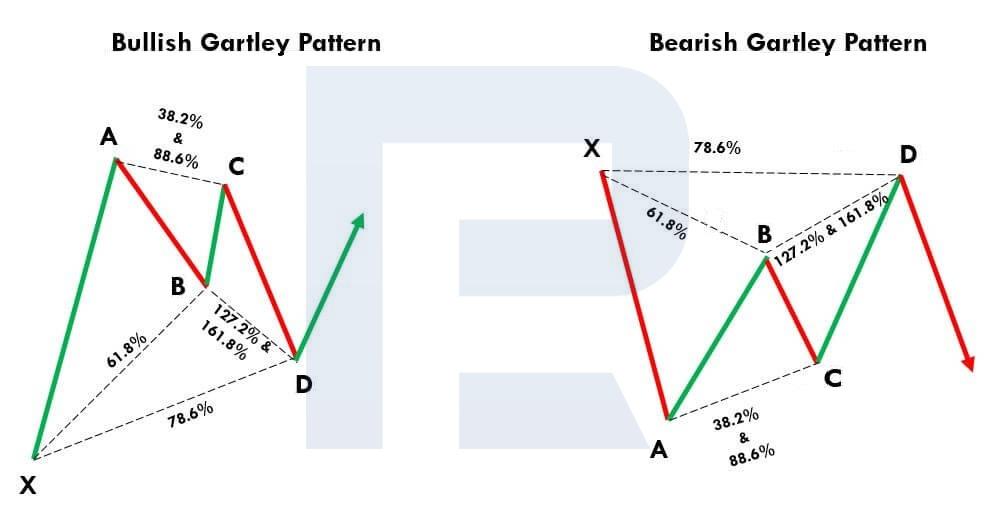
The Gartley pattern is one of the first harmonic patterns described. It is also called "Gartley's butterfly" because of the similarity in the outlines of price movements, and the Fibonacci lines on the chart resembling the wings of a butterfly.
It forms after a strong impulse XA and describes a correction that retraces part of it without breaking point X. The bullish version looks like the letter M on the chart and appears after a rise; the bearish one looks like a W and appears after a fall. The key area is point D near 78.6% of XA, where the completion of the CD leg meets the retracement of the whole pattern. A trader waits there for confirmation: a reversal candle such as a Pin Bar, a divergence on an oscillator or a reaction from a support or resistance level. The stop loss usually goes beyond point X, since a move past it cancels the pattern.
Stages in the Formation of the Harmonic Gartley Pattern
- XA is the first impulse of the price movement on the chart
- AB is the correction from the first XA movement at approximately 61.8%
- BC can be 38.2%, 50%, 61.8%, 78.6%, 88.6% of the AB wavelength
- CD can be 127.2%, 146%, 150%, and 161.8% of the BC wavelength and ends around the correction level of 78.6% of the XA wavelength
- The D-point is the final point in the pattern, where a reversal of quotes is expected
Harmonic Butterfly Pattern
The Butterfly pattern, created by Bryce Gilmore, is very similar to the one mentioned above. Therefore, understandably, many traders confuse the two.
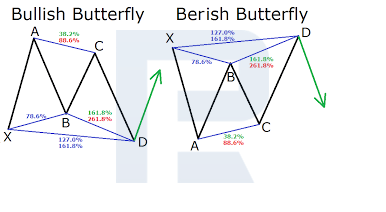
The difference is where the pattern ends. In the Gartley, point D stays inside the XA leg; in the Butterfly, the last leg breaks beyond point X and completes near 127.2% of XA. So the Butterfly marks a reversal at a new extreme: a false new high in the bearish version or a false new low in the bullish one. It often forms at the end of a mature trend, when the last push fails. Confirmation is the same as for the Gartley: a reversal candle, a divergence or a reaction from a level at D. The stop loss goes a little beyond D, and the first target is usually point B.
Stages in the Formation of the Harmonic Butterfly Pattern
- XA is the first impulse of the price movement on the chart
- AB is the correction from the first XA movement at approximately 78.6%
- BC can range from 38.2% to 88.6% of the AB wavelength
- CD can range from 161.8% to 224% of the BC wavelength and ends at about 127.2% of the XA wavelength
- The D-point is the final point in the pattern, where a reversal of quotes is expected
5-0 Harmonic Pattern
The 5-0 pattern was first described in detail in Scott Carney's book "Harmonic Trading: Volume Two", which was published in 2007. Visually, it resembles the Head and Shoulders and Wolf Waves patterns.
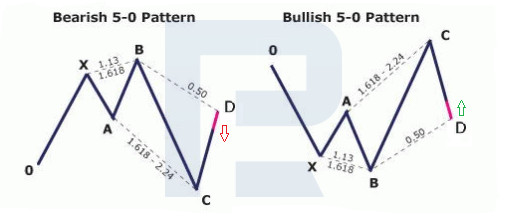
Unlike the patterns above, the 5-0 starts after a long trend that has already ended: its first legs show the old trend running out of strength, and the pattern catches the first correction of the new direction. Its key feature is the extended BC leg, the longest in the pattern, followed by a pullback of about half of it. Point D near 50% of BC is where the trader looks for an entry in the direction of the new trend. Confirmation comes from a reversal candle at D or from the price holding a support or resistance level there. Because the pattern trades a trend that is only starting, the stop loss usually goes beyond the nearest Fibonacci level past D.
Stages in the Formation of the 5-0 Harmonic Pattern
- OX is the first impulse of the price movement on the chart
- XA is the correction from the first OX movement
- AB can range from 113% to 161.8% of the XA wavelength
- BC is the longest wavelength and can be between 161.8% and 224% of the AB wavelength
- CD is the final leg of the pattern and ends at approximately 50% of the BC wavelength
- The D-point is the final point in the pattern, where a reversal of quotes is expected
Crab Harmonic Pattern
The harmonic Crab pattern was introduced to the trading community by Scott Carney in 2000. Its appearance on the price chart signals the end of the current price momentum and an impending reversal.
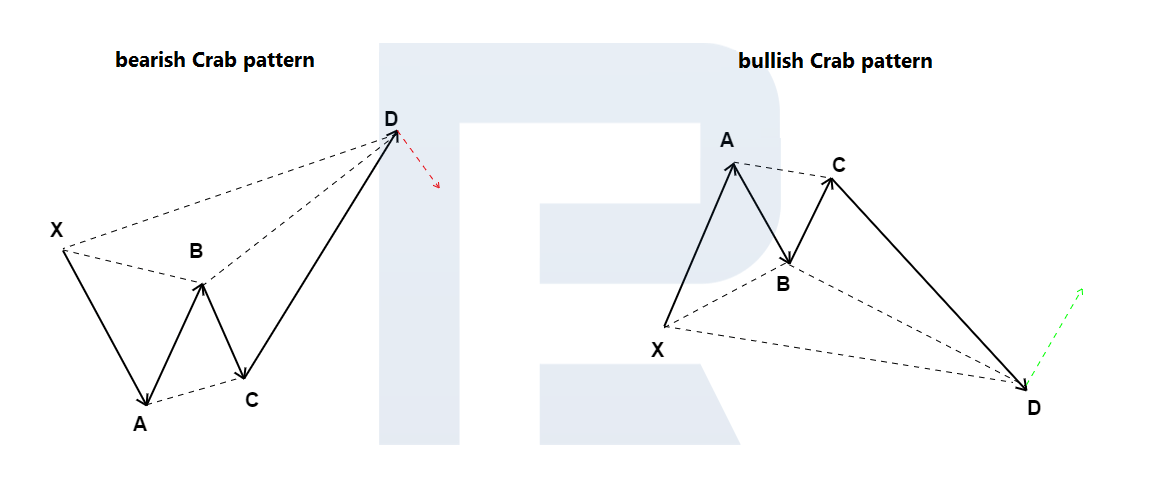
The Crab has the most extended last leg of all seven: CD runs far past point X and completes near 161.8% of XA. That makes it a pattern of sharp, exhausted moves, often after news or a spike, when the price overshoots and then turns. Because point D sits so far out, the completion zone is narrow and precise, which allows a tight stop loss just beyond D. Traders confirm the Crab with a reversal candle at D or with an overbought or oversold oscillator. The first target is usually the 38.2% retracement of the CD leg.
Stages in the Formation of the Crab Harmonic Pattern
- XA is the first impulse of the price movement on the chart
- AB is the correction from the first XA movement, ranging from 38.2% to 61.8%
- BC can range from 38.2% to 88.6% of the wavelength of AB
- CD, the longest wave, ends at about 161.8% of the XA wavelength and is an extension of 224-361.8% of the BC wavelength
- The D-point is the final point in the pattern, where a reversal of quotes is expected
ABCD Harmonic Pattern
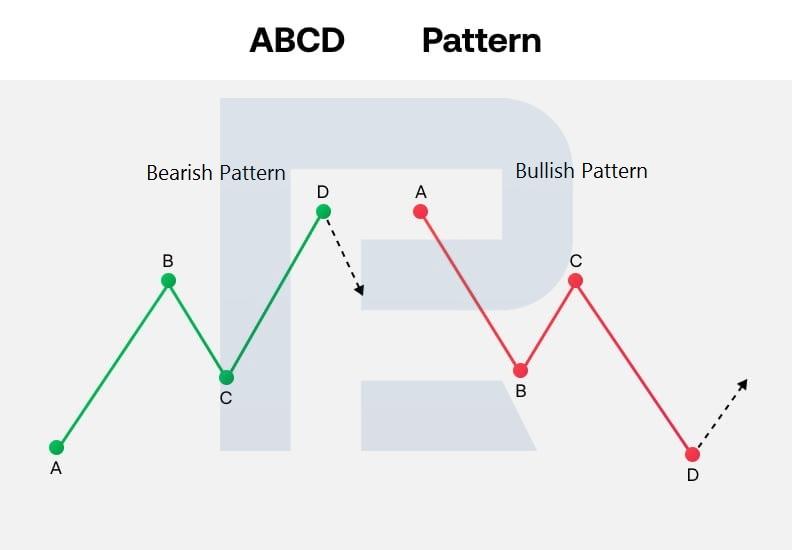
ABCD pattern is one of the most straightforward harmonic patterns and looks like diagonal lightning on a price chart. It is essentially a three-wave correction, after which the price movement towards the main trend can continue.
The ABCD is the building block of the other patterns: the last three legs of a Gartley, Bat or Crab form an ABCD of their own. Its idea is symmetry. The CD leg tends to repeat the AB leg in length, and often in time, so a trader can project point D in advance by copying AB from point C. It forms on any timeframe, both inside a trend and at its end. Confirmation at D is a slowdown of the price, a reversal candle or a reaction from a level. The stop loss goes beyond D, and a common target is a return to point C.
Stages in the Formation of the ABCD Harmonic Pattern
- AB is the first impulse of the price movement on the chart
- BC is a correction from the first AB movement, ranging from 61.8% to 78.6%
- CD is the final wave, which could be 127.2% to 161.8% of the length of the BC wave, and should be roughly equal to the AB impulse
- The D-point is the final point in the pattern, where a reversal of quotes is expected
Start Trading Now
Forex, stocks, indices and gold on MetaTrader 4 and MetaTrader 5, from a free demo account to a live one.
Harmonic Bat Pattern
The Bat pattern was introduced by Scott Carney in 2001. It is characterised by a good Stop Loss to Take Profit ratio: usually 1:2 and above.
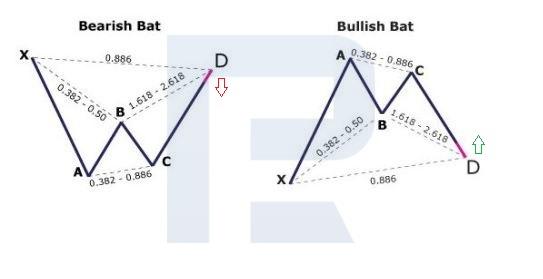
The Bat looks like a Gartley with a shallower first correction: AB retraces only 38.2% to 50% of XA, and the pattern completes deeper, near 88.6% of XA. Point D sits close to X but does not pass it, so a stop loss just beyond X stays short, while the targets at points B and C are far away. That is where the good ratio comes from. The Bat forms as a correction inside an existing trend and trades the return to that trend. Traders confirm it with a reversal candle, a divergence or a level at D, and many wait for the candle at D to close before entering.
Stages in the Formation of the Harmonic Bat Pattern
- XA is the first impulse of the price movement on the chart
- AB is the correction from the first XA movement, ranging from 38.2% to 50%
- BC can range from 38.2% to 88.6% of the wavelength of AB
- CD, the final wave, constitutes an extension of 161.8% to 261.8% of the BC wavelength and ends at about the correction level of 88.6% of the XA wavelength
- The D-point is the final point in the pattern, where a reversal of quotes is expected
Shark Harmonic Pattern
The harmonic Shark pattern was described in 2011 by Scott Carney. Its appearance on the price chart signals a possible trend reversal. The formed pattern visually resembles a shark's fin or its open mouth.
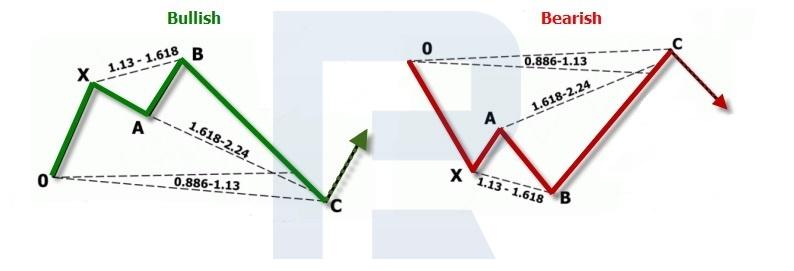
The Shark differs from the other patterns in two ways: it has no point D, and its last leg BC is an impulse. The move to C overshoots point O and completes near 113% of OX, where the reversal is expected. This makes the Shark a pattern of false breakouts: the price breaks a previous extreme, traps the traders who followed it and turns. Many traders treat it as the first stage of a 5-0 pattern, which begins where the Shark ends. Confirmation at C is a reversal candle or a divergence, and the stop loss goes beyond the 113% level.
Stages of Shark Harmonic Pattern Formation
- OX is the first impulse of the price movement on the chart
- XA is the correction from the first OX movement
- AB can range from 113% to 161.8% of the XA wavelength
- BC is the longest wavelength, ending at about 113% of the OX wavelength, and can be 161.8-224% of the AB wavelength
- Point C is the final point in the pattern where a reversal is expected
How to Find Harmonic Patterns in MT4
MetaTrader 4 has no built-in harmonic pattern tool, but the standard ones are enough to find them by hand:
- Mark the swings. Add the ZigZag indicator from Insert -> Indicators -> Custom. It connects the swing highs and lows and gives you candidates for points X, A, B, C and D.
- Measure the legs. Use Insert -> Fibonacci -> Retracement to check how deep AB and BC retrace, and Fibonacci Expansion to project where CD may end.
- Match the ratios. Compare the measured values with the table above. The pattern counts only when all legs fit; one leg out of range turns a Gartley into a different pattern or into nothing.
- Mark the completion zone. Draw a rectangle around the price where the CD projection and the XA retracement meet. That is where you wait for confirmation.
Scanning dozens of charts by hand takes time, so many traders add a custom harmonic indicator that draws the patterns automatically. Such indicators are copied to MQL4 -> Indicators through File -> Open Data Folder and then appear in the Navigator. Check any indicator on history before relying on it: some redraw patterns after the fact, which makes them look more accurate than they are. The Fibonacci levels guide explains the ratios behind them.
Harmonic Patterns in Forex
Harmonic patterns in forex are a popular technical analysis tool used to identify potential trading opportunities. These patterns are formed by a series of price movements that follow specific geometric ratios, typically the Fibonacci sequence. Harmonic patterns can help traders to identify potential areas of support and resistance, as well as entry and exit points.
One of the most common harmonic patterns in forex trading is the Gartley pattern. The Gartley pattern has a bullish version that can be identified by five distinct price points. These include the X point, which is the start of the pattern, the A point, which represents the first move down from the X point, the B point, which is a retracement of the move from A to X, and the C point, which is the second move down from the B point. The D point is the final point of the pattern, and it represents a retracement of the move from X to A.
Another common harmonic pattern in forex is the Butterfly pattern. The Butterfly pattern has a bullish version that can be identified by five distinct price points. These include the X point, which is the start of the pattern, the A point, which represents the first move down from the X point, the B point, which is a retracement of the move from A to X, the C point, which is the second move down from the B point, and the D point, which is the final point of the pattern and represents a retracement of the move from X to A.
It's important to note that while harmonic patterns can be an effective tool for trading forex, they are not infallible. Traders should always use additional analysis tools and risk management strategies to minimize their risk and increase their chances of success.
Harmonic Patterns in the Stock Market
Harmonic patterns in the stock market are similar to those found in the forex market, where they can be used to identify potential trends and reversals. The same geometric ratios, such as the Fibonacci sequence, apply to the stock market as well, allowing traders to use harmonic patterns to identify key levels of support and resistance. By understanding and using harmonic patterns in the stock market, traders can make more informed trading decisions and potentially improve their profitability.
Conclusion
Many traders like to use harmonic patterns when trading. The combination of Fibonacci ratios with elements of Elliott Waves in these patterns helps to identify potential pivot points on the price chart and find trades with a good Stop Loss to Take Profit ratio.
Harmonic patterns are versatile: they can be used in different timeframes and financial markets. Special indicators have been created to automate their detection on the chart. Before using harmonic patterns in real trading, you should test their detection and execution on a demo account.
FAQ
What are harmonic patterns in trading?
Price structures of four or five swing points whose legs relate through Fibonacci ratios. They mark the area where a correction or a trend is likely to end, so traders use them to find reversal points and entries.
Which harmonic pattern is the most reliable?
None works on its own. The Gartley and the Bat are the most widely used, and the Bat is known for a short stop loss behind point X. Any pattern becomes more reliable when a reversal candle, a divergence or a level confirms it at the completion point.
What is the difference between the Gartley pattern and the Butterfly pattern?
Where point D ends. In the Gartley pattern, D stays inside the XA leg, near 78.6% of it. In the Butterfly pattern, D goes beyond point X, near 127.2% of XA, and marks a reversal at a new extreme.
How do I find harmonic patterns on a chart?
Mark the swing highs and lows, for example with the ZigZag indicator, then measure each leg with the Fibonacci Retracement and Expansion tools. If every leg matches the ratios of one pattern, mark the completion zone and wait for confirmation there.
Do harmonic patterns work in forex?
Yes. They appear on currency pairs, stocks, indices and commodities, on any timeframe. Like every chart pattern, they fail at times, so trade them with a stop loss and test them on a demo account first.
Any information provided in articles on this website is based solely on the personal opinions of the authors. These articles should not be construed as trading recommendations or a call to action. The authors and RoboForex accept no responsibility for the results of any trades made on the basis of these recommendations and reviews. Past performance is not indicative of future results. Trading stocks and CFDs involves a high risk of capital loss.