How to Trade with Bulls Power and Bears Power Indicators?

Bulls Power and Bears Power are two oscillators by Alexander Elder that measure how far buyers push the high above a 13-period EMA and how far sellers push the low below it. Together with the EMA they form the Elder Ray. Traders buy when the EMA rises and Bears Power is negative but growing, and sell when the EMA falls and Bulls Power is positive but falling.
TL;DR
- Add EMA 13 to the chart and Bulls Power and Bears Power with period 13 from Insert -> Indicators -> Oscillators.
- Trade only in the direction of the EMA: buys when it rises, sells when it falls.
- Buy when Bears Power is below zero and rising, sell when Bulls Power is above zero and falling; a divergence makes the signal stronger.
This article is devoted to using two indicators, Bulls Power and Bears Power, in financial markets. These indicators are meant for measuring the strength of trends.
How Do Bulls Power and Bears Power Work?
These indicators were created by a famous trader and the author of the Elder Triple Screen trading system, Alexander Elder. They help estimate the current power balance of buyers and sellers and catch the moment when bears/bulls are getting weaker. The combination of these indicators is also known as the Elder Ray.
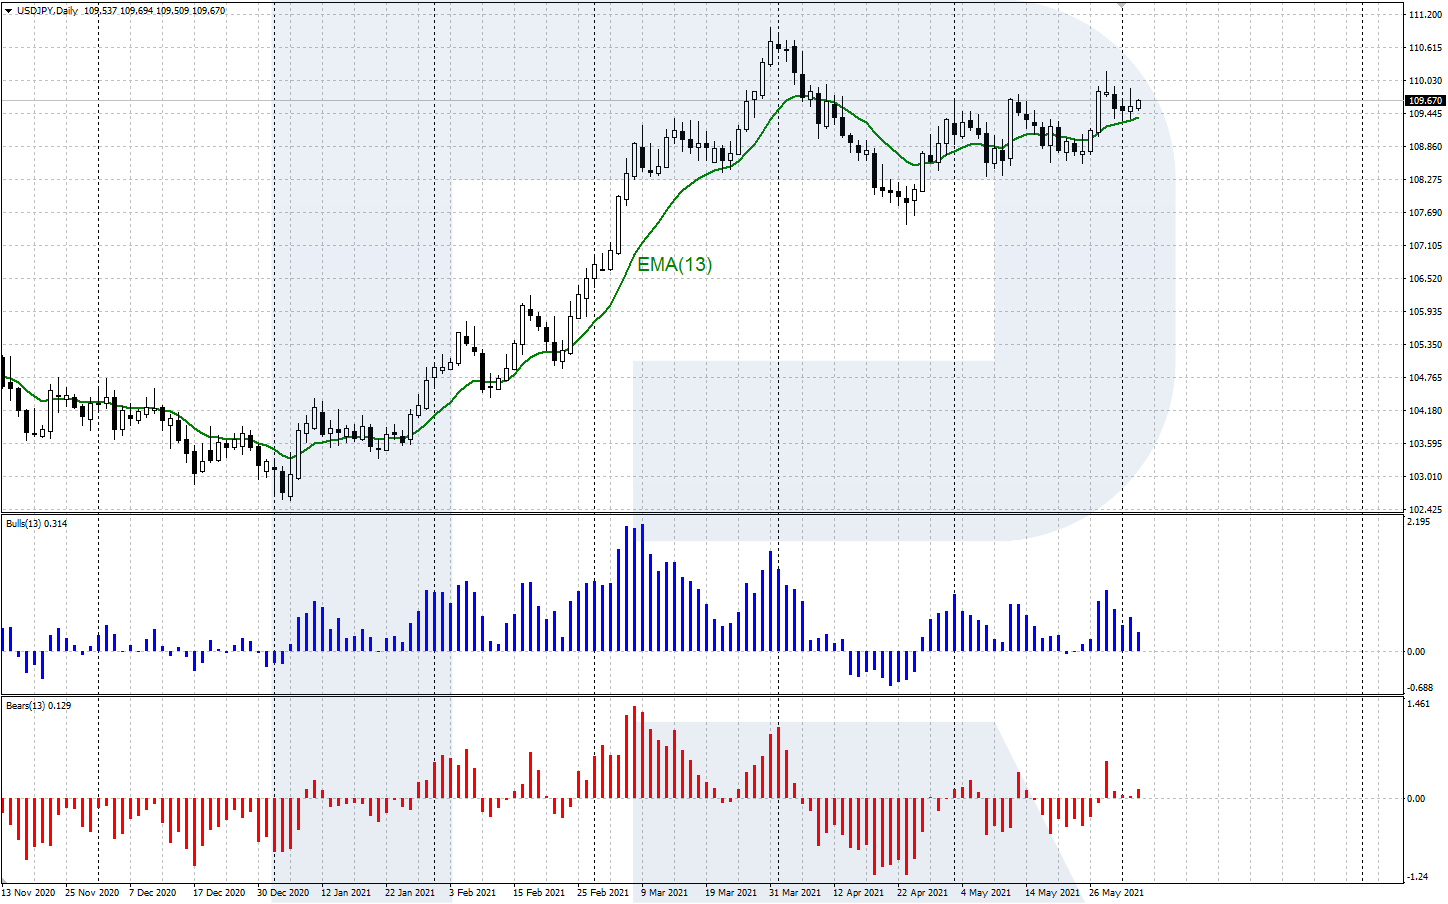
Bulls Power demonstrates the strength of bulls in the market. It compares the highs with the Exponential Moving Average. If the Bulls Power histogram is above zero and growing, this means buyers are holding the price above the EMA, and bulls are now stronger than bears. And vice versa, if the histogram is declining, dropping below zero, this indicates the predominance of bears.
Bears Power, in its turn, demonstrates the strength of bears in the market. It compares the lows with the EMA. If the Bears Power histogram is below zero and declining, this means sellers are holding the price below the EMA, and bears are now stronger than bulls. However, if the histogram starts growing and rises above zero, this means bulls are in control of the market.
In essence, Bulls Power and Bears Power are irregular oscillators. They appear in separate windows under the price chart. They look like bar histograms with the central line at zero. To determine the direction of the active trend, Elder recommends adding to the chart an EMA (13), drawn by close prices.
Trade on the Go With RoboForex MobileTrader
A portable trading workstation on your phone, on Android and iOS.
Installing and Setting Up the Indicators
Bulls Power and Bears Power are included in many popular trading terminals. To install the indicator to the chart of your financial instrument in MetaTrader 4 or MetaTrader 5, go to the Main Menu: Insert/Indicators/Oscillators/Bulls Power and Bears Power.
The formulae of the indicators look as follows:
- Bulls Power = HIGH - EMA (13)
- Bears Power = LOW - EMA (13)
Where:
- HIGH is the high of the candlestick
- LOW is the low of the candlestick
- EMA (13) is the value of the Exponential Moving Average with period 13
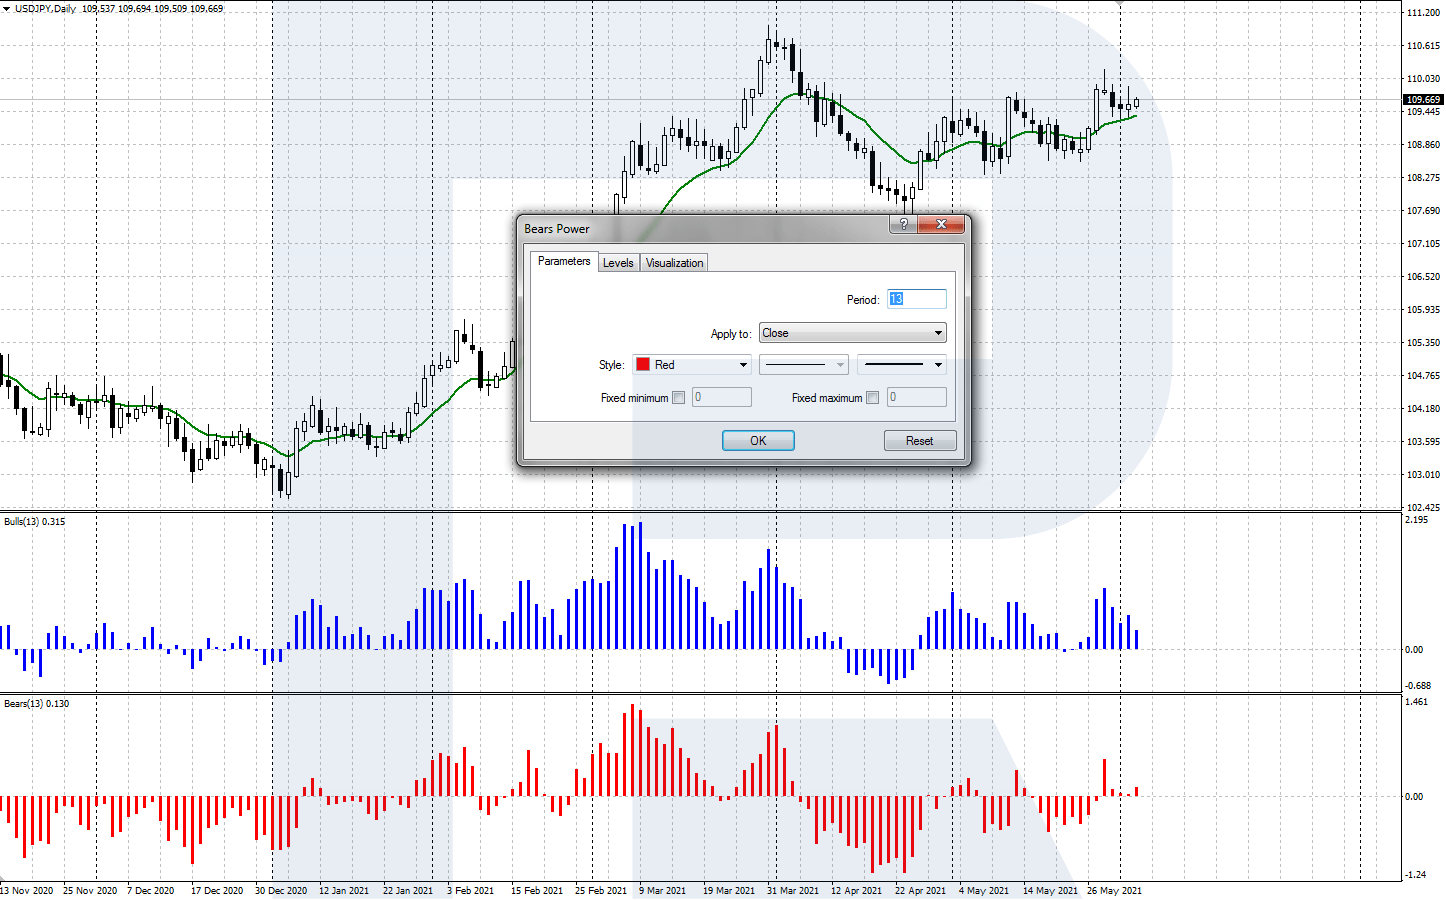
Installing the indicators, specify the following parameters in the setting window:
- Period: the author recommends 13;
- Apply to: choose the necessary price type here. By default, Close is used;
- Style: choose the width and color of the histogram bars.
Bulls Power and Bears Power are normally used with the author’s settings. However, you may always experiment and backtest your personalized settings.
Trading With Bulls Power and Bears Power
The original method by A. Elder presumes using signals from three indicators: Bulls Power, Bears Power and EMA (13). The latter demonstrates trend direction, while the remaining two indicators are used for finding entry points.
The logic behind the method is to buy weakness in an uptrend and sell strength in a downtrend. When the EMA rises, the trend is up, and the trader waits for a pullback. During the pullback the lows dip below the EMA, so Bears Power turns negative. The moment it starts rising again shows that sellers are losing their grip and the pullback is ending: that is the buy signal. In a downtrend the picture is mirrored: the price bounces, the highs rise above the EMA, Bulls Power turns positive, and its first decline shows that buyers are running out of strength. Elder stressed that the EMA comes first. A negative and rising Bears Power against a falling EMA is not a buy, because it trades against the trend. The optional conditions, rising peaks of the other histogram and a divergence, filter out weak pullbacks. The table sums up the settings and signals.
| Indicator | Period | Buy signal | Sell signal | Confirmation |
|---|---|---|---|---|
| EMA | 13, on Close | The EMA points up | The EMA points down | Trade only in its direction |
| Bears Power | 13 | Below zero and rising | Each new bottom lower than the previous one | A bullish divergence with the price supports a buy |
| Bulls Power | 13 | Each new peak higher than the previous one | Above zero and falling | A bearish divergence with the price supports a sell |
Practise the signals on a chart first, for example on the daily EUR/USD chart.
A Signal to Buy
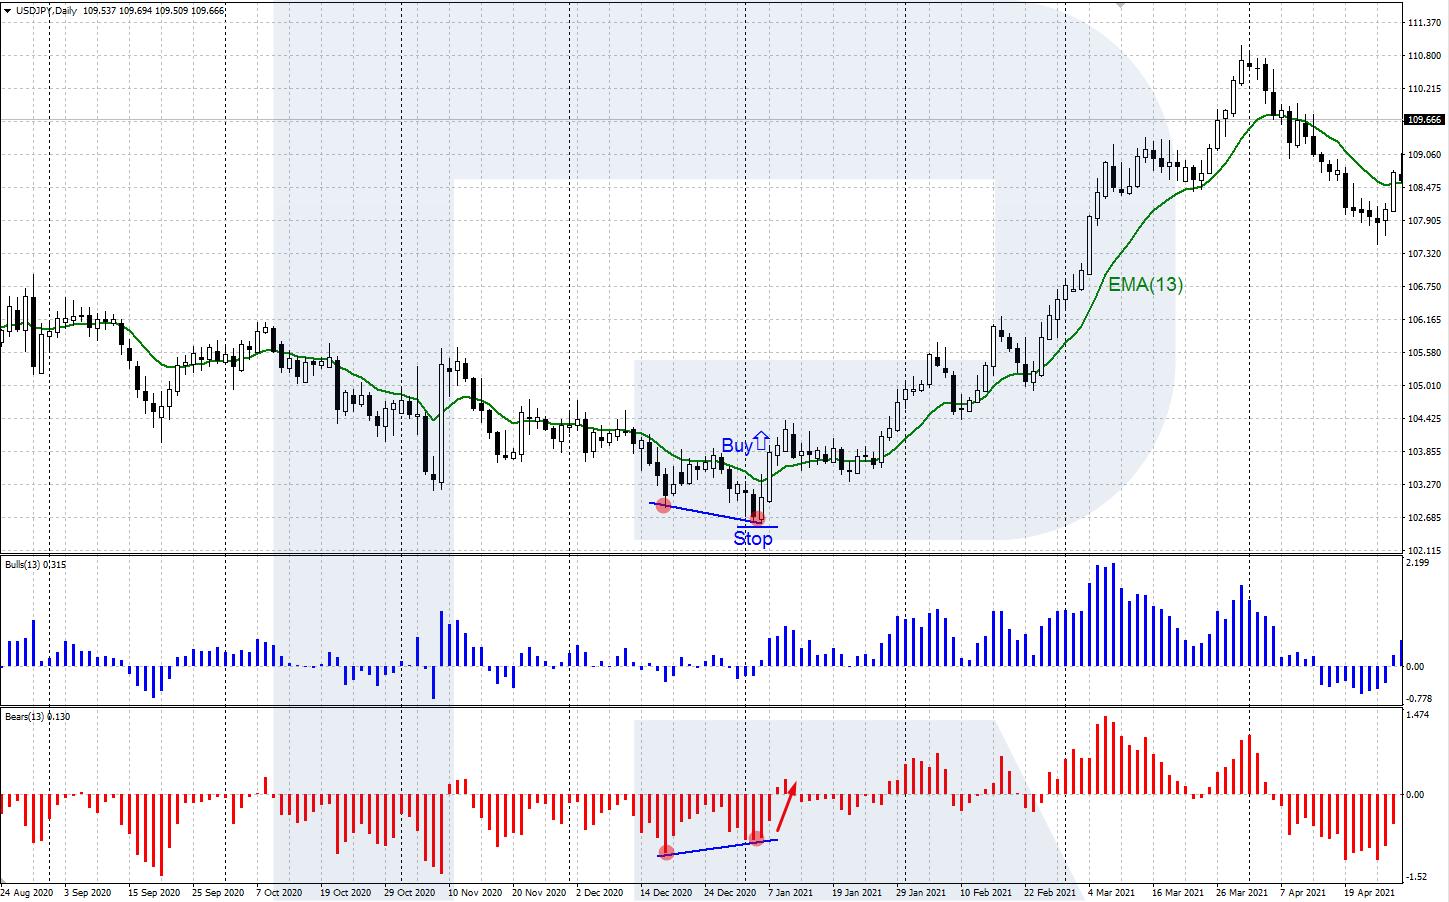
A signal to buy requires two main conditions:
- EMA (13) is aiming upwards; an uptrend has already started or is just beginning;
- Bears Power is negative but growing: the bars are reaching 0 and higher.
Two more conditions which are not obligatory but increase the probability of a successful trade:
- The last peak of the Bulls Power histogram is above the previous one.
- Bears Power has formed a bullish divergence: on the price chart, the new low is lower than the previous one, while in the histogram, a new low is above the preceding one.
After the signal forms, place a pending buy order (or enter by the market) a bit higher than the high of the last two candlesticks.
Place a Stop Loss behind the local low on the price chart and take your profit when a strong resistance area is reached or some evidence of a reversal downwards appears.
Start Trading Now
Forex, stocks, indices and gold on MetaTrader 4 and MetaTrader 5, from a free demo account to a live one.
A Signal to Sell
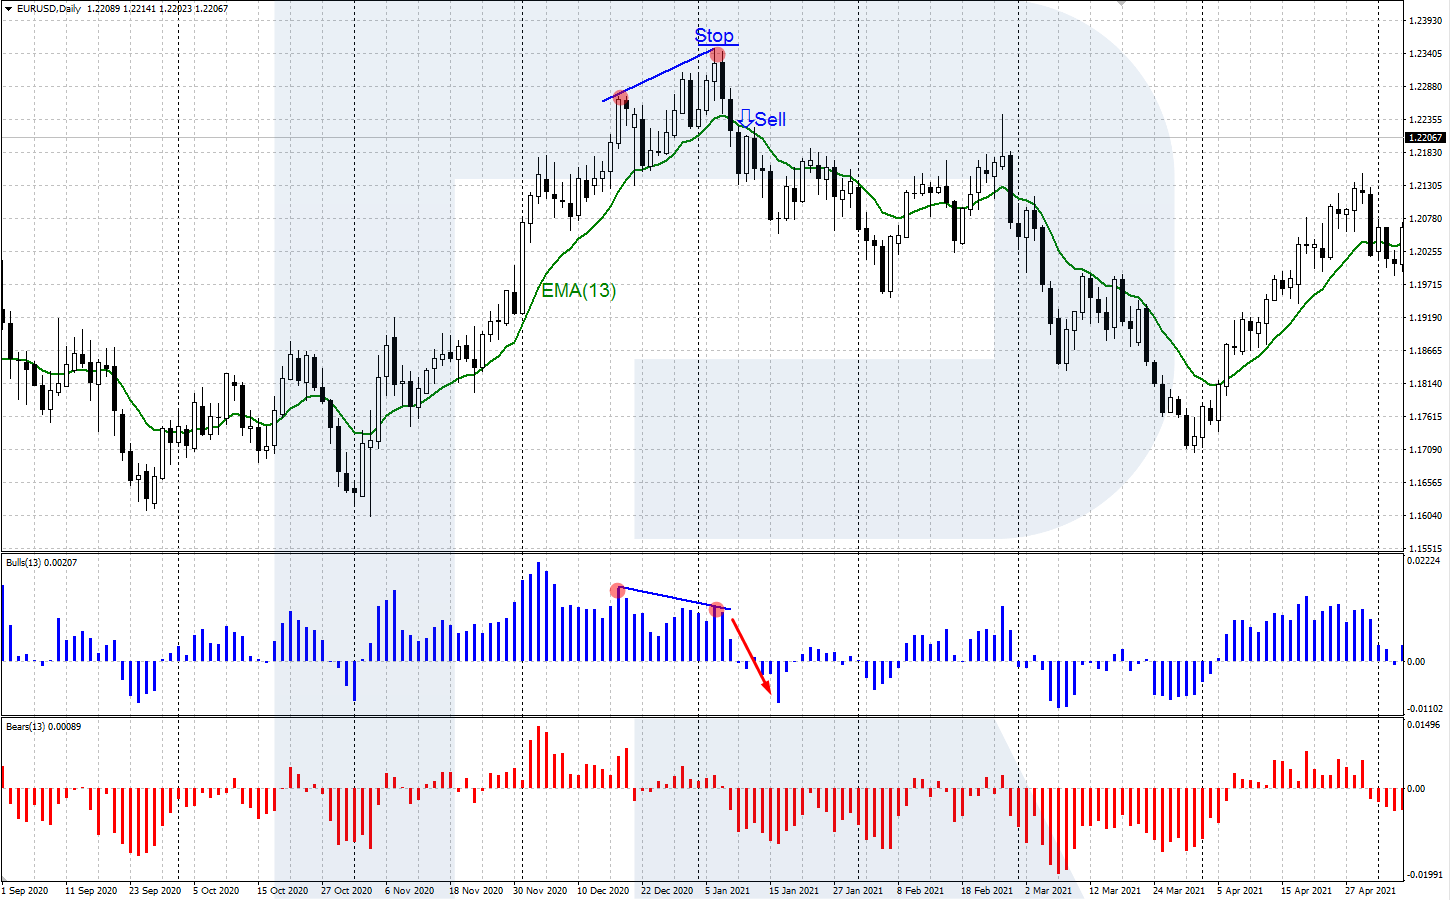
A signal to sell requires two main conditions:
- EMA (13) is aiming downwards; a downtrend has already started or is just beginning.
- Bulls Power is positive but falling: the bars are reaching 0 and lower.
Two more conditions which are not obligatory but increase the probability of a successful trade:
- The last bottom of the Bears Power histogram is below the previous one.
- Bulls Power has formed a bearish divergence: on the price chart, the new high is higher than the previous one, while in the histogram, a new high is below the preceding one.
After the signal appears, place a pending sell order (or enter by the market) a bit lower than the low of the last two candlesticks.
Place a Stop Loss behind the local high on the price chart and take your profit when a strong support area is reached or some evidence of a reversal upwards appears.
Elder Ray Index: How It Relates
The Elder Ray is the name Alexander Elder gave to the whole set: EMA 13 and the two histograms, which he called Bull Power and Bear Power. The idea is in the name. Like an X-ray, the tool shows what the candles hide: how much of each bar was driven by buyers and how much by sellers, measured against the average price of the last 13 bars. The EMA stands for the market's consensus of value; the high shows the most the bulls could achieve, and the low the most the bears could.
In MetaTrader, the Elder Ray is not a single indicator. You build it from three parts: Bulls Power, Bears Power and a 13-period EMA on the price chart. Some other platforms combine the two histograms into one line called the Elder Ray Index or Bull Bear Power; the signals are read the same way.
Elder also used the Elder Ray as the oscillator of the second screen in his Triple Screen system: the weekly trend picks the direction, and Bears Power or Bulls Power on the daily chart times the pullback. For the trend itself, many traders add the MACD, another tool Elder relied on.
Bottom Line
Bulls Power and Bears Power help the trader estimate the current balance of powers of buyers and sellers in the market and provide extra trading opportunities. To increase the efficacy of your trading, use them alongside other indicators and tech analysis instruments.
To check the profitability of signals and improve your trading skills, practice on a demo account first, for example in MetaTrader 4. Find out more about A. Elder’s approach in his book “Trading for a Living”.
FAQ
What do Bulls Power and Bears Power show?
Bulls Power is the distance from the candle high to the 13-period EMA, and Bears Power is the distance from the low to the same EMA. Together they show how strong buyers and sellers are compared with the average price.
What is the Elder Ray indicator?
Alexander Elder's name for the set of EMA 13, Bull Power and Bear Power. In MetaTrader you build it from the Bulls Power and Bears Power oscillators plus a 13-period EMA on the price chart.
What are the best settings for Bulls Power and Bears Power?
Period 13 applied to Close, the values Elder recommended, with an EMA 13 on the chart. You can test other periods, but most traders keep the author's settings.
When should I buy with Bears Power?
When the EMA 13 points up and Bears Power is below zero but rising. A higher new peak on Bulls Power or a bullish divergence on Bears Power makes the signal stronger. Enter a little above the high of the last two candles.
Where are Bulls Power and Bears Power in MT4?
In the main menu, open Insert -> Indicators -> Oscillators and choose Bulls Power or Bears Power. Add each one separately, then add a Moving Average with period 13 and method Exponential to the price chart.
Any information provided in articles on this website is based solely on the personal opinions of the authors. These articles should not be construed as trading recommendations or a call to action. The authors and RoboForex accept no responsibility for the results of any trades made on the basis of these recommendations and reviews. Past performance is not indicative of future results. Trading stocks and CFDs involves a high risk of capital loss.