How to Set and Trade Murrey Math Lines

Murrey math lines are an indicator that divides the price range into eight equal parts and draws nine horizontal levels, from [0/8] to [8/8], plus extra levels above and below. Each level has a role: [4/8] is the balance line, [0/8] and [8/8] are the strongest support and resistance, and the others show where the price tends to stall, reverse or accelerate. Traders use them to find bounces and breakouts with ready-made targets.
TL;DR
- Install the Murrey math indicator as a custom indicator in MT4 and start with P = 64 on H1 or P = 256 on D1.
- Treat [0/8], [4/8] and [8/8] as the key levels: expect reversals at the outer ones and a change of bias at [4/8].
- Trade a bounce from a level back into the range or a breakout towards the next level, and confirm the signal on the candle close.
The Murrey math lines indicator adds horizontal support and resistance lines on a price chart, which, as the author believes, are able to hint at reversals. These lines also provide traders with an understanding of the current market tendency and allows them to see whether there is a potential for a trend reversal.
You can visit the RoboForex Market Analysis webpage for the latest forex forecasts.
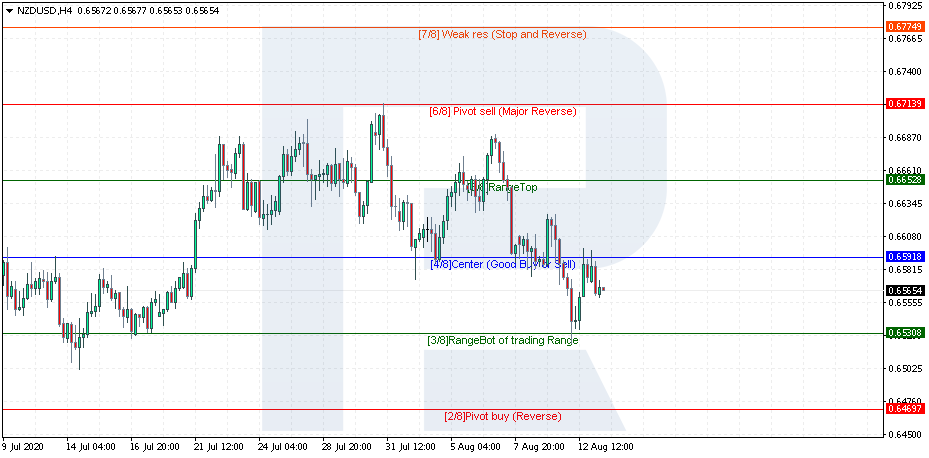
There is an opinion that a trading system based on horizontal Murrey line can provide excellent signals on any type of markets: currency and stock. According to Murrey himself, large investors will behave in the same way in all kinds of markets. They can also work with the lines on different timeframes, which is an excellent opportunity to follow their capital management rules regardless of the deposit amount.
What Is the Gist of Murrey Math Lines?
Murrey math lines are based on the approach and observations that were made by William Gann, who was famous for his perfect forecasts with the use of different kinds of market symmetry, and one of the most famous technical analysis tools is called Gann Angles. The author himself had significantly adjusted the system and made it easier and clearer for ordinary investors.
In Murrey’s opinion, markets will start corrections at some particular price levels, breakouts of and returns to which may provide traders good signals for opening positions. Regardless of the current market trend, the price must either rebound from the level or break the key level, which will point at a boost of the actual trend.
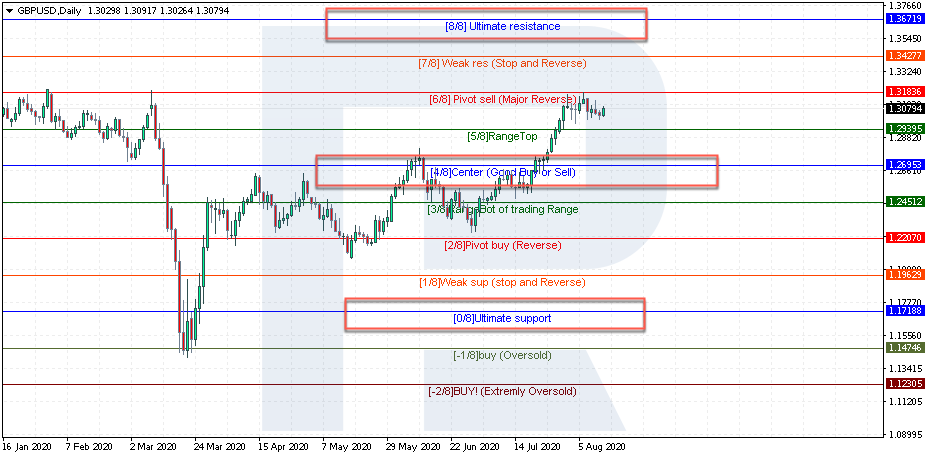
Murrey emphasized 8 price levels, marked from [0/8] to [8/8], with [0/8], [4/8], and [8/8] being the most important.
Trade on the Go With RoboForex MobileTrader
A portable trading workstation on your phone, on Android and iOS.
Parameters and Setting of Murrey Math Lines Indicator
At present, most indicators based on this trading strategy set lines automatically and can also display scenarios of possible behaviors of traders at the time the price tests these lines. After adding the indicator to a price chart, we will see 9 lines with [4/8] in the center. As a rule, a classic indicator for MetaTrader 4 and MetaTrader 5 trading terminals has only two parameters:
- P is a number of candlesticks for building the lines.
- StepBack is a number of candlesticks for a certain displacement, so that the indicator could analyze both current and previous prices.
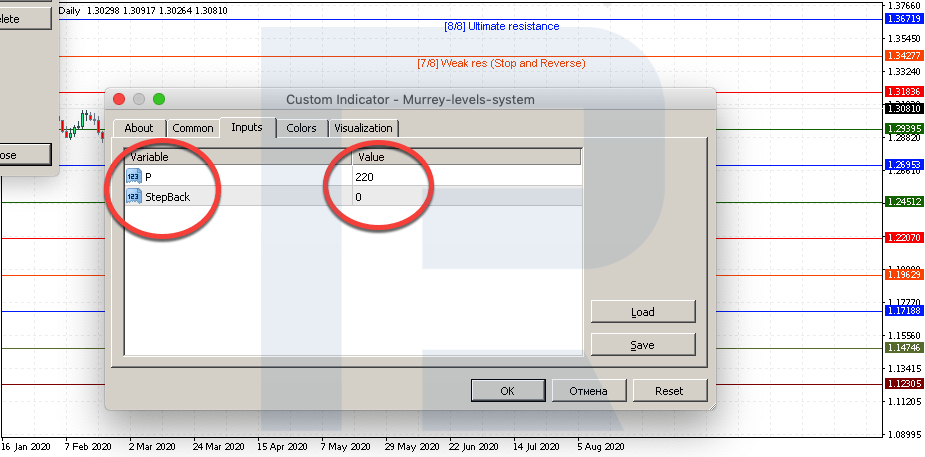
Just like with any other indicator, there is an option of choosing parameters that were offered by the author, as well as other ready-to-use settings used by investors in today’s trading.
The “P” values, as traders recommend, should be multiple of eight because the indicator is based on eight lines. Traders often use 64, 128 and 256; 16 is used very rarely, probably due to a very short period for building lines on a price chart.
If one chooses “P” equal to 64, which is suggested by the author, then it will be better to use the H1 chart.
If “P” is changed to 256, then it is recommended to switch to the daily chart or longer because H1 is too short and slow, so the lines will be quite far away from the price.
Just like adding Fibonacci levels in balanced trading, if one adds several Murrey math lines indicators with different parameters to a price chart and some different lines match in the same spot, then this line should be considered as a stronger one.
It’s important to understand that if one sets a far too long timeframe for building the indicator, the price may not leave the central area of Murrey lines. On the other hand, if one chooses a too short period, the price will often break the upper and lower lines and, as a result, the lines will be constantly redrawn, thus causing a lot of false signals.
It is recommended to choose an indicator period for each instrument individually. For example, parameters for EUR/USD and GBP/JPY (which is more volatile) will be completely different. In the case of GBP/JPY, they should be higher so that the price couldn’t break the upper and lower lines too often.
Murrey Math Settings in MT4
The Murrey math indicator is not among the standard indicators of MetaTrader 4, so it is installed as a custom one. The steps are the same for any version of the indicator:
- Copy the file. In MT4, open File -> Open Data Folder, go to MQL4 -> Indicators and copy the indicator file (.mq4 or .ex4) there.
- Refresh the list. Restart the terminal, or right-click Indicators in the Navigator window and choose Refresh. The Murrey math indicator appears among the custom indicators.
- Add it to the chart. Drag it from the Navigator onto the chart, or open Insert -> Indicators -> Custom. In the Inputs tab, set P and StepBack.
- Match P to the timeframe. Start with the author's P = 64 on H1 or P = 256 on D1, as described above, and keep StepBack at its default value until you have tested the indicator on history.
Versions of the Murrey math indicator differ in colours, labels and the number of extra levels they draw, but they all build the same [0/8] to [8/8] grid. If two versions draw different levels on the same chart with the same P, check which period and which highs and lows each one uses. Before trading the levels, compare them with the price history: the lines should mark places where the price has actually turned or paused.
How to Trade Murrey Math Lines?
Let’s consider each Murrey line on the chart and try to understand what to do when the price rebounds from or breaks a particular line.
Trading Murrey math lines comes down to two scenarios at every level. Either the price bounces, and the trade goes back towards the previous level, or it breaks through, and the trade goes on towards the next one. The levels themselves tell you which scenario is more likely: the outer lines [0/8] and [8/8] stop most moves, [4/8] decides the bias, and [3/8] and [5/8] mark the borders of the range in which the price spends much of its time. The nearest level in the direction of the trade serves as the target, and the level behind the entry, or the one after it, as the place for the stop loss. Wait for the candle to close beyond a line before treating a breakout as real, because Murrey levels, like any horizontal levels, attract false breakouts. The table sums up the levels described below.
| Level | Name | What it means | Action |
|---|---|---|---|
| [8/8] and [0/8] | Ultimate resistance and support | The strongest levels, broken mostly on important news | Expect a reversal or a serious correction |
| [7/8] and [1/8] | Weak, stall and reverse | Show whether the move has the strength to go on | A stall at [7/8] points back to [4/8]; a break points to [8/8] |
| [6/8] and [2/8] | Pivot, reverse | Strong levels, close in weight to [8/8], [0/8] and [4/8] | Trade the bounce if the candles do not close beyond the line |
| [5/8] and [3/8] | Top and bottom of the trading range | The borders of the sideways movement | A break of [5/8] targets [8/8]; a break of [3/8] targets [0/8] |
| [4/8] | Major support and resistance | The balance line of the whole grid | Above it, treat it as support; below it, as resistance |
| [+1/8] and [-1/8] | Extreme resistance and support | A test shows that the trend is weakening | Expect a correction towards [8/8] or [0/8] |
| [+2/8] and [-2/8] | Ultimate overshoot | A break shows a very strong trend | The lines are redrawn after a close 4+ bars beyond them |
Murrey Math Lines: [4/8] Level
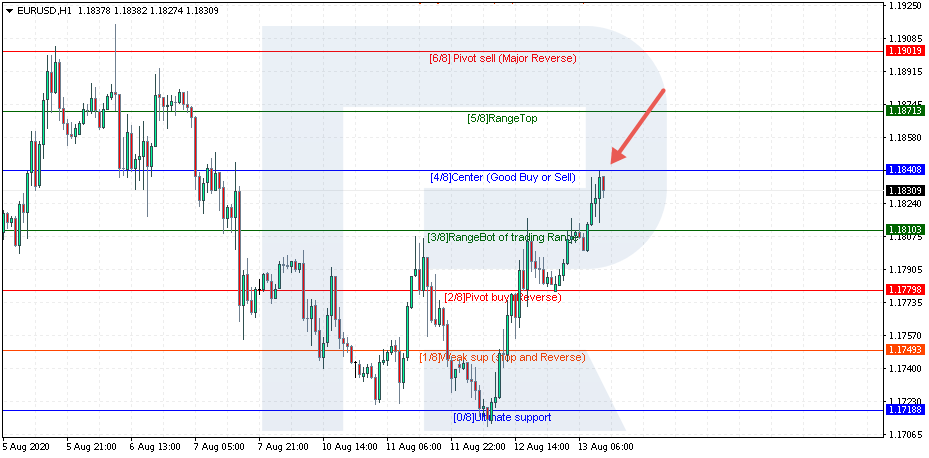
[4/8] is a middle price level or even a balance line. Prior to a breakout of this line, the price may fluctuate inside a sideways channel. If the price breaks [4/8] to the upside and moves above it, then this area may be considered as good support. However, if this line is broken downwards, it will act as a strong resistance level.
Start Trading Now
Forex, stocks, indices and gold on MetaTrader 4 and MetaTrader 5, from a free demo account to a live one.
Murrey Math Lines: [8/8] and [0/8] Levels
[8/8] and [0/8] are very strong obstacles for further movement past them. As a rule, they can be broken because of some important or surprising news, when the actual reading of some macroeconomic indicators is very different from forecasts.
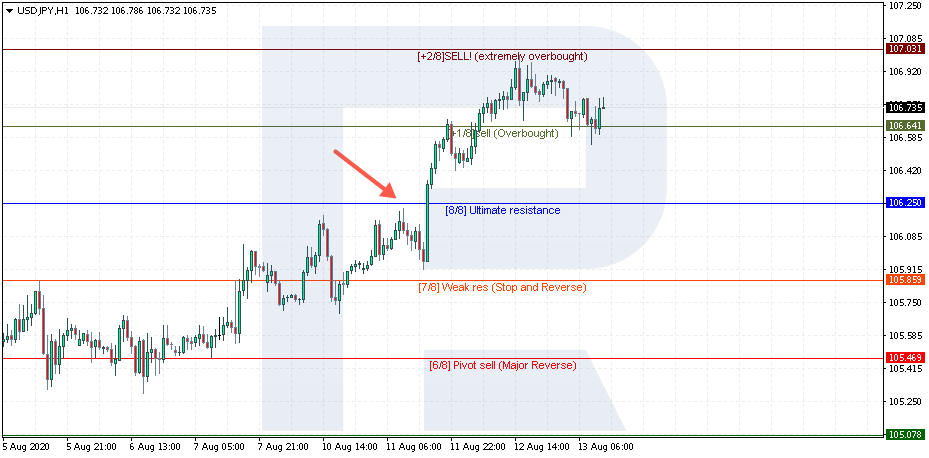
More often than not, traders expect either a reversal from this area or at least a serious correction. Also, there is an opinion, that a rebound from [0/8] to the upside is more probable than a rebound from [8/8] to the downside. [8/8] is more often broken to the upside and the price continues the uptrend.
Murrey Math Lines: [7/8] and [1/8] Levels
[7/8] and [1/8] help traders to understand whether to wait for a new impulse or the market movement was quite accidental and the price may start a correction.
For example, if the price rebounded from [4/8] to the upside, reached [7/8] but is not moving any higher and just testing [7/8], then one should expect a decline to return to [4/8].
However, if the price breaks [7/8], one may assume that the market trend is strong and the instrument may continue growing towards [8/8] or even higher. As for [1/8], the situation is quite the opposite.
Murrey Math Lines: [6/8] and [2/8] Levels
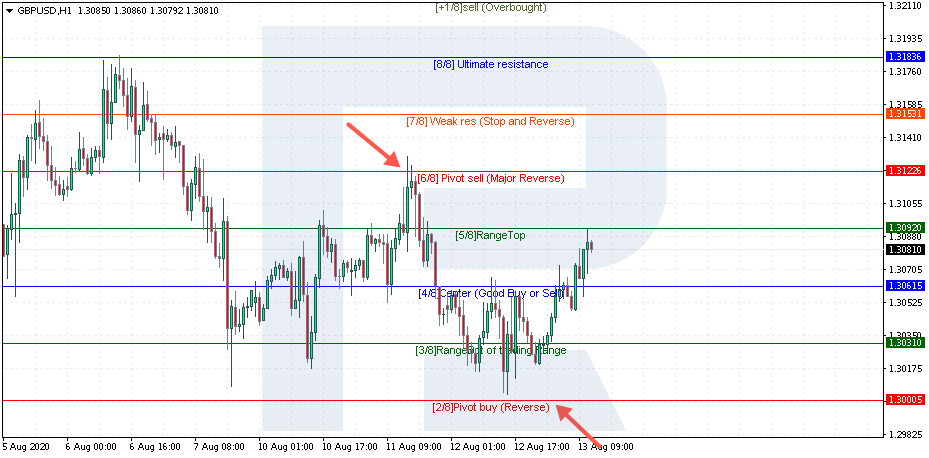
[6/8] and [2/8] are also pretty strong and traders compare them to [8/8], [0/8], and [4/8]. The lines will be very strong if after rebounding from them the price doesn’t break these lines by the closing prices.
Murrey Math Lines: [5/8] and [3/8] Levels
[5/8] and [3/8] indicate a sideways movement on the market, which happens about 50% of the time or maybe more. However, if market players push the price past one of these lines, it is expected to continue moving in the direction of a breakout.
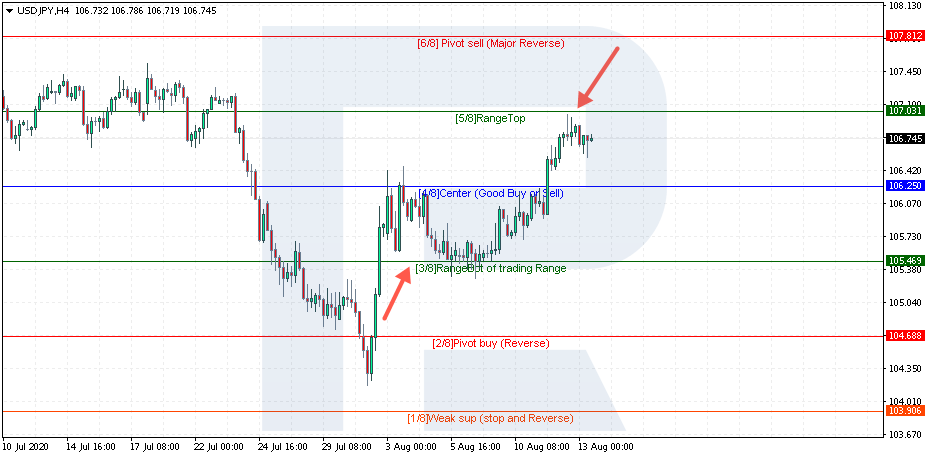
In the case of a breakout of [5/8], the closest upside target is [8/8]. If the price breaks [3/8], there is a high probability of further decline towards [0/8].
Get MetaTrader 5 From RoboForex
A free professional platform with every indicator and chart tool from this article.
Murrey Math Lines: [-1/8] and [+1/8] Levels
[-1/8] and [+1/8] are used for some kind of attempt to catch a trend reversal. [-1/8] is an extreme support level during a bearish trend, while [+1/8] is an extreme resistance during a bullish tendency.
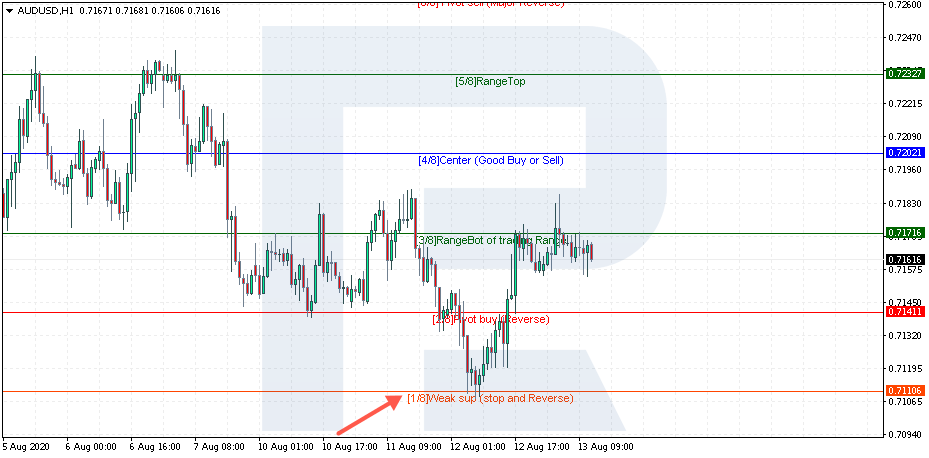
A test of these lines indicates that the current trend is weakening. As a rule, the price doesn’t reverse here and starts corrections towards [0/8] and [8/8]. After that, the previous trend resumes.
Murrey Math Lines: [-2/8] and [+2/8] Levels
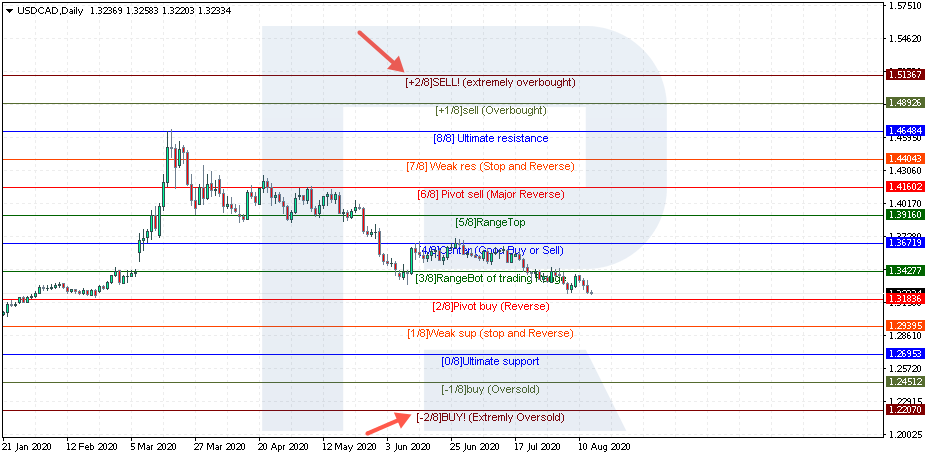
A breakout of [-2/8] and [+2/8] indicates a very strong trend on the market. [-2/8] is ultimate support during a bearish trend, while [+2/8] indicates ultimate resistance during an uptrend. At such moments, Murrey math lines are redrawn. However, the author expected a closing candlestick 4+ bars higher or lower than these lines, and only after that started re-drawing the lines on a chart.
Closing Thoughts
Trading using Murrey math lines provides traders with simple rules for entering the market. We understand that a breakout of a line will only push the price towards the next target levels on a chart, while the unwillingness of the instrument to break a line will result in a correction with specific targets. As a result, we have a strategy that implies trading in the direction of an active trend and when we need to look for a reversal, then there are particular levels, from which the price is highly likely to rebound.
However, an ordinary investor may require much time to remember all lines and watch the price behavior at the moment of breakouts or rebounds in order to grasp this method. Also, there are no clear parameters for different instruments, so one will have to choose parameters manually based on the experience gained while using the indicator.
Anyway, a trading method with the use of Murrey math lines is very interesting and unique and may be combined with your existing know-how, thus significantly improving a classic approach to using Murrey lines.
FAQ
What are Murrey math lines?
An indicator by T. Henning Murrey, built on the ideas of William Gann. It divides the price range into eight equal parts and draws horizontal levels from [0/8] to [8/8], with extra levels above and below, each with its own role as support, resistance or a turning point.
Which Murrey math level is the most important?
The article names [0/8], [4/8] and [8/8] as the key ones. [4/8] is the balance line, and [0/8] and [8/8] are the strongest support and resistance, broken mostly on important news.
What are the best settings for the Murrey math indicator?
P should be a multiple of eight. The author suggested P = 64, which suits H1; P = 256 suits D1 and longer. Choose the value for each instrument separately and test it on history.
How do I add the Murrey math indicator to MT4?
It is not built in. Copy the indicator file to MQL4 -> Indicators through File -> Open Data Folder, refresh the Navigator or restart the terminal, and drag the indicator onto the chart.
Do Murrey math lines repaint?
Yes, when the price moves far beyond the outer levels. After a strong breakout past [+2/8] or [-2/8], the grid is rebuilt around the new range. Too short a P makes this happen often and produces false signals.
Any information provided in articles on this website is based solely on the personal opinions of the authors. These articles should not be construed as trading recommendations or a call to action. The authors and RoboForex accept no responsibility for the results of any trades made on the basis of these recommendations and reviews. Past performance is not indicative of future results. Trading stocks and CFDs involves a high risk of capital loss.