Retail Sales Report and US CPI: Market Week Ahead (October 12 – 16)

The retail sales report on Thursday and the US CPI on Wednesday decide this week whether the Fed has room for another rate hike on October 28. CPI is expected to rise to 3.6% year on year from 3.4%, with core inflation at 2.5% against 2.4%, and retail sales are forecast to grow 0.3% after 1.2% in August. This issue covers US 500, XAU/USD, AUD/USD and GBP/USD.
Monday is quiet: the US bond market is closed for Columbus Day and Canada is on holiday. On Tuesday the Reserve Bank of Australia publishes the minutes of its September meeting, and the third-quarter earnings season opens with JPMorgan, Goldman Sachs, Citigroup and Wells Fargo. Thursday brings Australia's jobs data, UK GDP for August, US retail sales and PPI, and Fed Chair Kevin Warsh speaks late in the evening, New York time.
Where the Market Stands Going Into the Week
Stocks spent last week without sharp moves. US 500 gained 0.93% to 7,804.6, and the S&P 500 closed at a record on October 6. Gold added 1.34% and finished the week near 4,194 USD. The dollar moved in different directions: EUR/USD fell 0.37% to 1.1208, AUD/USD rose 0.40% to 0.6982, and GBP/USD barely changed at 1.3226.
The main event was the release of the Fed minutes on October 7. The Fed raised rates by 25 basis points to a range of 3.75% to 4.00% in September in a unanimous vote, and most officials see one more hike as likely by the end of the year. The 10-year Treasury yield briefly touched 5.365% that day, a multi-year high, before it eased to 5.227% by Friday. Data came in softer than expected: the ISM Services PMI printed 54.9 against a 55.0 forecast, and the preliminary University of Michigan consumer sentiment index dropped to 46.3 against 47.8, while one-year inflation expectations rose to 4.7%.
In early October, futures priced roughly a one in four chance of a hike on October 28, down from about 70% in late September. The shift followed a weak September jobs report: 29,000 new jobs against a 90,000 forecast, with unemployment up to 4.2%. Goldman Sachs moved its call for the next hike from October to December, and a December move is already largely priced in. That gives CPI the power to reset expectations: a hot print would bring an October hike back into play, a soft one would firm up the case for a pause.
Key Events of the Week
| Date | Event | Instruments | Importance |
|---|---|---|---|
| Tue, Oct 13 | RBA Meeting Minutes | AUD/USD, Australian government bonds | ● Low |
| Tue, Oct 13 | US bank earnings: JPMorgan, Goldman Sachs, Citigroup, Wells Fargo (Morgan Stanley and Bank of America on Wednesday) | US 500, US 30 | ●● Medium |
| Wed, Oct 14 | US Consumer Price Index (CPI) | XAU/USD, USD Index, US Treasuries, US 500 | ●●● High |
| Thu, Oct 15 | Australia Employment Change and Unemployment Rate | AUD/USD, Australian dollar | ●● Medium |
| Thu, Oct 15 | UK GDP (August) | GBP/USD, British pound, gilts | ●● Medium |
| Thu, Oct 15 | US Retail Sales and PPI | US 500, USD Index, US Treasuries | ●●● High |
| Thu, Oct 15 | Fed Chair Kevin Warsh speaks (evening, New York time) | USD Index, XAU/USD, US 500 | ●● Medium |
Instant Access to Global Markets with RoboForex MobileTrader
Everything you need for successful trading in one app: currencies, metals, oil, stocks, indices.
13
Oct
Employment Change (Thu, Oct 15), Forecast
+20.0K
Previous
+39.5K
Unemployment Rate, Forecast
4.6%
Previous
4.6%
Why It Matters
The Reserve Bank of Australia raised the cash rate by 25 basis points to 4.60% on September 29, its highest level since 2011 and the fourth hike of 2026, in a unanimous 9 to 0 vote. The board left the door open to further increases, citing higher energy prices and persistent inflation. Tuesday's minutes show how ready the board is to move again, and Thursday's jobs data shows whether the economy has room for another step. At the press conference, the message was that further hikes may not be needed if inflation declines.
Market Reaction
Minutes that signal readiness for another hike, together with employment above +20,000 and unemployment at or below 4.6%, would support AUD/USD and Australian bond yields. A signal of a pause and weak jobs data would weigh on the Australian dollar.
Market Sentiment
We see a moderately positive backdrop for the Australian dollar: after the hike, the board kept the door open to another move, and the minutes are likely to confirm that. On the daily chart, AUD/USD trades around 0.6978 after a rebound from the lower boundary of a triangle pattern. Despite the correction, price stays above the 285-period EMA, a sign that buyers are still present. The stochastic has dropped into oversold, which points to a possible resumption of growth. A breakout above the upper boundary of the descending channel and a hold above 0.7005 would be the signal for the bullish scenario, with a target at 0.7140. A break below the lower boundary of the triangle and a hold below 0.6875 would increase pressure from sellers.
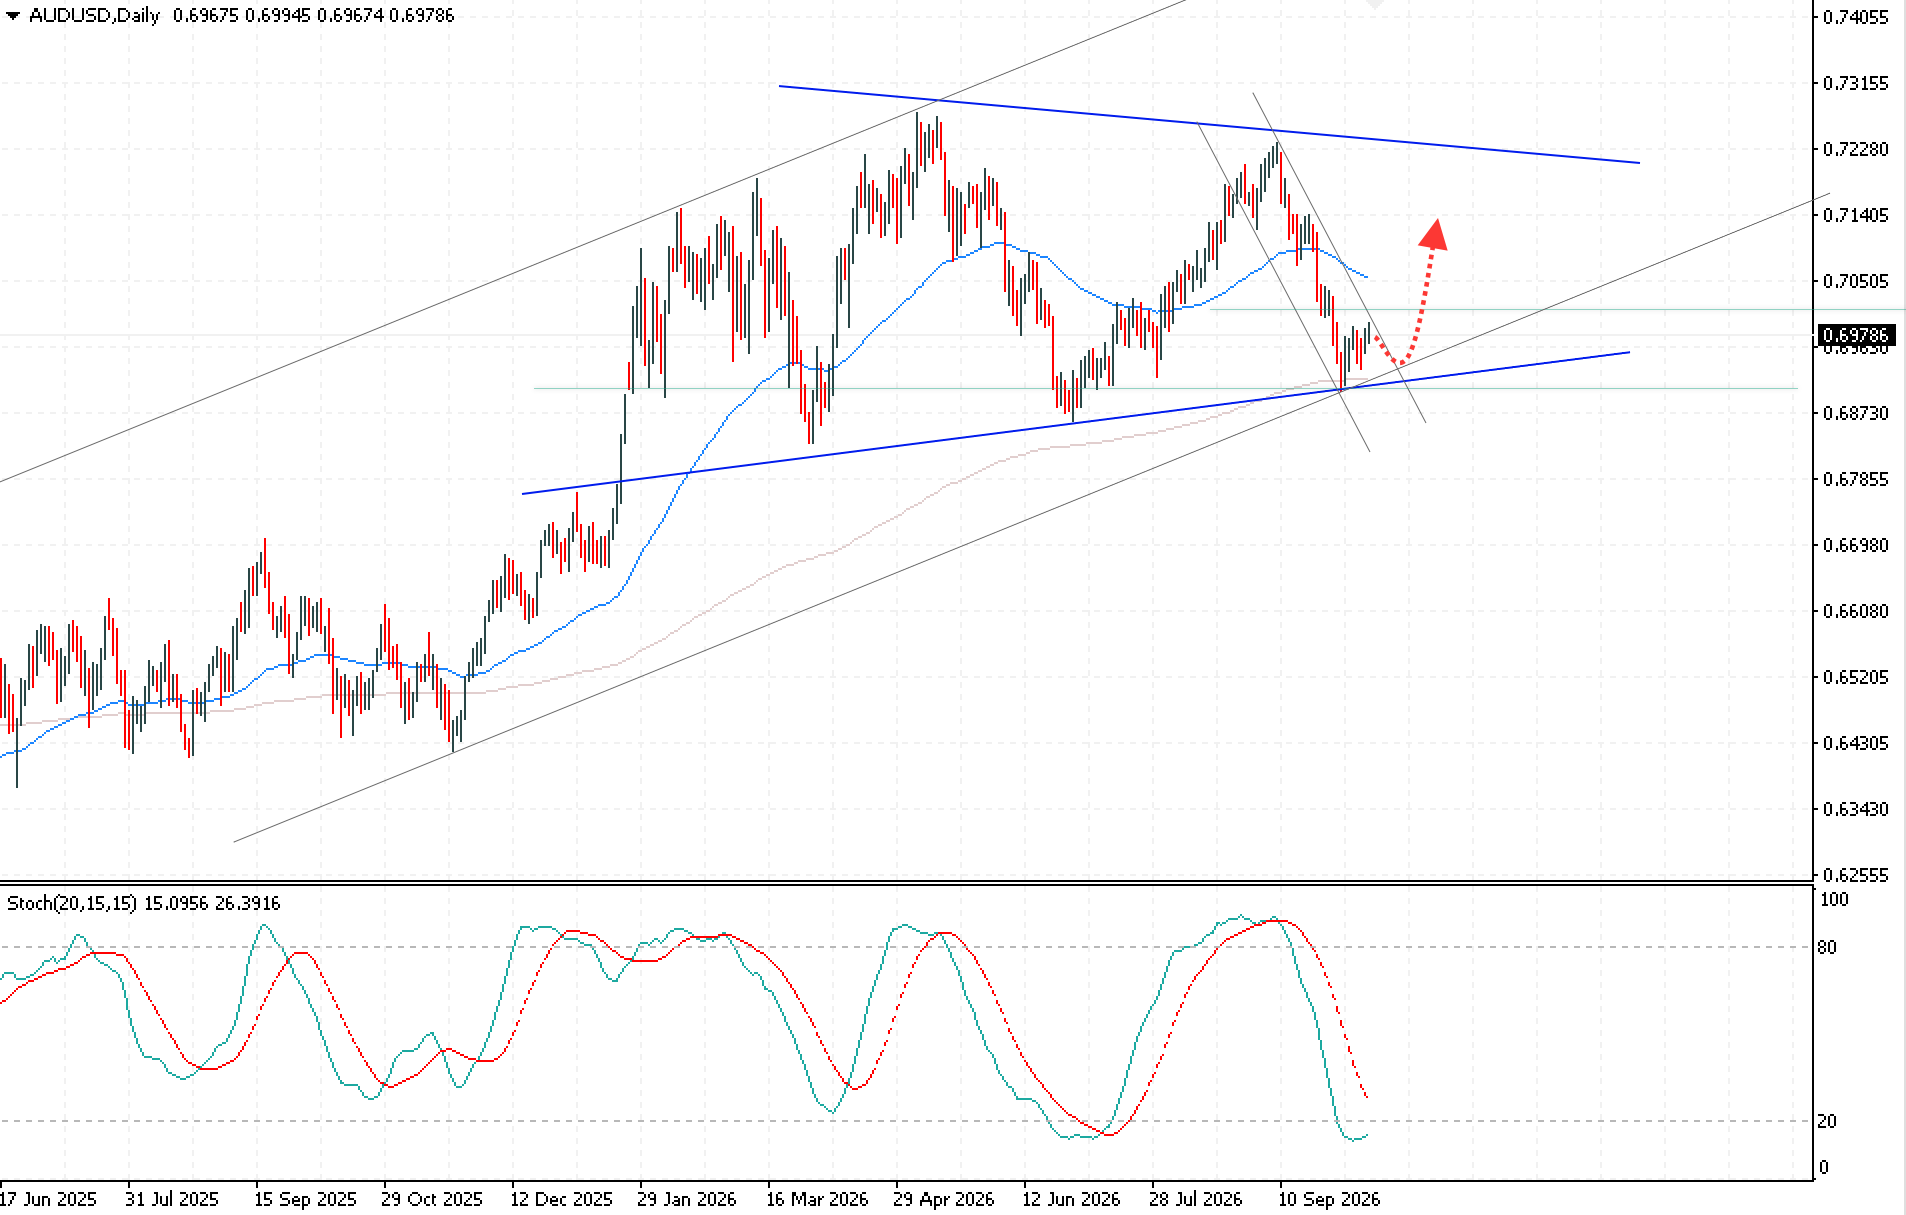
Key Levels and Trade Parameters — AUD/USD
| Parameter | Value |
|---|---|
| Resistance | 0.7005 / 0.7140 |
| Support | 0.6950 / 0.6875 |
| Entry, Buy Stop | 0.7005 |
| Stop loss | 0.6950 |
| Take profit | 0.7140 |
| Risk to reward | 1:2.5 |
14
Oct
CPI y/y, Forecast
3.6%
Previous
3.4%
Core CPI y/y, Forecast
2.5%
Previous
2.4%
Why It Matters
This is the last CPI report before the Fed decision on October 28, and the market is sensitive to it: the odds of an October hike fell to about one in four after the weak jobs report and can change quickly. Analysts link the expected jump in headline inflation, +0.6% month on month against 0.4%, to record gasoline prices in September. That puts the focus on core CPI, which rose at its fastest pace in four months in August. The forecast is for core to slow to 0.2% month on month while the annual rate edges up to 2.5%.
Market Reaction
Core CPI above the forecast would bring an October hike closer, lift Treasury yields and the USD Index, and weigh on gold and US 500. A reading in line with expectations would give a short and mixed reaction. Core CPI below the forecast would cut the odds of an October hike, pull yields and the dollar lower and support gold and stocks.
Market Sentiment
We stay neutral on gold ahead of the release. Headline inflation is likely to come in high because of gasoline, so the core figure will decide the move. Gold gained 1.34% last week as yields eased. On the daily chart, XAU/USD trades around 4,183 USD after another rebound from the rising trendline, which acts as dynamic support. Despite pressure from sellers, the potential for a further rise remains. The stochastic has reached oversold and its lines are close to a bullish crossover. A breakout above the upper boundary of the descending channel and a hold above 4,255 USD would signal the end of the correction and the start of an upward impulse toward 4,525 USD. A break below the lower boundary of the medium-term channel and a hold below 4,105 USD would cancel the bullish scenario.
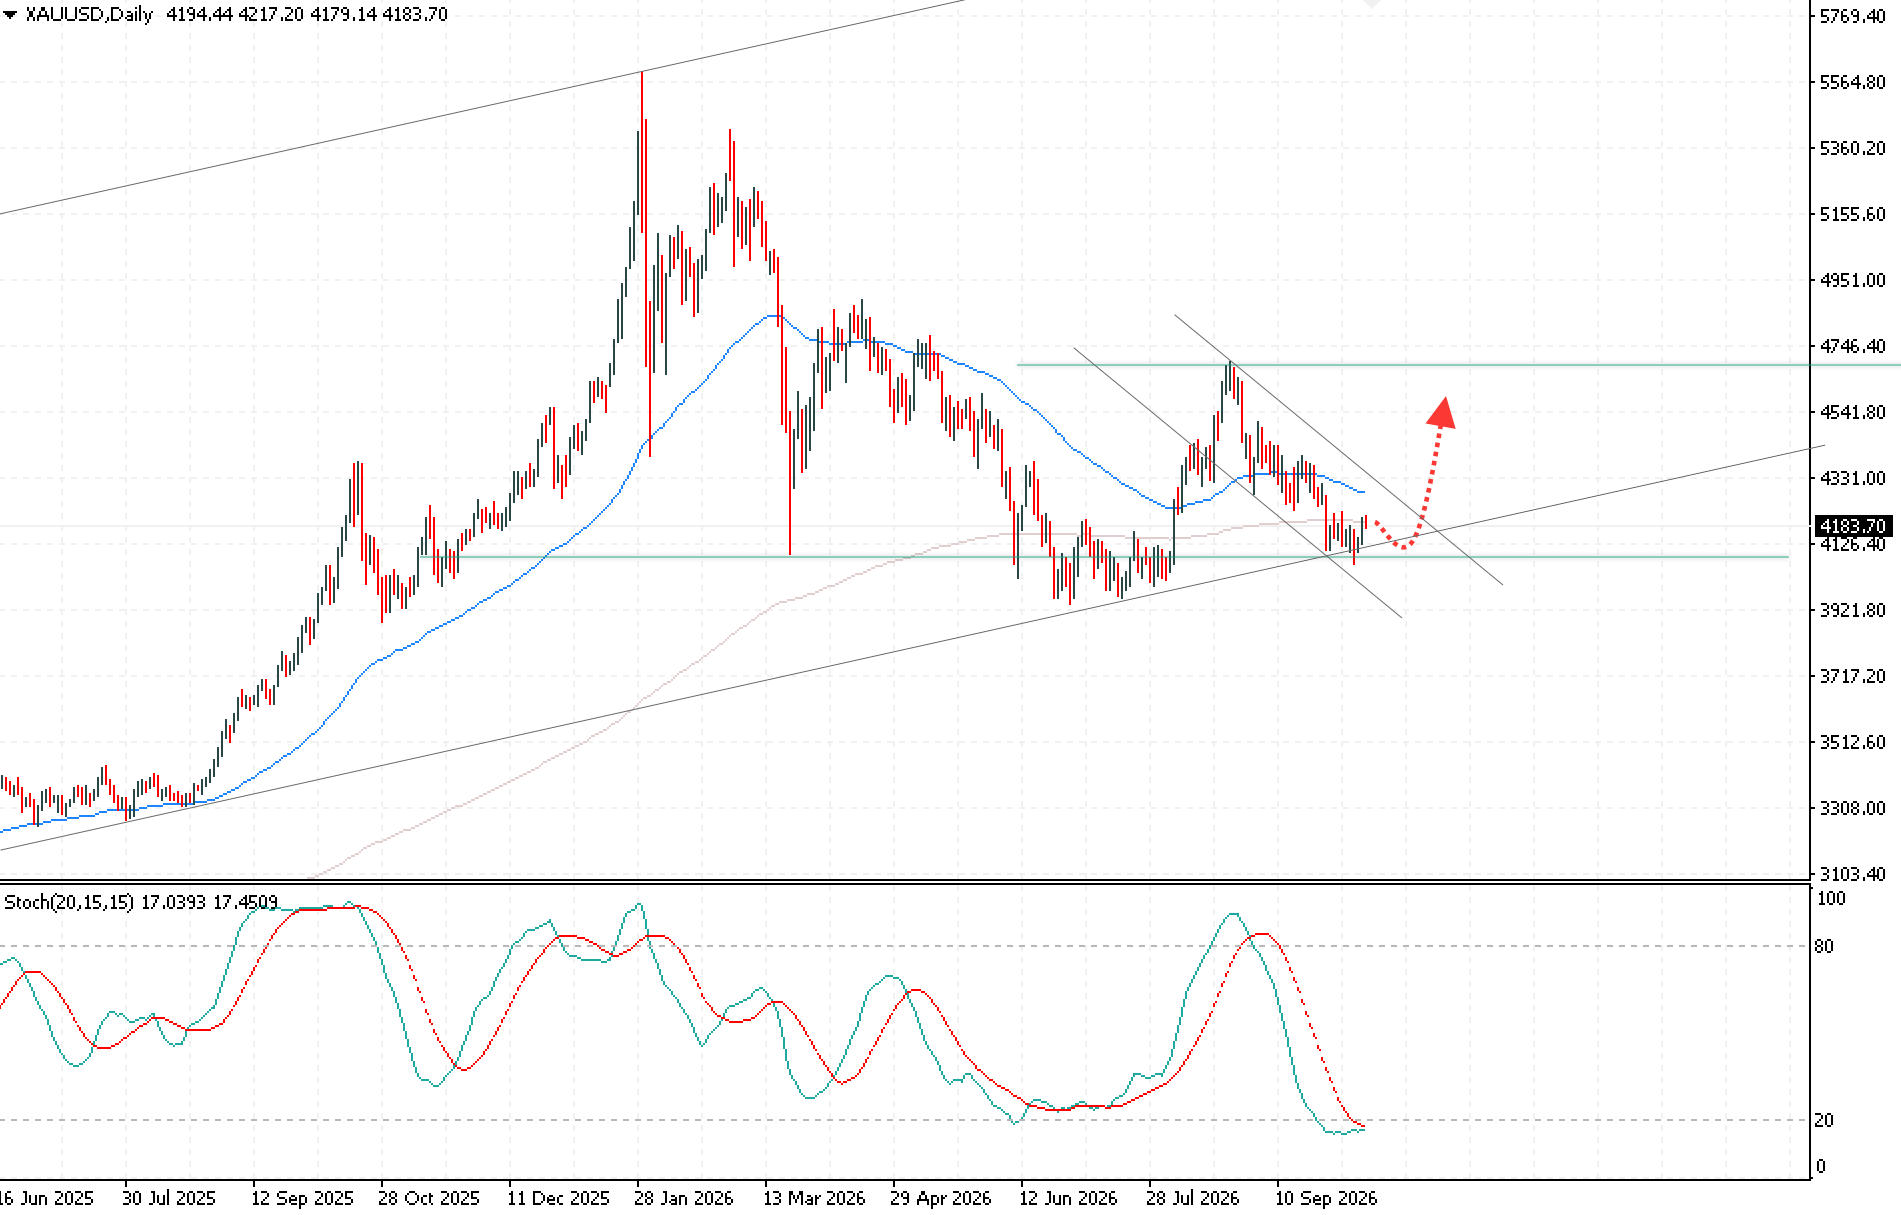
Key Levels and Trade Parameters — XAU/USD
| Parameter | Value |
|---|---|
| Resistance | 4255 / 4525 |
| Support | 4105 |
| Entry, Buy Stop | 4255 |
| Stop loss | 4205 |
| Take profit | 4525 |
| Risk to reward | 1:5.4 |
15
Oct
GDP m/m, Forecast
Not published
Previous (July)
+0.4%
Why It Matters
No consensus had formed at the time of writing, and estimates range from flat growth to a 0.4% decline after a strong July. Analysts expect part of July's growth, which came from more volatile industries, to reverse in August. The Bank of England is still in tightening mode: Monetary Policy Committee member Megan Greene has called for a rate hike, and Governor Andrew Bailey speaks on Wednesday and Thursday. Greene's call keeps a hike at one of the last two meetings of 2026 in play, and a weak August figure would test that case.
Market Reaction
A marked decline would raise doubts about a hike and weigh on the pound. Flat growth or a small gain would support GBP/USD and gilt yields.
Market Sentiment
We are neutral on the pound: weak growth figures stand against talk of a rate hike, and GBP/USD barely moved last week. On the H4 chart, GBP/USD trades around 1.3257 and has stayed inside a narrow range for 12 sessions in a row. Buyers are trying to hold above the 65-period EMA, which could set up a test of the upper boundary of the range at 1.3285. A breakout above that resistance would strengthen the bulls and open the way to further gains toward 1.3405. The stochastic is rising after it left oversold earlier in the range, which supports the upward scenario. A break below the lower boundary of the range and a hold below 1.3190 would cancel the bullish case and point to a return of the downtrend.
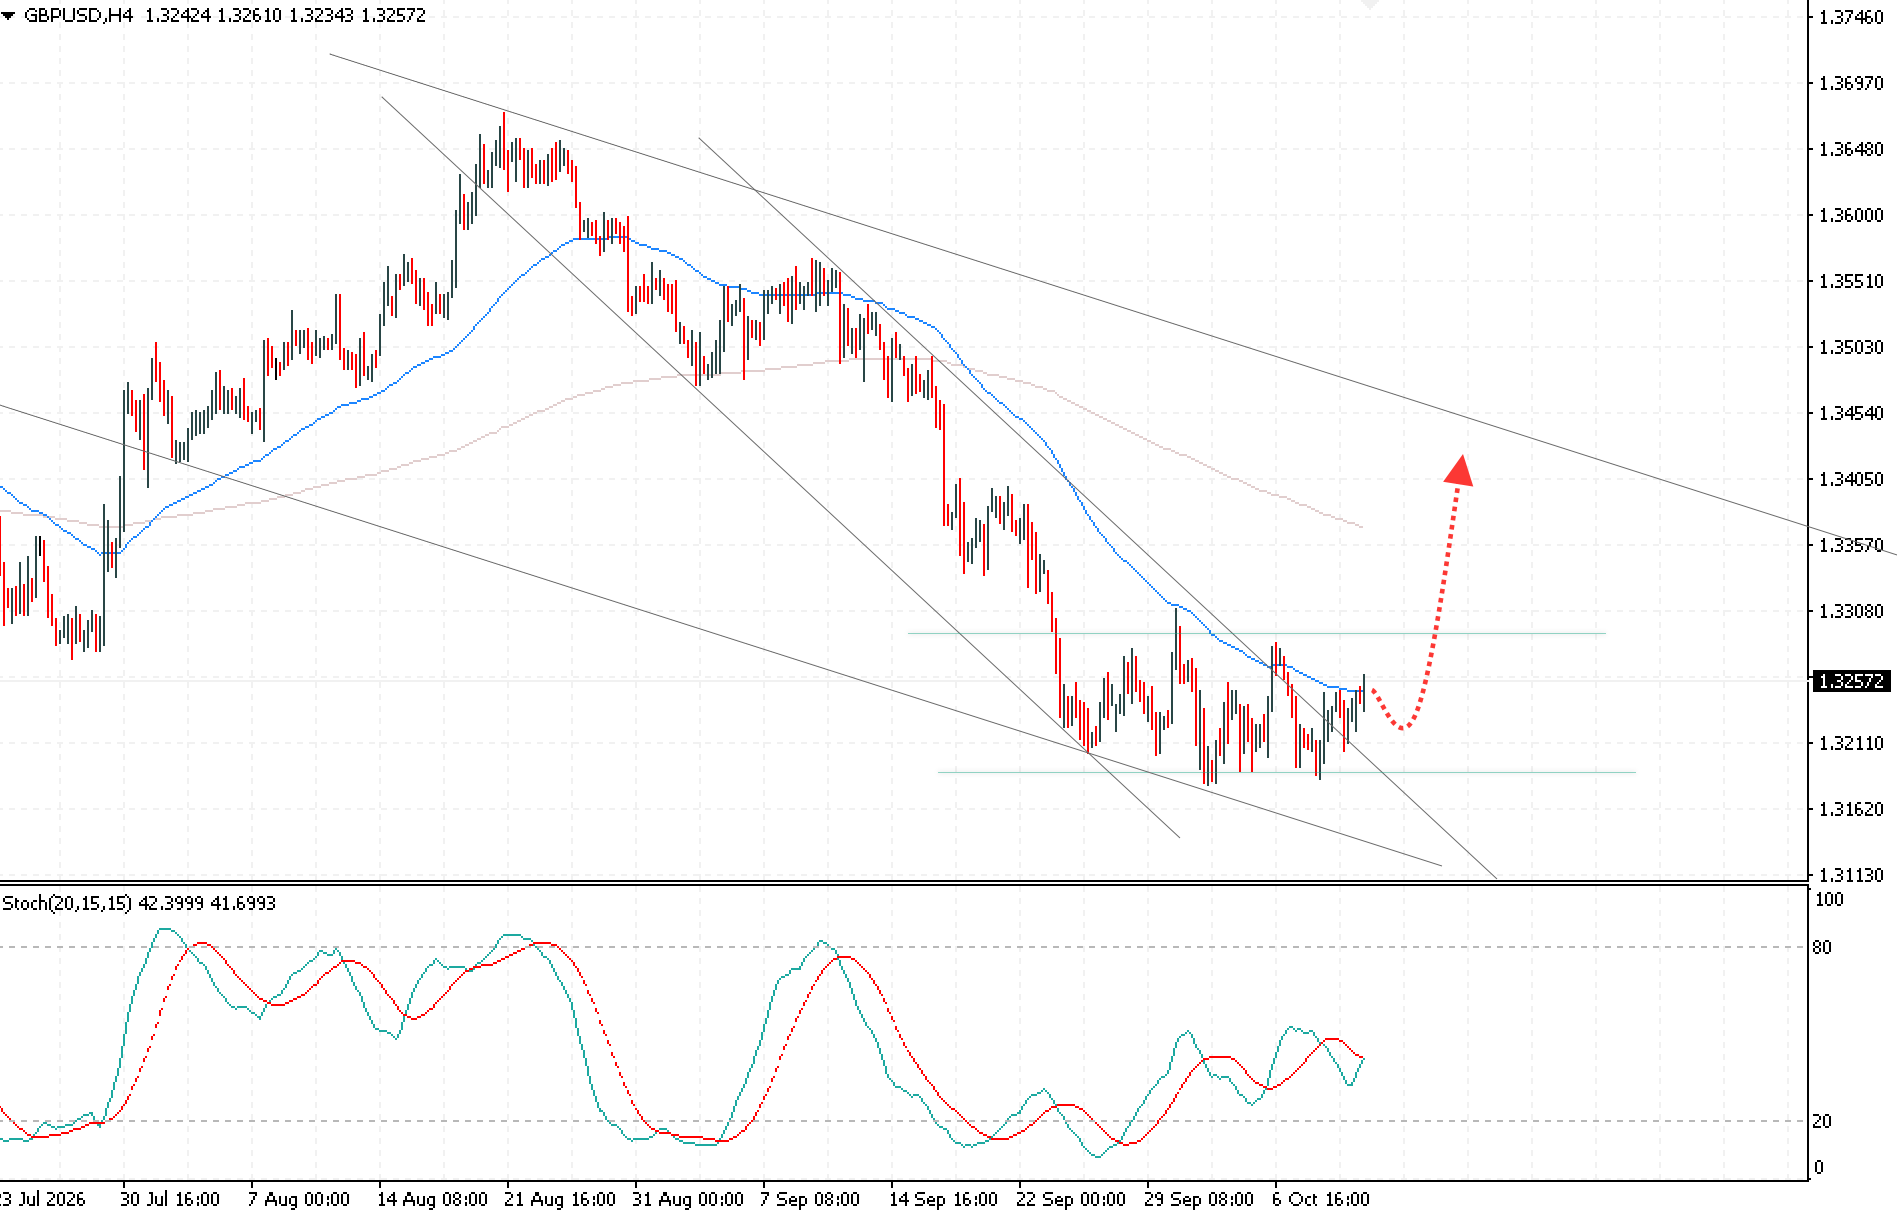
Key Levels and Trade Parameters — GBP/USD
| Parameter | Value |
|---|---|
| Resistance | 1.3285 / 1.3405 |
| Support | 1.3245 / 1.3190 |
| Entry, Buy Stop | 1.3285 |
| Stop loss | 1.3245 |
| Take profit | 1.3405 |
| Risk to reward | 1:3.0 |
15
Oct
Retail Sales m/m, Forecast
+0.3%
Previous
+1.2%
Retail Sales ex Autos m/m, Forecast
+0.5%
Previous
+1.4%
PPI m/m, Forecast
+0.5%
Previous
+0.4%
Why It Matters
After a strong August, sales are expected to slow. The retail sales report measures sales in current prices with no inflation adjustment, so part of any gain reflects higher prices. The Chicago Fed estimates sales excluding autos at +0.4%, slightly below the +0.5% consensus. PPI, out at the same time, completes the inflation picture one day after CPI, with the annual rate expected to ease to 5.3% from 5.4%. The earnings season runs in parallel: FactSet expects S&P 500 earnings per share to grow 29.5% year on year in the third quarter, against 26.7% in the second, while the financial sector is forecast at 3.0% with the sharpest margin decline of any sector.
Market Reaction
Sales and PPI above the forecast would keep yields and the dollar high, which weighs on US 500. Figures below the forecast would pull yields lower and raise questions about how long consumers and company earnings can hold up. Consumer sentiment has already dropped to 46.3, and weak sales would add to that signal.
Market Sentiment
Our view on US 500 is cautious: the index sits near record levels while yields stay at multi-year highs, so further upside depends on whether sales and bank earnings confirm that profits are holding up. On the H4 chart, US 500 trades around 7,834 and approaches local resistance. A rising wedge, a reversal pattern, is taking shape, and a break of its lower boundary could send the index down to 7,605. The stochastic has turned down from overbought and formed a bearish crossover, a sign that the market is ready for a correction. A break below the lower boundary of the wedge and a hold below 7,765 would confirm the decline. A confident break above local resistance at 7,905 would cancel the scenario.
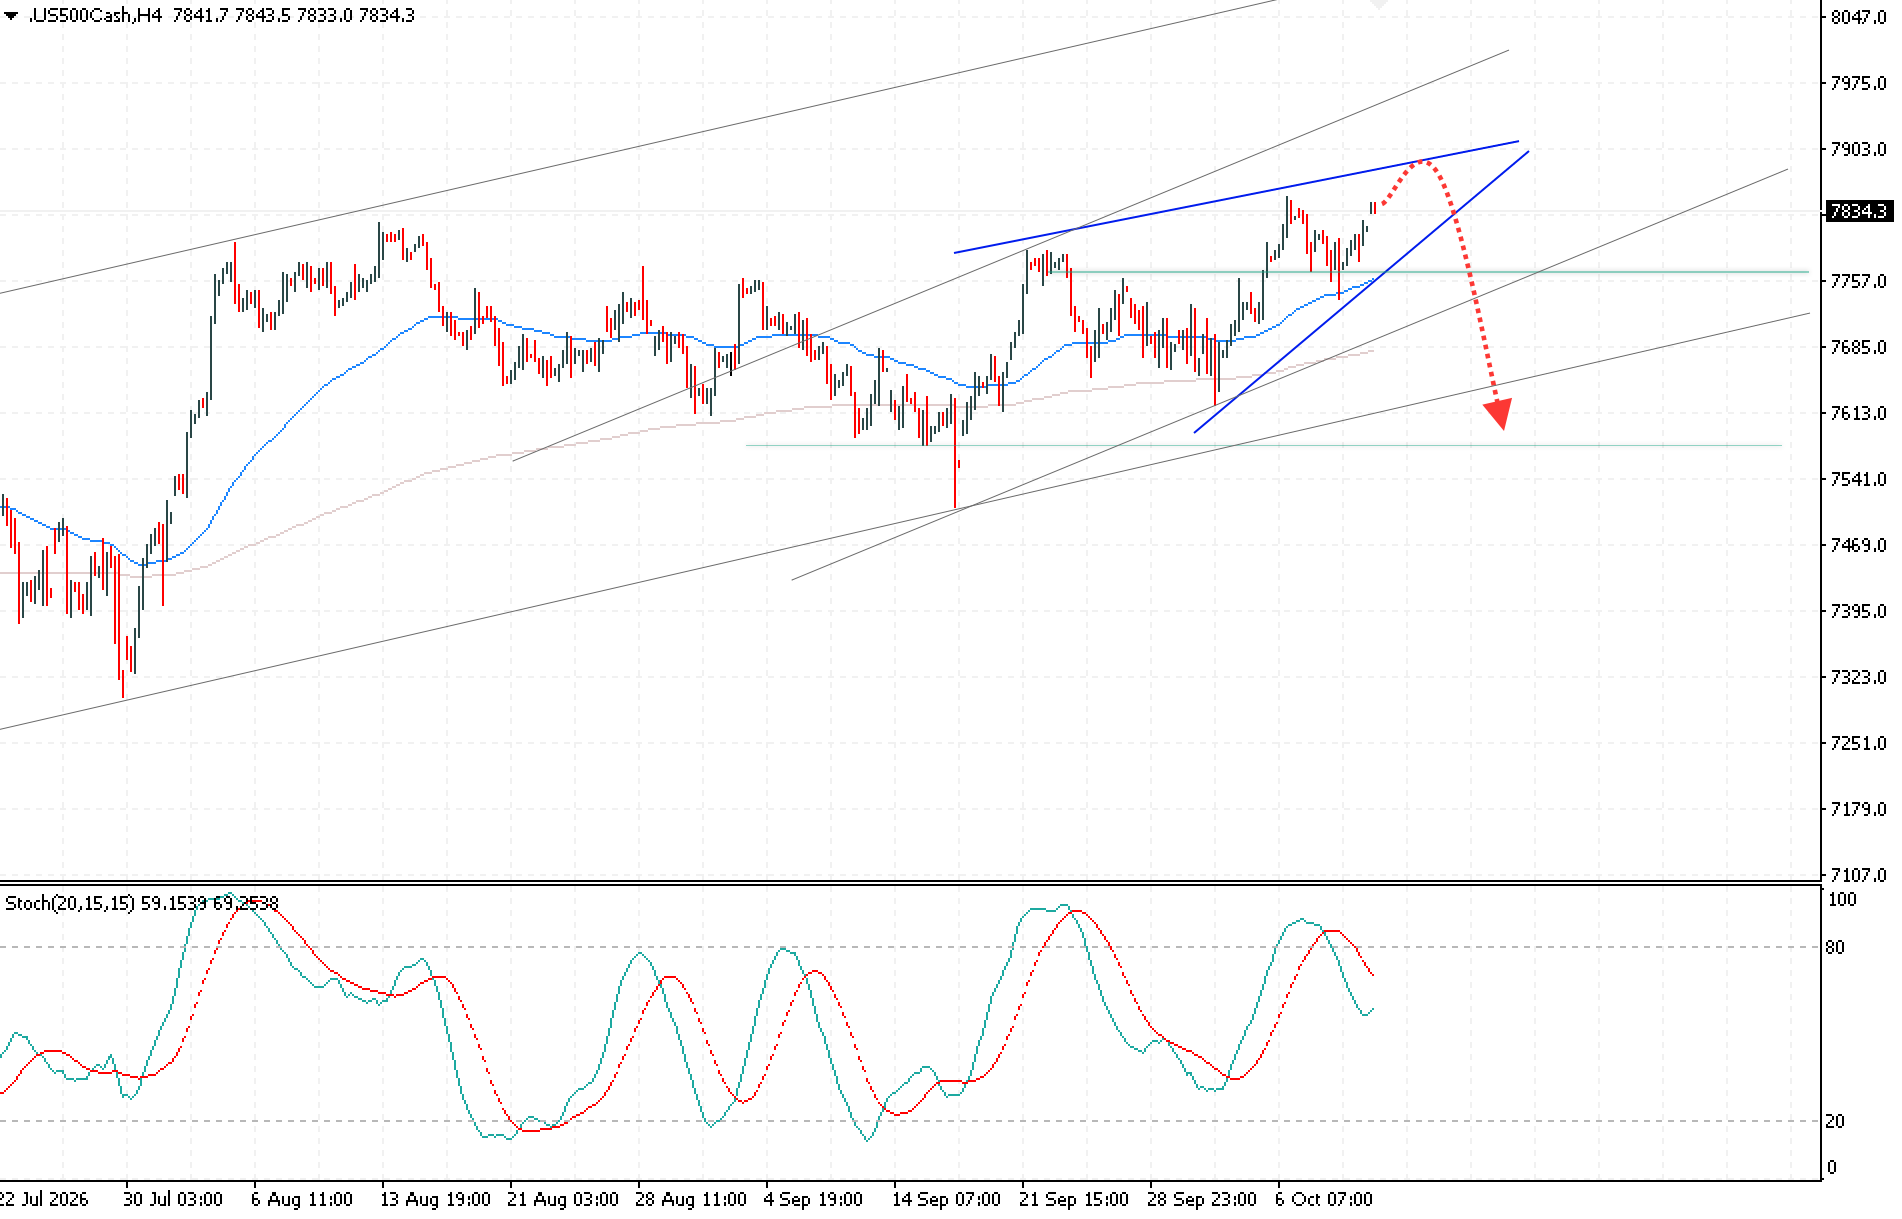
Key Levels and Trade Parameters — US 500
| Parameter | Value |
|---|---|
| Resistance | 7835 / 7905 |
| Support | 7765 / 7605 |
| Entry, Sell Stop | 7765 |
| Stop loss | 7835 |
| Take profit | 7605 |
| Risk to reward | 1:2.3 |
What Else to Watch
Central bank speakers fill the gaps between releases. ECB President Christine Lagarde speaks on Tuesday evening and again on Wednesday, Bank of England Governor Andrew Bailey on Wednesday and Thursday, and Fed Chair Kevin Warsh late on Thursday, New York time, after the CPI, PPI and retail sales figures are out. His comments will show how the Fed reads the week's data ahead of the October 28 decision. Morgan Stanley and Bank of America report earnings on Wednesday, after JPMorgan, Goldman Sachs, Citigroup and Wells Fargo on Tuesday.
Track the forecast and the actual figure for each release, since the gap between consensus and the outcome is what tends to move prices the most. Learn more about how to read the economic calendar and trade the news.
Conclusion
The week comes down to one question: will the data shift expectations for the Fed decision on October 28? A soft core CPI on Wednesday would support gold, and a hold above 4,255 USD opens the way to 4,525 USD, while a hot reading keeps 4,105 USD in focus. Thursday's retail sales report and PPI then test US 500: a hold below 7,765 would confirm a correction toward 7,605, and a break above 7,905 cancels it.
Australia and the UK add their own tests. RBA minutes that keep the door open to another hike, together with solid jobs data, would support a move in AUD/USD above 0.7005 toward 0.7140. For GBP/USD, a UK GDP reading near zero could help the pair break 1.3285 and head for 1.3405, while a hold below 1.3190 would cancel the idea.
FAQ
When is the US retail sales report released?
The US Census Bureau publishes the advance retail sales report around the middle of each month at 8:30 a.m. Eastern Time. The September report comes out on Thursday, October 15, 2026, together with the PPI.
Is the retail sales report adjusted for inflation?
No. Retail sales are seasonally adjusted and measured in current prices, so higher prices lift the headline figure even when volumes stay flat. Traders read the report together with CPI and PPI for that reason.
Does the retail sales report include autos?
Yes, the headline figure includes motor vehicles and parts. Retail sales excluding autos removes them, since car sales swing sharply from month to month, and gives a steadier picture of consumer spending.
What time is the US CPI report released?
The Bureau of Labor Statistics releases CPI at 8:30 a.m. Eastern Time. The September figures come out on Wednesday, October 14, 2026, the last CPI report before the Fed decision on October 28.
How can the retail sales report move US 500?
Strong sales support company earnings, yet in a week of high Treasury yields they can also lift expectations of another Fed hike, which weighs on stocks. Weak sales lower yields and raise doubts about consumer demand. The net effect depends on how far the figures land from the forecast.
Any forecasts contained herein are based on the author's independent analysis and reflect their personal opinion. These articles should not be construed as trading recommendations or a call to action. The authors and RoboForex accept no responsibility for the results of any trades made on the basis of these recommendations and reviews. Past performance is not indicative of future results. Trading stocks and CFDs involves a high risk of capital loss.