Gold Fed Rate Hike Bets: XAUUSD Forecast and a 4,772 USD Target

Gold Fed rate hike bets have been the single biggest weight on the metal all year, and over one week in August that weight came off. US payrolls fell by 23,000 in July when the market was looking for a gain of about 80,000, and consumer price inflation then slowed to 3.4%. The implied odds of a September rate increase have dropped to around 40%, from roughly two thirds at the start of the month. Gold has recovered more than 430 USD from its June low and now trades at 4,373 USD, just under the 200-day moving average it lost in June.
In Brief
- US payrolls fell 23,000 in July, and the two previous months were revised down by 103,000 between them.
- July consumer price inflation then slowed to 3.4%, with core inflation at 2.5%.
- Market-implied odds of a September Federal Reserve rate increase have fallen to about 40%, from roughly two thirds at the start of August.
- Gold pays no interest, so pricing a rate increase back out of the curve removes a direct cost of holding it.
- On the daily chart, gold spent six weeks building a base between 3,942 and 4,203 USD and broke out of it on 5 August.
- The trade idea is a buy limit at 4,300 USD, with the 200-day moving average at 4,501 USD as the first target and 4,772 USD as the second.
Trade Idea Parameters
Below are the specific parameters for the gold trade idea. The ticker for trading via RoboForex MobileTrader and MT5 on RoboForex is XAUUSD.
| Parameter | Value |
|---|---|
| Instrument | Gold Spot / US Dollar (XAUUSD) |
| Ticker in MobileTrader / MT5 | XAUUSD |
| Idea Date | August 13, 2026 |
| Price at the time of writing | 4,373.59 USD |
| Time Horizon | 1 to 3 months |
| Direction | ↑ Buy (Long) |
| Entry Level (buy limit) | 4,300.00 USD |
| Take Profit 1 | 4,501.00 USD · +4.7% |
| Take Profit 2 | 4,772.00 USD · +11.0% |
| Stop Loss | 4,140.00 USD · −3.7% |
| Position Size | No more than 3% of account · Medium risk |
The entry sits below the market at the time of writing, and the pullback toward it is already under way. That is deliberate, and the technical section explains why chasing this move near 4,400 USD is the weaker version of the same idea.
Instant Access to Global Markets with RoboForex MobileTrader
The July Jobs Report That Repriced the Fed
The US Bureau of Labor Statistics reported on 7 August 2026 that nonfarm payrolls fell by 23,000 in July. The market had been looking for a gain of about 80,000, so the miss was worth more than 100,000 jobs on its own. The revisions did more damage than the headline. May was cut by 66,000 to a gain of 63,000, and June was cut by 37,000 to a gain of 20,000.
Put together, the American economy added 103,000 fewer jobs over May and June than the market believed it had a month earlier. The three-month average rate of hiring dropped to 20,000 a month, down from 77,000 as of the June report.
US nonfarm payrolls, monthly change in thousands of jobs, before and after the 7 August revisions
May 2026, as first reported
+129
May 2026, after revision
+63
June 2026, as first reported
+57
June 2026, after revision
+20
July 2026, market expectation
+80
July 2026, reported
−23
103,000 jobs removed from May and June combined by the revisions
20,000 a month is the three-month average rate of hiring now, down from 77,000
A labour market shedding jobs is a difficult backdrop for a central bank that is thinking about raising rates. Kevin Warsh, who became chair of the Federal Reserve on 13 May 2026, has spent his first months in the job saying that prices are too high and that the Fed will deliver price stability. The July meeting on 29 July held the federal funds rate at 3.50 to 3.75%, and through the first week of August the market read the next move as more likely up than sideways.
The jobs report broke that reading. Fed funds futures cut the implied probability of a 25 basis point increase at the September meeting to 44.0%, from 54.7% before the release. At the start of the month the same probability had been running near two thirds.
Five days later the inflation data pushed in the same direction. The consumer price index for July, published on 12 August, rose 0.1% on the month and 3.4% over the year, down from 3.5% in June. Core inflation, which strips out food and energy, rose 0.2% on the month for an annual rate of 2.5%, also down a tenth. Every one of those readings matched the consensus forecast.
Inflation that is easing on its own is the argument against moving in September, and the market took it. The implied probability of a rate increase has since slipped to around 40%, which leaves roughly a 60% chance the Federal Reserve holds. Gold rose 0.9% on the day to close at 4,408.52 USD, its highest close in two months.
Market-implied probability of a 25 basis point Fed rate increase in September 2026
54.7%
Before the jobs report
7 August
7 August
44.0%
After the jobs report
7 August
7 August
40.1%
After the inflation data
12 August
12 August
14.6 points of rate increase priced out of the September meeting inside one week
More than 430 USD recovered by the gold price from its June low over the same stretch
Why an Interest Rate Decision Moves the Gold Price
Gold pays nothing. It has no coupon, no dividend and no interest. Holding an ounce of it means giving up whatever a US Treasury bill would have paid over the same period, and that forgone yield is the real cost of owning the metal.
When a central bank raises rates, or when the market starts to believe it will, that cost goes up and gold becomes a more expensive asset to sit on. A rate increase usually strengthens the dollar as well, which makes gold more expensive for every buyer outside the United States. Both effects push in the same direction, and both of them ran against gold for most of 2026.
The reverse is what happened in the second week of August. Roughly fifteen points of rate increase came out of the September meeting across the two releases, the dollar index fell to a two-week low, and the yield on the 10-year Treasury note came off. The cost of holding gold dropped, and the metal rose 2.41% on the payrolls day alone.
This is the fundamental support underneath the trade idea. It is worth being precise about what it covers. Two data releases do not end a policy cycle. They change the odds attached to one meeting, and those odds can change back. The idea below is built on the technical structure, and the rate repricing is the reason that structure is being tested now.
What Central Banks Did While the Price Was Falling
Gold reached an all-time high of 5,602.23 USD on 29 January 2026 and then gave back a large part of the previous year's gain. The average LBMA price for the second quarter came in at 4,506 USD, about 14% below where the quarter started.
Official buyers used the fall. The World Gold Council recorded net central bank purchases of 289 tonnes in the second quarter of 2026, up 62% on the same quarter a year earlier and the strongest second quarter in its data series. Exchange traded funds went the other way and shed 45 tonnes globally over the same three months, with Asian funds taking in money while North American ones sold.
That divergence says something useful about who is doing what. The money that trades on the interest rate outlook left through the ETFs. The money that buys reserves on a multi-year view bought more as the price got cheaper. For this trade idea the central bank number is background and a floor argument, and it carries no timing information at all. Nobody should buy gold this month because a central bank bought some last quarter.
Open a Trading Account at RoboForex
Swap-free accounts, spreads from 0, and execution in 0.01 seconds.
XAUUSD Technical Analysis: the Base and the 200-Day Line
The chart comes down to one line and one base.
Gold lost its 200-day moving average on 5 June, closing at 4,328 USD. That was its first close below the line since October 2023, and the market read it as the end of the uptrend. The price fell to 3,942 USD by the end of the month.
Then it stopped falling. For six weeks gold traded sideways between 3,942 and 4,203 USD, with a second low at 3,960 USD on 17 July, within 18 USD of the first. Two lows at the same price mean the sellers have run out of room. On 5 August gold broke out of the top of that range in one session, and the payrolls report two days later turned the breakout into a trend.
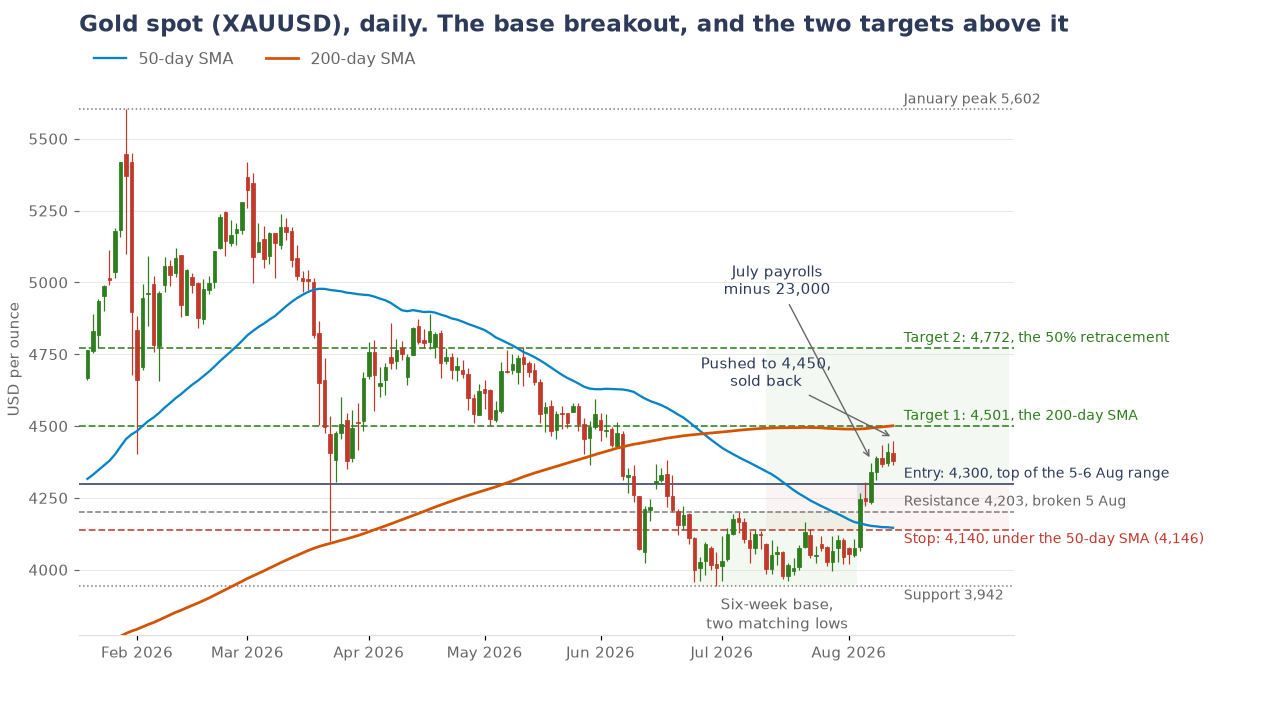
Two levels sit overhead, and they are the two targets. The first is the 200-day average at 4,501 USD, the line gold lost in June. The second is 4,772 USD, the halfway point of the fall from 5,602 USD in January to 3,942 USD in June.
The entry waits for 4,300 USD instead of buying here, because the recovery has run a long way in a short time. Gold reached 4,449.83 USD on the morning of 13 August and was sold straight back to 4,373 USD, the first real selling since the breakout. The 4,300 USD level is the top of the narrow range gold held on 5 and 6 August, right after it broke out, with a high of 4,304 USD and a low of 4,224 USD. Price coming back to test the ground it broke through is the normal way a breakout continues, and that range is the ground.
- The base between 3,942 and 4,203 USD held for six weeks on two lows 18 USD apart, then broke upward on 5 August. That is the signal.
- The first target is 4,501 USD, the 200-day moving average gold lost in June.
- The second target is 4,772 USD, the halfway mark of the fall from January to June.
- The entry is 4,300 USD, the top of the two-day range gold held right after the breakout, because the rally is stretched.
- A daily close below 4,220 USD cancels the setup.
Sample Trading Strategy for Gold
Below is a sample trading strategy for XAUUSD. This example is for educational purposes only and does not constitute investment advice. Traders should assess their own risk tolerance independently.
| Parameter | Value |
|---|---|
| Entry Point | Buy limit at 4,300.00 USD, on a pullback into the 5 to 6 August breakout range |
| Take Profit 1 | The 200-day moving average at 4,501.00 USD, +4.7% |
| Take Profit 2 | The 50% retracement at 4,772.00 USD, +11.0% |
| Stop Loss | 4,140.00 USD, below the 50-day moving average, −3.7% |
| Risk / Reward Ratio | 1 : 2.9 to the second target |
| Position Size | No more than 3% of account |
Sample Calculation for 0.1 Lot of XAUUSD
Gold is traded in lots. One standard lot of XAUUSD is 100 ounces, so every 1 USD the price moves is worth 100 USD on a full lot. The example below uses 0.1 lot, a size most retail accounts can carry, where each 1 USD of price movement is worth 10 USD.
| Scenario | Calculation | Result |
|---|---|---|
| Buy 0.1 lot at 4,300.00 USD | 0.1 × 100 × 4,300.00 USD | 43,000 USD position value |
| If the first target is reached (4,501.00 USD) | (4,501.00 − 4,300.00) × 10 | +2,010 USD (+4.7%) |
| If the second target is reached (4,772.00 USD) | (4,772.00 − 4,300.00) × 10 | +4,720 USD (+11.0%) |
| If the stop is triggered (4,140.00 USD) | (4,300.00 − 4,140.00) × 10 | −1,600 USD (−3.7%) |
| Risk / Reward to the second target | 1,600 / 4,720 | 1 : 2.9 |
The percentages are calculated on the full 43,000 USD value of the position. Gold is traded with leverage, which scales both the profit and the loss against the money actually deposited. At 1:20 leverage that 0.1 lot needs 2,150 USD of margin, and the 1,600 USD loss is then 74% of the margin posted instead of 3.7% of the position value. Size the position against the account balance, not against the margin requirement.
A common way to handle two targets is to close part of the position at the first one and move the stop to the entry price, which takes the risk off the table and leaves the rest running toward the second. The idea can also be traded to the first target alone, at 4.7% and a risk/reward of 1:1.3.
When This Idea Stops Being Valid
Three conditions end it.
- The pullback never comes. Gold is above the entry as this is written, and a market this strong can turn back up without offering the full retest. The buy limit at 4,300 USD is then never filled and the idea expires unused. That is a missed opportunity and it costs nothing.
- A daily close below 4,220 USD. That is the floor of the range gold held on 5 and 6 August, which had a low of 4,224 USD. Closing under it means the breakout has failed and the price is heading back toward resistance at 4,203 USD, the level it broke through. The stop-loss at 4,140 USD sits a further 80 USD down, under the 50-day moving average at 4,146 USD, so it triggers on a confirmed failure and not on one bad session.
- The rate outlook turns back around. The fundamental support for this idea is a September rate increase being priced out. Data that puts it back in reverses that support directly, whatever the chart is doing.
The third condition has a date on it, and it is the next section.
Trade with RoboForex MobileTrader
Live charts, deposits and withdrawals, analytics and copy trading, all in one app.
What Could Still Put the Rate Increase Back On
The inflation print on 12 August was the big scheduled risk to this idea and it passed on the friendly side. That does not clear the calendar. Producer prices for July are published on 13 August and retail sales on 14 August, and both feed the same question about how much heat is left in the American economy.
The larger risk sits in energy. The July energy index fell 1.5% on the month, but it is still 14.7% higher than a year earlier, and that is the piece of inflation a central bank cannot do much about. The war with Iran shows no sign of ending, and the market is watching traffic through the Strait of Hormuz. An oil shock would push headline inflation back up and hand the Federal Reserve its argument for moving in September, and the roughly 40% probability would start climbing back toward two thirds.
Kevin Warsh has also given the market no reason to assume he is finished. He has held rates all year while saying prices are too high, and one soft month of data does not settle that. The 16 September decision is the event this idea is held into.
This is why the entry is a limit order below the market instead of a position opened at the current price. An order at 4,300 USD that has not yet filled carries no exposure to any of it. If the data runs hot and gold sells off into the entry with the trend structure still intact, the order fills at a better price. If gold turns back up first, the trade is missed and nothing is lost.
Where This Leaves the Gold Price
Gold spent the first half of 2026 falling because the market kept adding to the chance of a Federal Reserve rate increase. In July the American economy stopped adding jobs, in August inflation slowed, and the market started taking that increase back out. The metal has recovered more than 430 USD from its June low and now sits underneath the last two moving averages it has yet to reclaim.
The structure is a clean base breakout with two objectives above it, the 200-day line at 4,501 USD and the halfway mark of the January decline at 4,772 USD. It ran hard to get here, and this morning it was turned back at 4,450 USD, which is the reason to wait for a price instead of paying the current one. Central bank buying of 289 tonnes in the second quarter says the long-term bid is still there, and it says nothing about the next three weeks.
For traders, the actionable number is 4,300 USD: a pullback into that level activates the long scenario toward 4,501 USD and then 4,772 USD, and a daily close below 4,220 USD cancels the setup and puts gold back inside the range it broke out of.
FAQ
What triggers this gold trade idea?
A pullback to 4,300 USD. The idea uses a buy limit order at that price, which is the top of the narrow range gold held on 5 and 6 August immediately after breaking out of its base. A breakout that comes back to test the ground it cleared is the normal pattern. If gold never trades back down to it, the order is never filled.
Why do Fed rate hike bets move the gold price?
Gold pays no interest, so holding it means giving up the yield a Treasury bill would have paid. A higher policy rate raises that cost and usually strengthens the dollar, which makes gold more expensive for buyers outside the United States. When the market prices a rate increase back out, as it did across 7 and 12 August 2026, both of those pressures ease at once.
Where do the 4,501 USD and 4,772 USD targets come from?
The first is the 200-day simple moving average on the daily XAUUSD chart as of 13 August 2026. Gold closed below it on 5 June for the first time since October 2023 and has not reclaimed it since. That average moves every day, so the exact number drifts. The second is the 50% retracement of the fall from 5,602 USD in January to 3,942 USD in June, which puts it at 4,772 USD. That one is measured from two fixed prices and does not move.
How much can this gold trade idea make?
From the 4,300 USD entry, the first target at 4,501 USD is 4.7% and the second at 4,772 USD is 11.0%. On 0.1 lot, which is 10 ounces and 43,000 USD of position value, that is 2,010 USD and 4,720 USD. The stop at 4,140 USD risks 1,600 USD, for a risk/reward of 1:2.9 to the second target. These are worked examples on the levels in the article, and not a forecast of what the market will do.
When does this gold idea stop being valid?
On a daily close below 4,220 USD, which puts the price back inside the range it broke out of and under both 200-day averages. The stop-loss sits at 4,140 USD, below the 50-day simple average. The idea also weakens if US data comes in hot enough to put a September rate increase back into the curve, with energy prices the most likely source of that.
How can I trade gold at RoboForex?
Gold trades under the ticker XAUUSD in MobileTrader and MT5. Both platforms support pending orders, which is what this idea needs, since the entry is a buy limit below the current market price.
* The information in this article reflects the personal opinions of the authors. It should not be construed as trading advice or a call to action. The authors and RoboForex bear no responsibility for trading results based on the recommendations and reviews contained in this material. Past performance is not a guarantee of future results. Trading commodities and CFDs involves a high risk of capital loss.