Market Week Ahead (August 31 – September 4): Non-Farm Payrolls Forecast Decides the Dollar's Course

August closed on a firm note for US stocks, carried by the first corporate reports of the season. Attention now swings back to the macro calendar, and the Non-Farm Payrolls forecast on Friday is what this week comes down to. Before it, the United States reports JOLTS job openings and the ISM Manufacturing PMI on Tuesday, Australia publishes second-quarter GDP on Wednesday, and the Bank of Canada announces its rate decision the same day.
Preliminary Eurozone inflation lands early in the week and sets expectations for the ECB's next moves. From there the focus is entirely on US statistics. Business activity indices, job openings and the labour market report together answer one question: is the economy slowing enough for the Federal Reserve to start cutting rates this autumn.
In Brief
- Eurozone Flash CPI (early in the week): the inflation read that shapes expectations ahead of the next ECB decisions.
- US JOLTS and ISM Manufacturing PMI (Tuesday, September 1): the first full look at labour demand and manufacturing before Friday.
- Australia GDP, Q2 (Wednesday, September 2): consensus sits at zero growth, and the result frames the RBA's room to ease.
- Bank of Canada Rate Decision (Wednesday, September 2): the rate is expected to hold at 2.25%, so the signal for the next meetings carries the weight.
- US Non-Farm Payrolls and Unemployment Rate (Friday, September 4): the Non-Farm Payrolls forecast of 125,000 jobs is the defining release for the dollar, the S&P 500 and gold.
Where the Market Stands Going Into the Week
July payrolls came in at 72,000, well under what the market had priced, and that single print is still setting the tone. It moved the argument about a September Fed cut from a possibility to a base case for a large part of the market. Friday's Non-Farm Payrolls forecast of 125,000 is the test of whether July was a one-off or the start of a genuine cooling in US hiring.
Tuesday builds the case in advance. JOLTS covers job openings through July, so it reads the same period the market is already arguing about, and the ISM Manufacturing PMI adds the industrial side at 55.0 against 55.6 last month. Both are expected to soften slightly. A soft pair on Tuesday followed by a soft payrolls number on Friday would be a consistent story, and the dollar would carry the cost of it.
Positioning raises the bar on both sides. EUR/USD rose sharply through the second half of August and is now holding its gains with weakening momentum. AUD/USD sits close to its August highs after a strong run. USD/CAD has been drifting lower since the middle of the month. Each of these pairs already prices a direction, so the data has to confirm that view to keep it going. That is why a merely adequate number carries as much risk of a reversal as a clear miss.
Key Events of the Week
| Date | Event | Instruments | Importance |
|---|---|---|---|
| Tue, Sep 1 | US JOLTS + ISM Manufacturing PMI | EUR/USD, USD Index, US Treasuries | ●● Medium |
| Wed, Sep 2 | Australia GDP, Q2 | AUD/USD, Australian bonds, Iron Ore | ●● Medium |
| Wed, Sep 2 | Bank of Canada Rate Decision | USD/CAD, Canadian bonds, Brent | ●●● High |
| Fri, Sep 4 | US Non-Farm Payrolls + Unemployment Rate | S&P 500, USD Index, Gold | ●●● High |
Instant Access to Global Markets with RoboForex MobileTrader
Everything you need for successful trading in one app: currencies, metals, oil, stocks, indices.
1
Sep
JOLTS Job Openings, July, Forecast
7.32M
Previous
7.36M
ISM Manufacturing PMI, August, Forecast
55.0
Previous
55.6
Why It Matters
Tuesday brings the first full assessment of the US economy before the employment report. JOLTS shows whether employer demand for workers is holding up, and the ISM index covers activity in manufacturing. After the weak Non-Farm Payrolls print of the previous month, any further sign of cooling would strengthen expectations of a near-term Fed rate cut.
Market Reaction
Weak JOLTS and ISM readings would put pressure on the dollar and lift EUR/USD, while US Treasury yields fall. Strong data would revive expectations of rates staying high for longer, supporting the US Dollar Index and sending the euro back toward support.
Market Sentiment
The market still counts on the Fed starting its easing cycle this autumn. That needs confirmation of a gradual cooling in the economy without a sharp deterioration in the labour market, which is a narrow path for the data to walk. On the chart, EUR/USD holds above 1.1580 after the sharp rise through the second half of August, though momentum is gradually weakening. MACD keeps its negative reading, while the stochastic sits near oversold territory and is starting to turn up. That combination leaves room for another attempt higher. Softer than expected US data would take the pair to resistance around 1.1690. Strong statistics would return quotes to support around 1.1560.
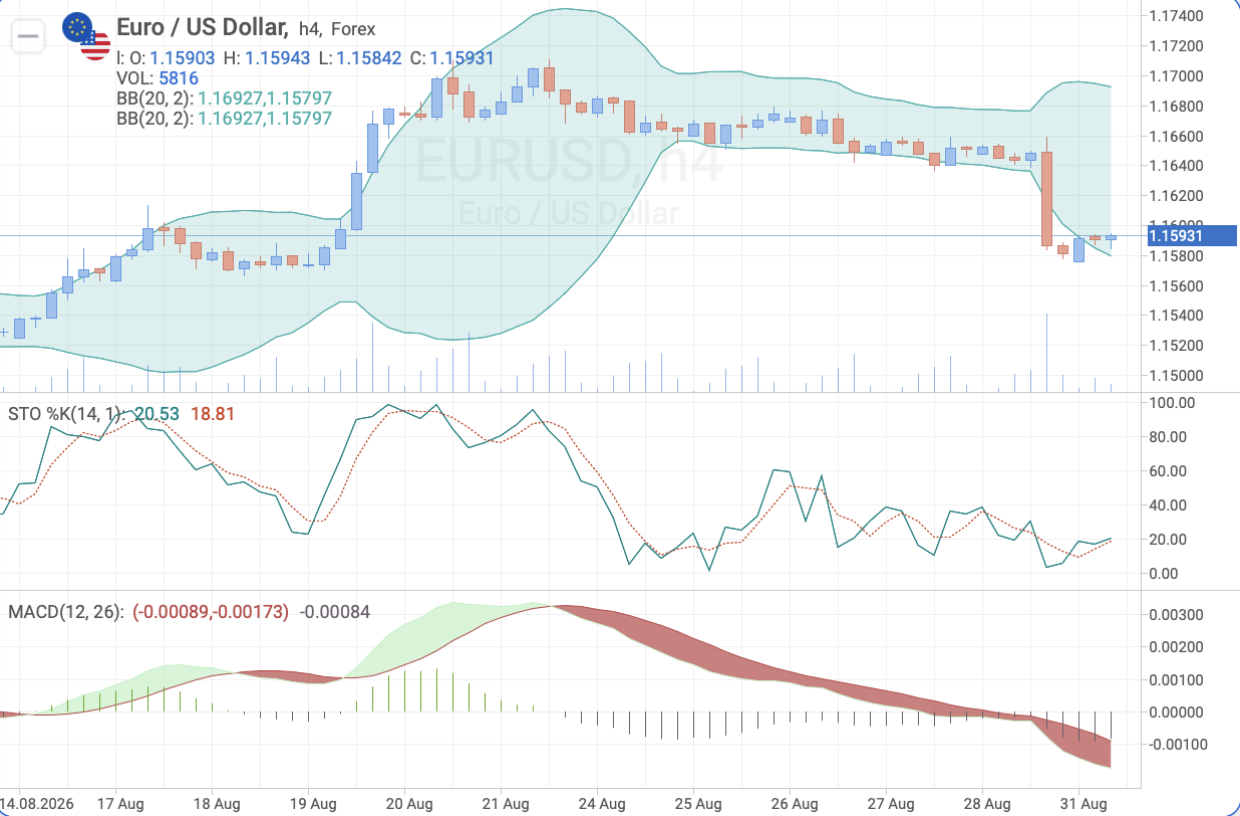
Key Levels and Trade Parameters — EUR/USD
| Parameter | Value |
|---|---|
| Resistance | 1.1690 |
| Support | 1.1580 / 1.1560 |
| Entry price | 1.1605 |
| Stop loss | 1.1555 |
| Take profit | 1.1690 |
| Risk | Medium |
2
Sep
GDP Growth Rate, Q2, Forecast (q/q)
0.0%
Previous
+0.3%
Why It Matters
The Australian economy has slowed over recent quarters under high interest rates and weak domestic demand. After the Reserve Bank of Australia held its cash rate, the open question is how much room is left for further policy easing. Wednesday's GDP release is one of the main reference points for the state of the economy at the start of the second half of the year, and a consensus of zero growth leaves little margin on the downside.
Market Reaction
A result under the flat consensus would widen expectations of RBA rate cuts and press AUD/USD lower, dragging Australian government bond yields with it. A print above zero would support demand for the Australian dollar and, by extension, iron ore and industrial metals.
Market Sentiment
Consensus on the Australian dollar stays moderately positive after the strong rise of recent weeks. Further gains would need confirmation that the economy is holding up, and a flat quarter is a thin argument for that. On the chart, AUD/USD trades around 0.7160 after a strong August advance and holds above the middle Bollinger band. Buyers recovered part of their position quickly following the sharp correction late last week. MACD continues to fall and the stochastic remains near oversold, pointing to the absence of a sustained upward impulse. GDP above consensus could return the pair to the August highs around 0.7200, while a weak figure widens the odds of a decline to support around 0.7120.
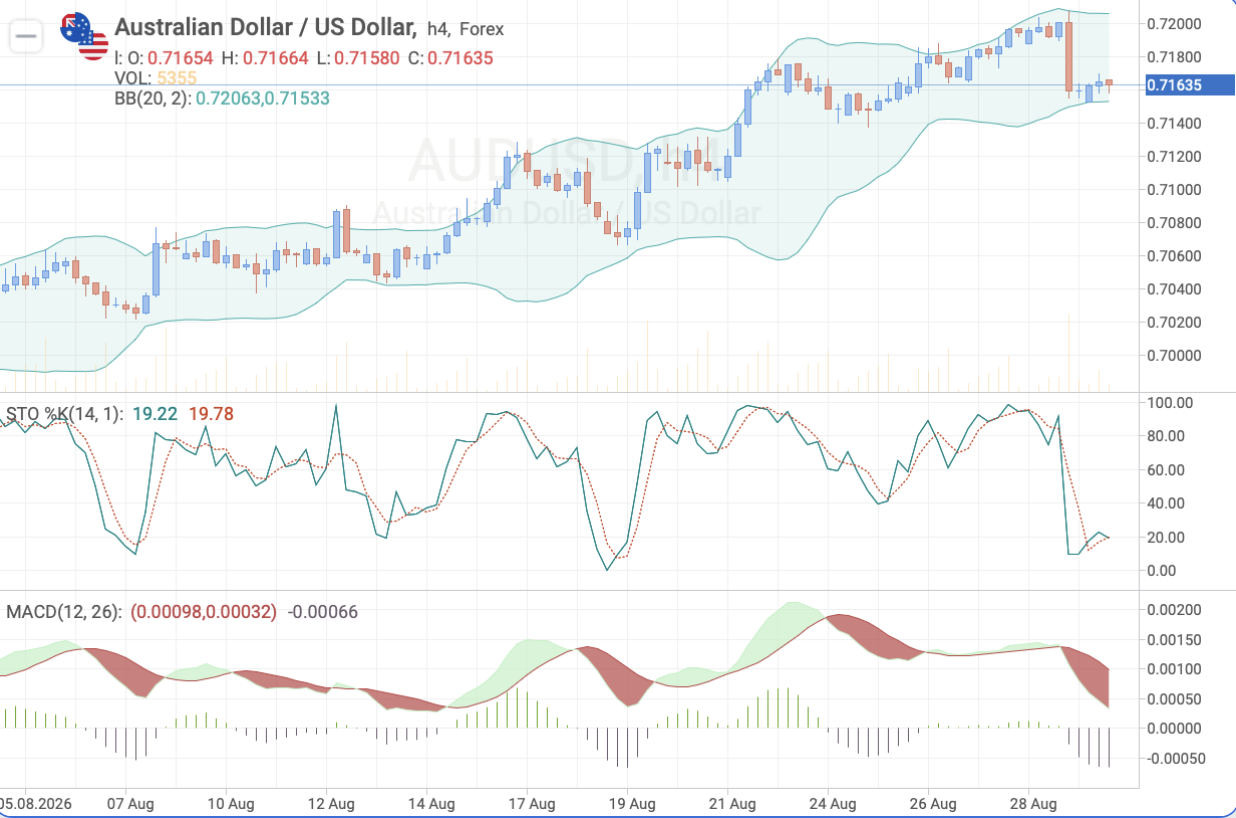
Key Levels and Trade Parameters — AUD/USD
| Parameter | Value |
|---|---|
| Resistance | 0.7200 |
| Support | 0.7120 |
| Entry price | 0.7170 |
| Stop loss | 0.7120 |
| Take profit | 0.7200 |
| Risk | Medium |
2
Sep
Interest Rate, Forecast
2.25%
Previous
2.25%
Why It Matters
Several cuts have brought the Bank of Canada to a neutral level of monetary policy. The regulator now has to decide whether inflation and economic activity have slowed enough to justify easing further. With the rate widely expected to hold, the market will read the accompanying statement and the leadership's comments on the economy and inflation for the real signal.
Market Reaction
A signal that the Bank of Canada is ready to resume cutting this autumn would put the Canadian dollar under pressure and lift USD/CAD off its lows, with Brent adding to the move if oil stays soft. More cautious wording would support the currency and send the pair toward 1.3830.
Market Sentiment
The base case is no change to the rate, which puts all the interest in the guidance for the next meetings. On the chart, USD/CAD continues to move inside a steady descending channel following the reversal in mid-August. Price holds below the middle Bollinger band, MACD is gradually recovering while staying close to neutral, and the stochastic turns down after an attempt higher. While quotes remain below resistance at 1.3910 to 1.3940, sellers keep the advantage. Soft signals from the Bank of Canada could support the pair temporarily. Firmer wording from the regulator could direct the move toward the 1.3830 area.
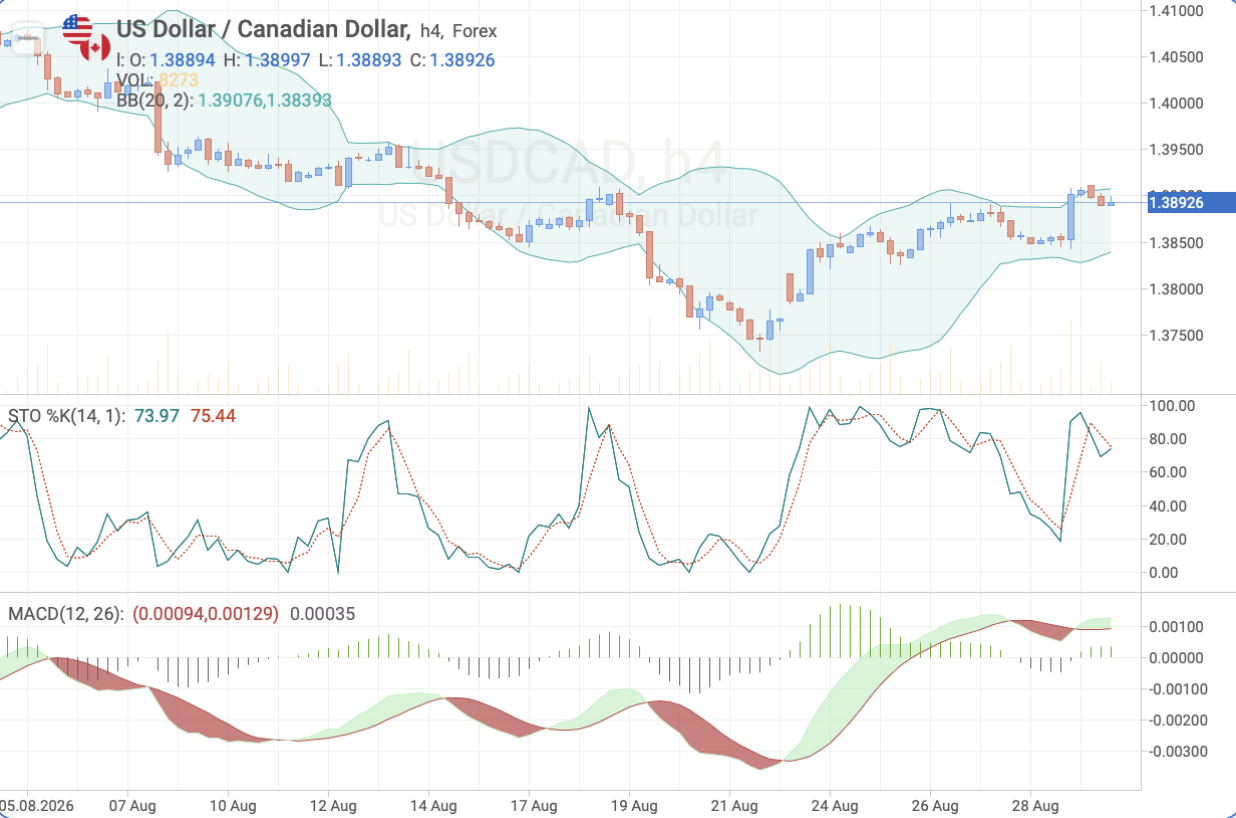
Key Levels and Trade Parameters — USD/CAD
| Parameter | Value |
|---|---|
| Resistance | 1.3910 / 1.3940 |
| Support | 1.3830 |
| Entry price | 1.3890 |
| Stop loss | 1.3940 |
| Take profit | 1.3830 |
| Risk | Medium |
4
Sep
Non-Farm Payrolls, August, Forecast
+125K
Previous
+72K
Unemployment Rate, Forecast
4.3%
Previous
4.3%
Why It Matters
The labour market report is the main macroeconomic event of the month and has a long record of moving currency and stock markets hard. After the unexpectedly weak July data, investors want an answer to one question: was the slowdown in hiring a single episode, or is the US economy genuinely starting to cool. The Non-Farm Payrolls forecast of 125,000 against a previous 72,000 is the exact figure that decides it. This release can settle expectations for the Fed's next decision on its own. If employment recovers, talk of a near-term cut gets quieter. If the labour market disappoints again, the probability of easing rises noticeably.
Market Reaction
A number at or above consensus would support the US Dollar Index and lift the S&P 500 on confirmation of economic resilience, while gold gives back ground. A second weak print in a row would push the dollar lower, send gold higher, and leave the S&P 500 caught between the prospect of cheaper money and the evidence of a slowing economy.
Market Sentiment
Consensus on the US economy stays cautiously positive. The base case is a recovery in new jobs after the weak July report, though confidence in the durability of the labour market is still missing, which is why the reaction could be unusually strong in either direction. On the chart, the S&P 500 trades around 7640 after recovering from the August lows and is testing the upper boundary of a short-term rising channel again. MACD keeps positive momentum, though its advance is gradually slowing. The stochastic sits in overbought territory, warning of the risk of a short-term correction. If the employment report confirms the resilience of the US economy, the index has a chance to extend the move toward 7750. Weaker data would trigger profit-taking and return quotes to support around 7560.
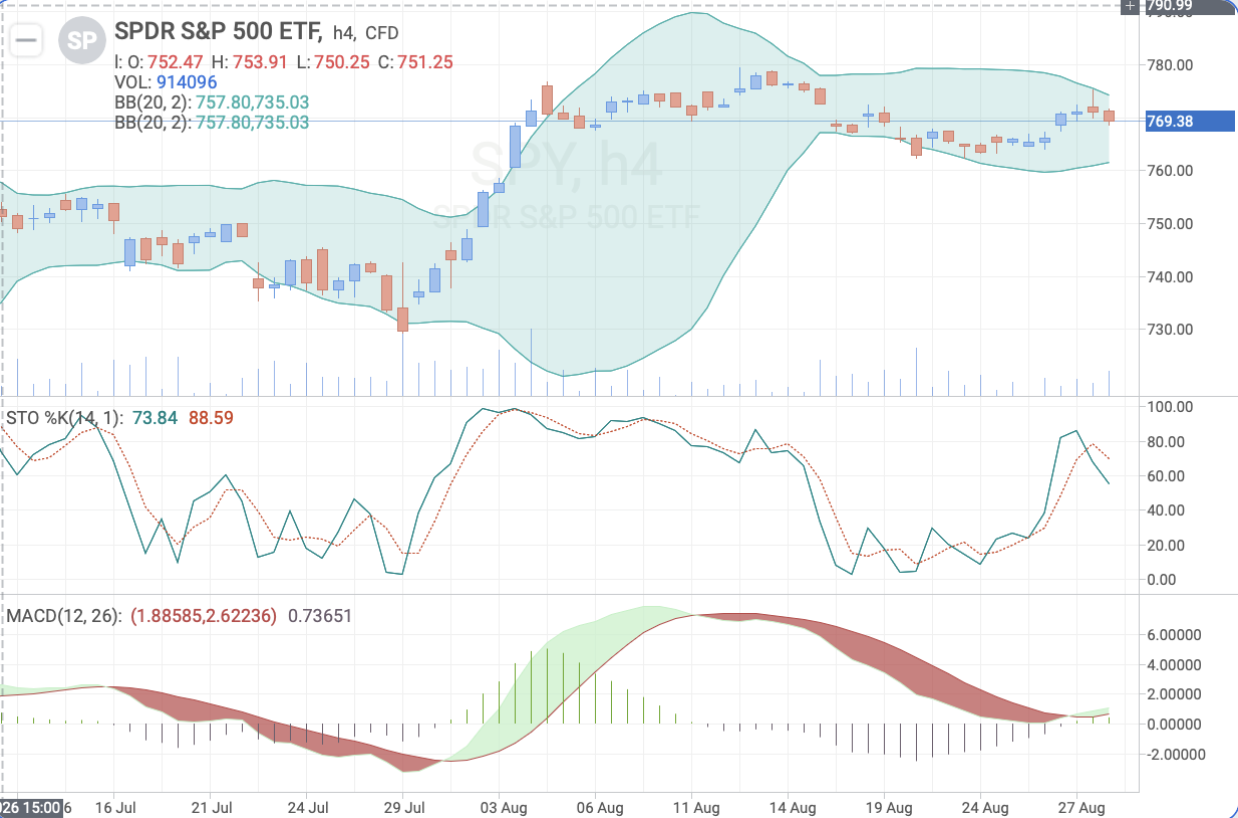
Key Levels and Trade Parameters — S&P 500
| Parameter | Value |
|---|---|
| Resistance | 7750 |
| Support | 7560 |
| Entry price | 7625 |
| Stop loss | 7560 |
| Take profit | 7750 |
| Risk | Medium |
Track the forecast and the actual figures for each release, since the gap between consensus and the outcome is what tends to move prices the most. Learn more about how to read the economic calendar and trade the news.
Conclusion
The week has a clear centre of gravity. Tuesday's JOLTS and ISM readings build the case, Wednesday adds Australian GDP and the Bank of Canada statement, and Friday's Non-Farm Payrolls forecast of 125,000 settles the argument about a September Fed cut. A print at or above that figure makes the case for an autumn move much harder to argue and gives the dollar room to recover, with the S&P 500 free to extend toward 7750.
A second weak payrolls number in a row would do the opposite. It would confirm July as the start of a trend, push expectations of Fed easing forward, and give EUR/USD a run at 1.1690 while the S&P 500 falls back to 7560. Wednesday decides the two smaller stories on its own: Australian GDP above the flat consensus keeps AUD/USD pointed at 0.7200, and cautious wording from the Bank of Canada opens the path to 1.3830 in USD/CAD.
Any information provided in articles on this website is based solely on the personal opinions of the authors. These articles should not be construed as trading recommendations or a call to action. The authors and RoboForex accept no responsibility for the results of any trades made on the basis of these recommendations and reviews. Past performance is not indicative of future results. Trading stocks and CFDs involves a high risk of capital loss.