Next CPI Report, China Trade and UK GDP: Market Week Ahead (November 9 – 13)
The next CPI report comes out on Tuesday, November 10, at 8:30 a.m. Eastern Time (13:30 GMT), when the US Bureau of Labor Statistics (BLS) publishes the October data. US consumer inflation for October is expected to hold at 3.7% year on year, while the monthly rise slows to 0.2% from 0.6%. Producer prices follow on Friday and complete the inflation picture. Between them come China's trade balance on Tuesday and the first estimate of UK GDP for the third quarter on Thursday. This issue covers AUD/USD, EUR/USD, BTC/USD, GBP/USD and US 500.
Stocks and Bitcoin closed last week near support, so the inflation data arrives with little cushion. Inflation figures will shape expectations for the next steps of the Federal Reserve (Fed), and with them the path of the dollar, bond yields, stocks and crypto.
Where the Market Stands Going Into the Week
Sellers held the upper hand last week. US 500 fell from the 7,700 to 7,750 area and closed near 7,382.9, close to the rising trendline around 7,330. Bitcoin extended its correction from the September high and ended near 75,811 USD. The dollar kept its edge: EUR/USD trades near 1.1137 and AUD/USD dropped to 0.6863 after a failed attempt to hold above 0.7030. GBP/USD gave back part of its recent rebound and sits near 1.3348.
US inflation links all five setups. A hot CPI or PPI print would back the dollar and weigh on stocks and Bitcoin, which already trade near support. Softer data would give room for technical rebounds. With most instruments sitting on key levels, the bar for a decisive break is low in both directions. All five charts below are daily, and all five setups run until November 13.
Key Events of the Week
| Date | Event | Instruments | Importance |
|---|---|---|---|
| Tue, Nov 10 | China trade balance (October) | AUD/USD | ●● Medium |
| Tue, Nov 10 | US consumer price index (October) | EUR/USD, BTC/USD, US 500 | ●●● High |
| Thu, Nov 12 | UK GDP, first estimate (Q3) | GBP/USD | ●●● High |
| Fri, Nov 13 | US producer price index (October) | US 500, US dollar | ●●● High |
Instant Access to Global Markets with RoboForex MobileTrader
Everything you need for successful trading in one app: currencies, metals, oil, stocks, indices.
10
Nov
Trade Balance (October), Forecast
135.0B USD
Previous
133.53B USD
Why It Matters
China is Australia's largest trading partner and one of the main buyers of Australian raw materials, so its trade data feeds straight into expectations for Australian exports, growth and the currency. The forecast calls for the surplus to widen to 135.0 billion USD from 133.53 billion. The source of the surplus matters as much as its size. A wider gap driven by strong exports would point to healthy external demand and improve sentiment toward Australian assets. If the surplus grows because imports are weak, the signal for Chinese demand turns soft, and the support for AUD/USD may stay limited.
Market Reaction
AUD/USD: signs of steady external demand in China could support the Australian dollar. Commodities: the data can shift expectations for demand for industrial metals. US dollar: weaker sentiment toward the Chinese economy could lift demand for safe-haven assets.
Market Sentiment
AUD/USD is bearish after a sharp drop from 0.7030 to about 0.6863. On the daily chart the price has broken below the lower Bollinger Band, which confirms strong downward momentum and also raises the odds of a short technical bounce. The MACD is negative, with the main line at -0.002106 below the signal line at -0.000703, so sellers lead. The stochastic sits at 15.56 and 17.48, both lines in the oversold zone. The setup is a sell after a hold below 0.6855, with a target at 0.6730. A return above 0.6910 cancels it, and a hold above 0.6920 would open a recovery toward 0.7000.
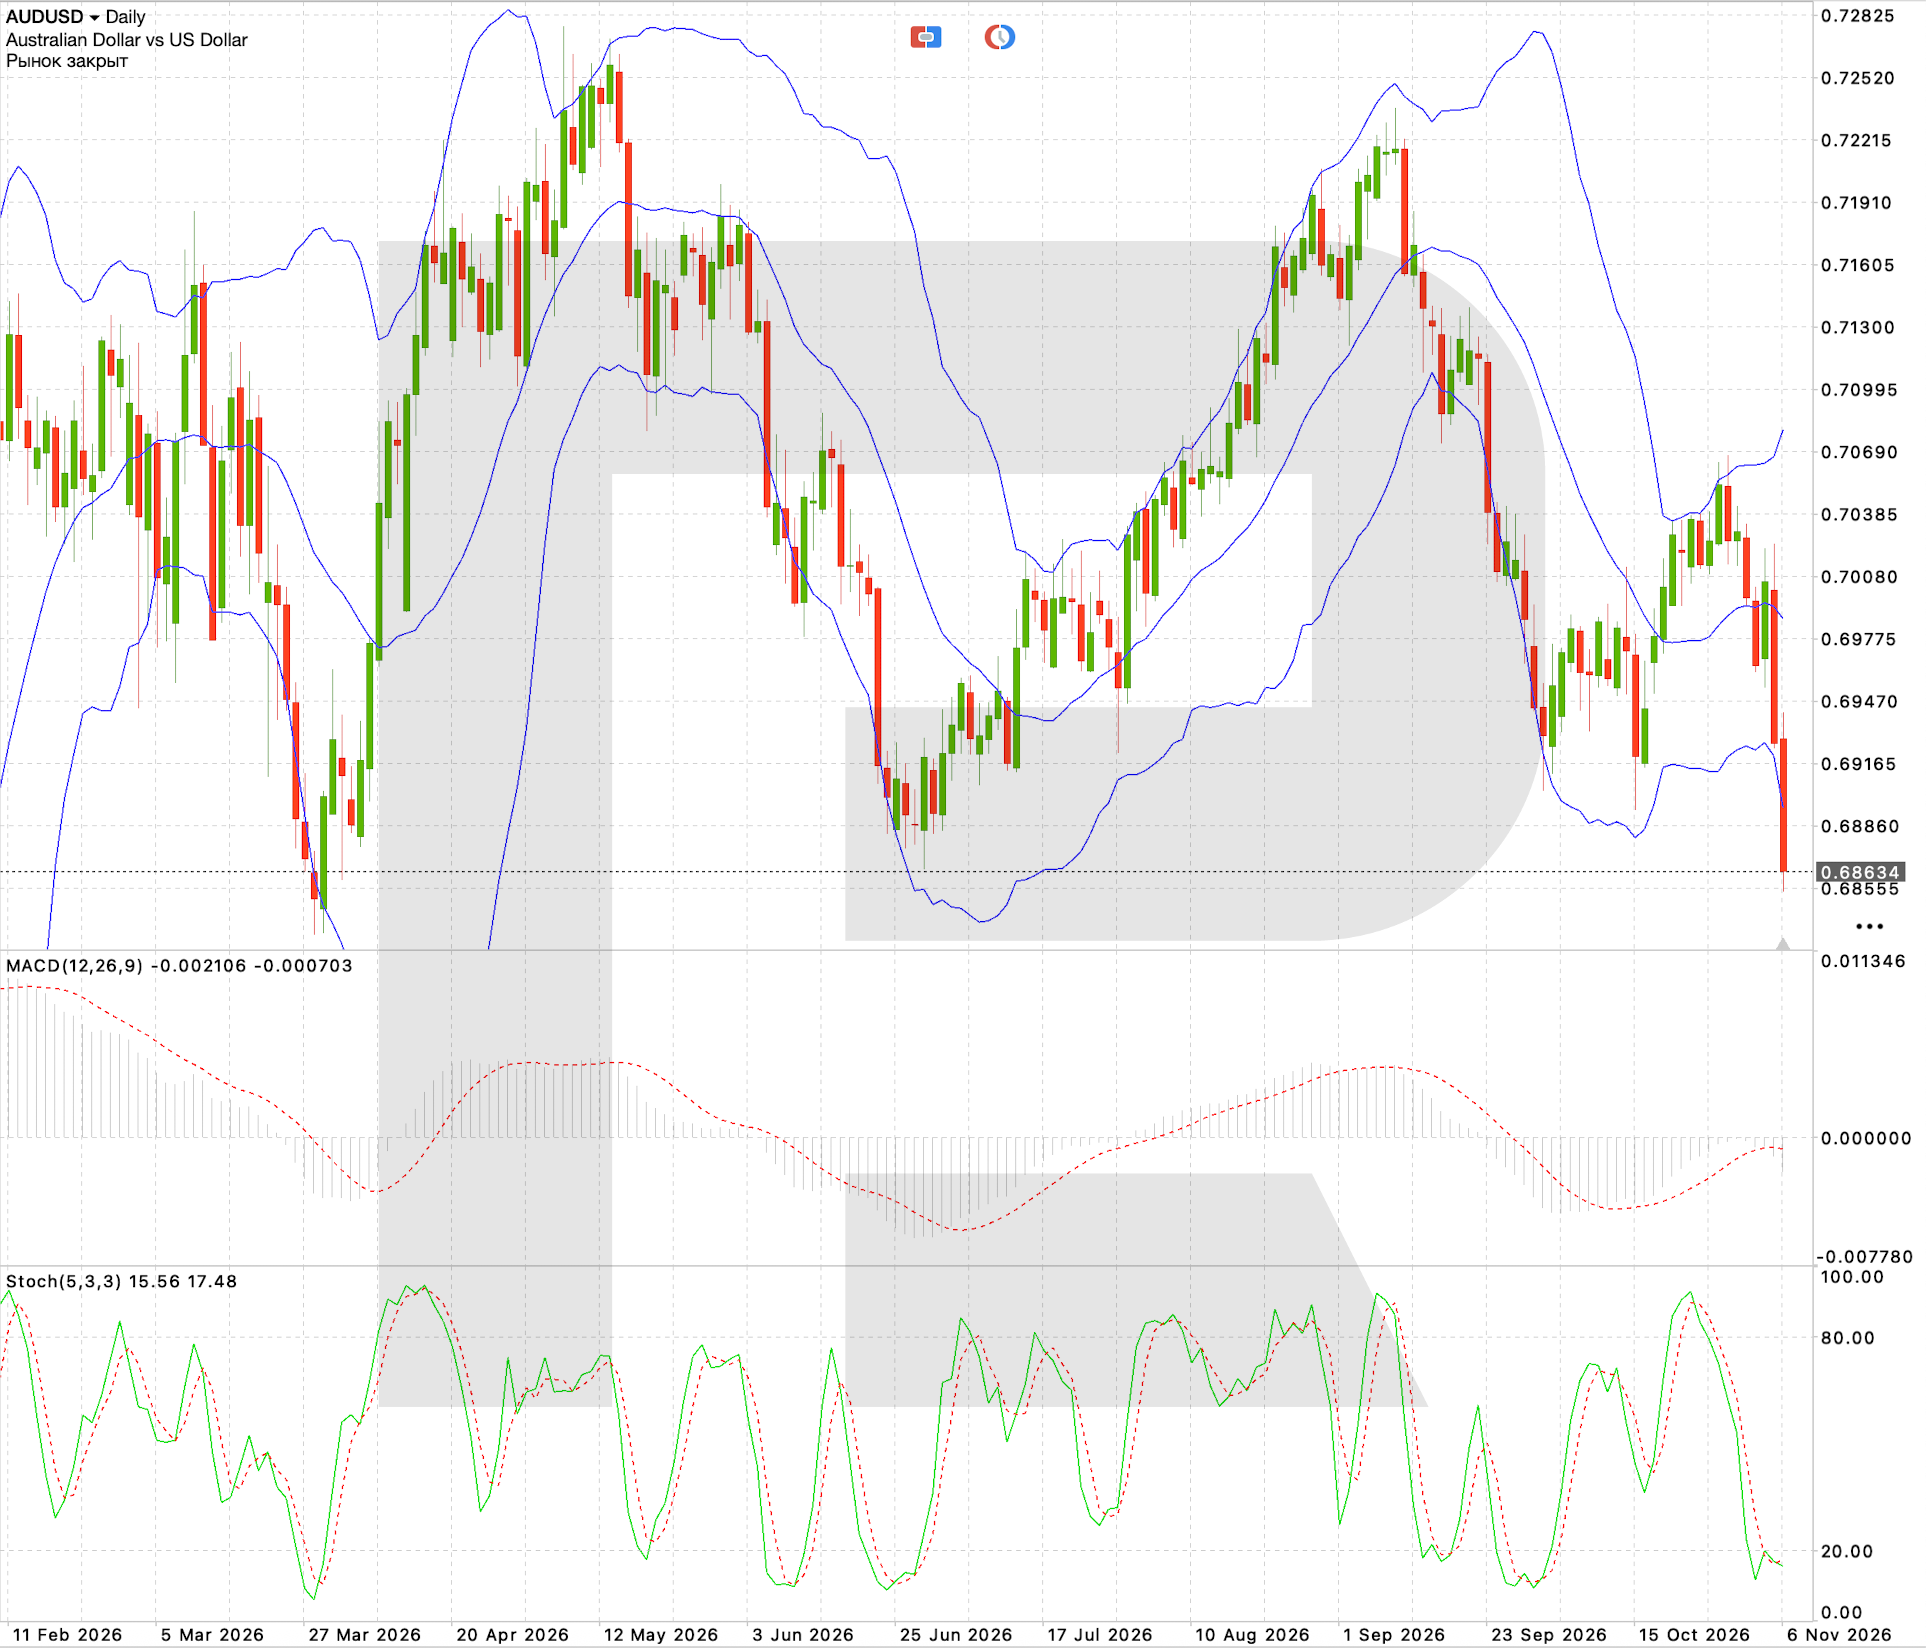
Key Levels and Trade Parameters — AUD/USD
| Parameter | Value |
|---|---|
| Resistance | 0.6920 / 0.7000 / 0.7030 |
| Support | 0.6855 / 0.6730 |
| Entry, Sell Stop | 0.6850 |
| Stop loss | 0.6910 |
| Take profit | 0.6730 |
| Risk to reward | 1:2.0 |
10
Nov
CPI, Year on Year, Forecast
3.7%
Previous
3.7%
CPI, Month on Month, Forecast
0.2%
Previous
0.6%
Core CPI, Year on Year, Forecast
2.5%
Previous
2.6%
Core CPI, Month on Month, Forecast
0.2%
Previous
0.3%
Why It Matters
The next CPI report, covering October, comes out on Tuesday, November 10, at 8:30 a.m. Eastern Time. It is the main macro event of the week. Annual inflation is expected to stay at 3.7%, while the monthly rise slows to 0.2% from 0.6%. Core inflation, which strips out food and energy, is also seen easing, to 2.5% a year from 2.6% and to 0.2% a month from 0.3%. The question for markets is whether price pressure is cooling steadily enough for the Fed to keep easing policy. Inflation above the forecast would support the dollar through higher Treasury yields and a repricing of rate expectations. Softer figures would open room for a recovery in EUR/USD and other risk assets. Read how CPI works and how it moves currency prices.
Market Reaction
EUR/USD: a CPI print above the forecast would add pressure on the euro, and weaker data could lift the pair. Treasuries: any shift in inflation expectations moves yields. Bitcoin: softer inflation could help demand for crypto through better expectations for liquidity and interest rates.
What a Surprise Means
Hotter report: monthly CPI above 0.2%, core above 2.5% a year
US dollar: supported, with Treasury yields moving up.
EUR/USD: more room for the break of 1.1103.
BTC/USD: higher risk of a deeper decline below 74,960 USD.
Softer report: monthly CPI below 0.2%, core easing faster
Treasury yields: lower.
EUR/USD: a chance to recover toward 1.1268.
BTC/USD and US 500: support for technical rebounds.
Market Sentiment
EUR/USD trades near 1.1137 and keeps its downward structure after a long slide from the August highs. The pair has moved into consolidation near the lower Bollinger Band, with the nearest support at 1.1103 and important resistance at 1.1268. The MACD stays below zero: the main line at -0.003921 sits above the signal line at -0.005129, so the negative momentum is fading, though that is no proof of a trend reversal. The stochastic reads 47.18 and 60.35 with the fast line below the slow one, which keeps the risk of a new dip after the short recovery. The working scenario is a break of 1.1103 and a move toward 1.0960. A hold above 1.1170 cancels the sell signal, and a recovery above 1.1268 would open the way to 1.1370.
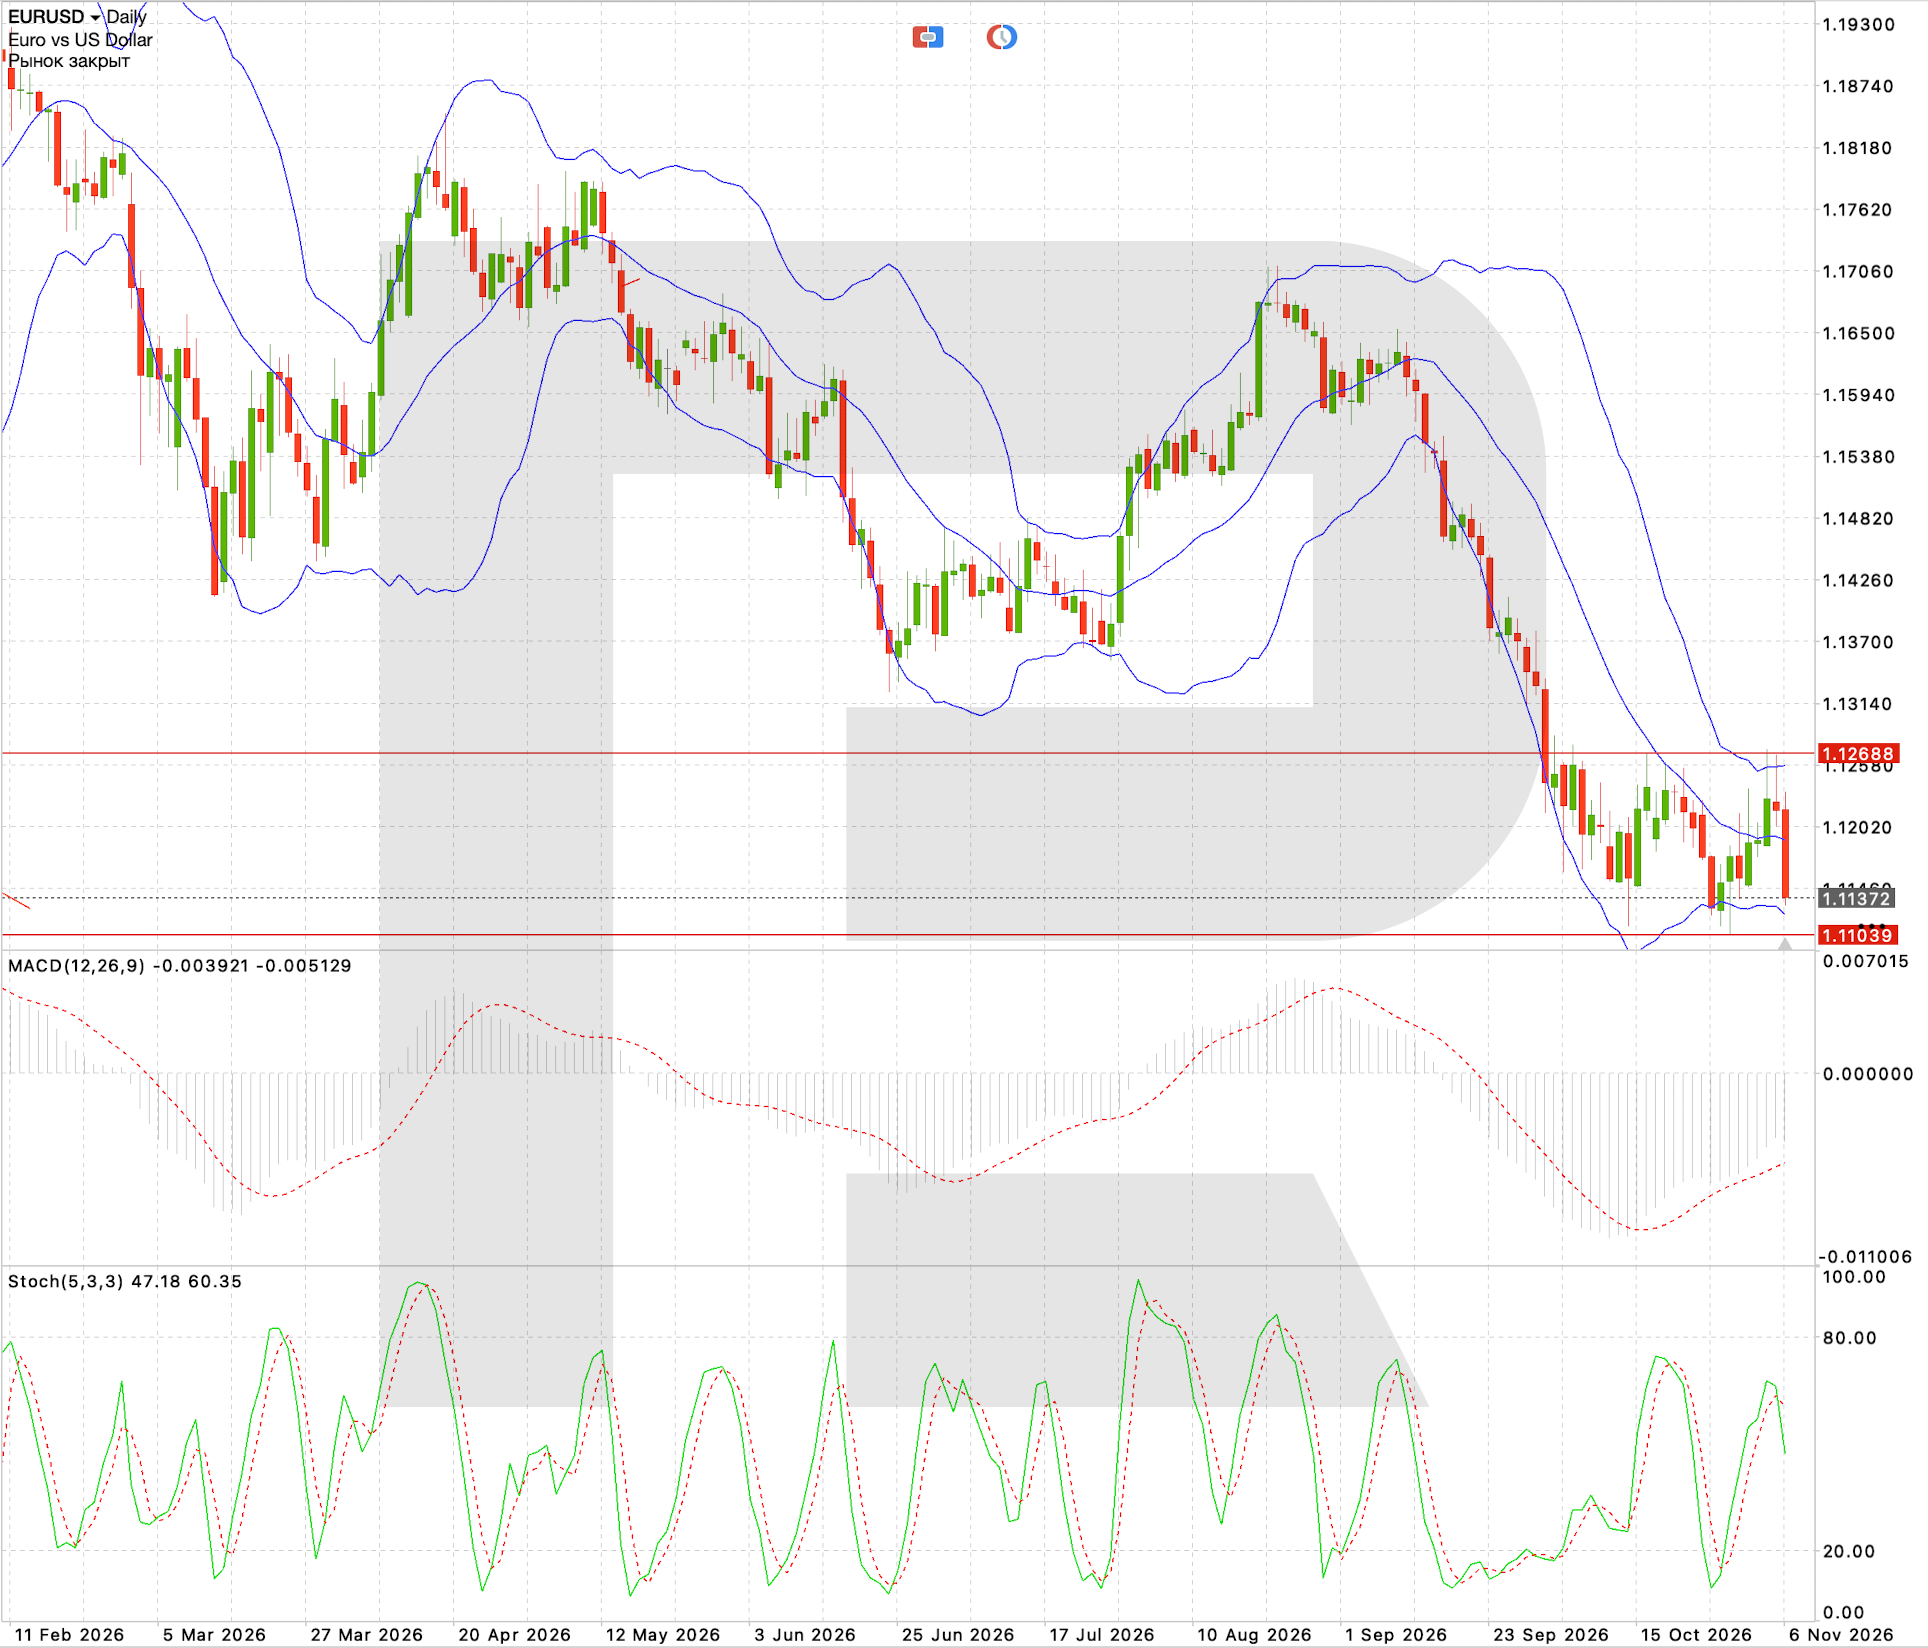
Key Levels and Trade Parameters — EUR/USD
| Parameter | Value |
|---|---|
| Resistance | 1.1268 / 1.1370 |
| Support | 1.1103 / 1.1000 |
| Entry, Sell Stop | 1.1100 |
| Stop loss | 1.1170 |
| Take profit | 1.0960 |
| Risk to reward | 1:2.0 |
10
Nov
BTC/USD, Weekly Close
75,811 USD
September High
87,388 USD
Why It Matters
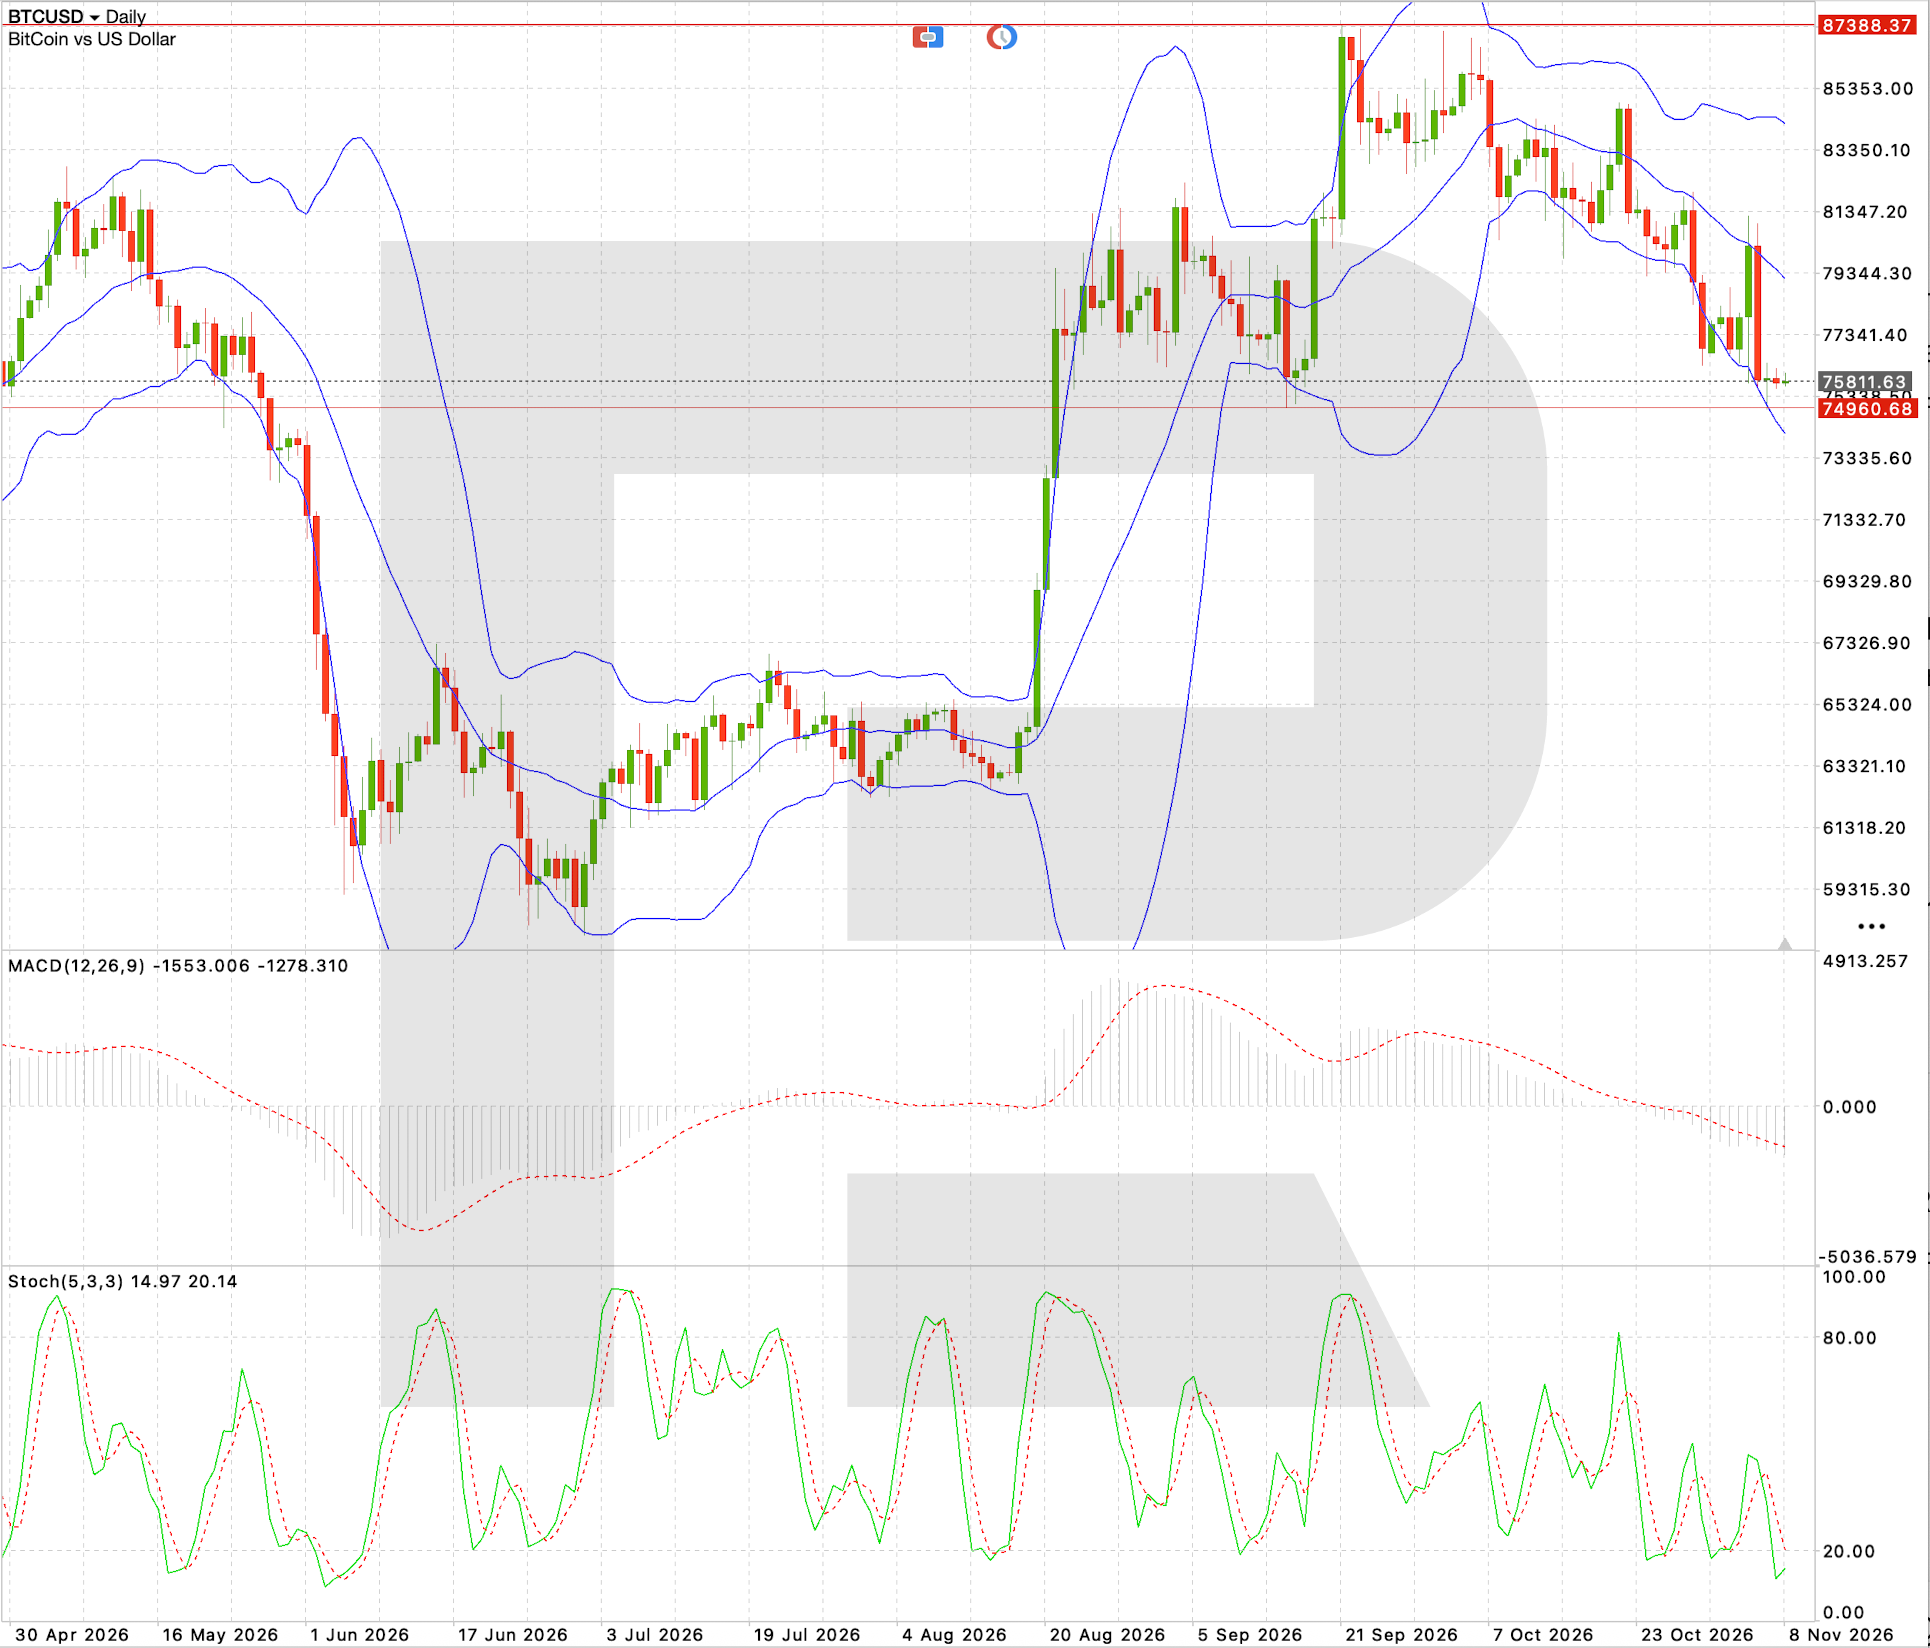
Bitcoin starts the week about 13% below its September high of 87,388 USD and close to support at 74,960 USD. The US CPI report on November 10 is the main macro driver for BTC/USD this week, because it shapes expectations for Fed rates and global liquidity. Inflation above the forecast would raise the risk of a further decline on expectations of firmer Fed policy. Softer data could fuel a technical bounce. A change in the downward structure would still need a move above the nearest resistance levels.
Market Reaction
A soft CPI and lower bond yields would help a rebound toward 79,350 USD. A hot print and weaker risk appetite would put the 74,960 USD support to the test, and a break there would open the next targets below.
Market Sentiment
Lower highs define the daily BTC/USD chart since the September peak, and the price closed the week near 75,811 USD. It trades below the middle Bollinger Band and is approaching important support at 74,960 USD. The MACD main line at -1,553.01 is below its signal line at -1,278.31, and the negative histogram shows seller pressure is building. The stochastic has fallen to 14.97 and 20.14, an oversold reading, but the fast line is still under the slow one, so there is no confirmed reversal signal yet. The base scenario is a further decline after a break of 74,960 USD, with targets at 73,335 USD and 69,000 USD. A return above 77,850 USD cancels the setup, and a hold above 79,350 USD could open the way to 81,350 USD and 83,350 USD.
Key Levels and Trade Parameters — BTC/USD
| Parameter | Value (USD) |
|---|---|
| Resistance | 79,350 / 81,350 / 83,350 |
| Support | 74,960 / 73,335 / 69,000 |
| Entry, Sell Stop | 74,900 |
| Stop loss | 77,850 |
| Take profit | 69,000 |
| Risk to reward | 1:2.0 |
12
Nov
GDP Q3, Quarter on Quarter, Forecast
0.4%
Previous
0.5%
GDP Q3, Year on Year, Forecast
1.7%
Previous
1.4%
GDP September, Month on Month, Forecast
0.2%
Previous
0.1%
Why It Matters
The first estimate of UK GDP for the third quarter will show how well the economy holds up after a long stretch of high interest rates and weak domestic demand. The forecast calls for quarterly growth to slow to 0.4% from 0.5%, while annual growth speeds up to 1.7% from 1.4%. For the Bank of England, the figures are one more input into the rate outlook. A stronger economy lets the bank take its time with rate cuts. Weak growth would raise expectations of easier policy and weigh on sterling. The September monthly figure deserves a close look: a pickup to the forecast 0.2% from 0.1% would point to firmer activity at the end of the quarter.
Market Reaction
GBP/USD: figures above the forecast would support the pound, especially if the dollar weakens after CPI. EUR/GBP: stronger UK data could push the cross lower. British stocks: weak growth would raise rate cut expectations and, at the same time, cloud the outlook for company earnings.
Market Sentiment
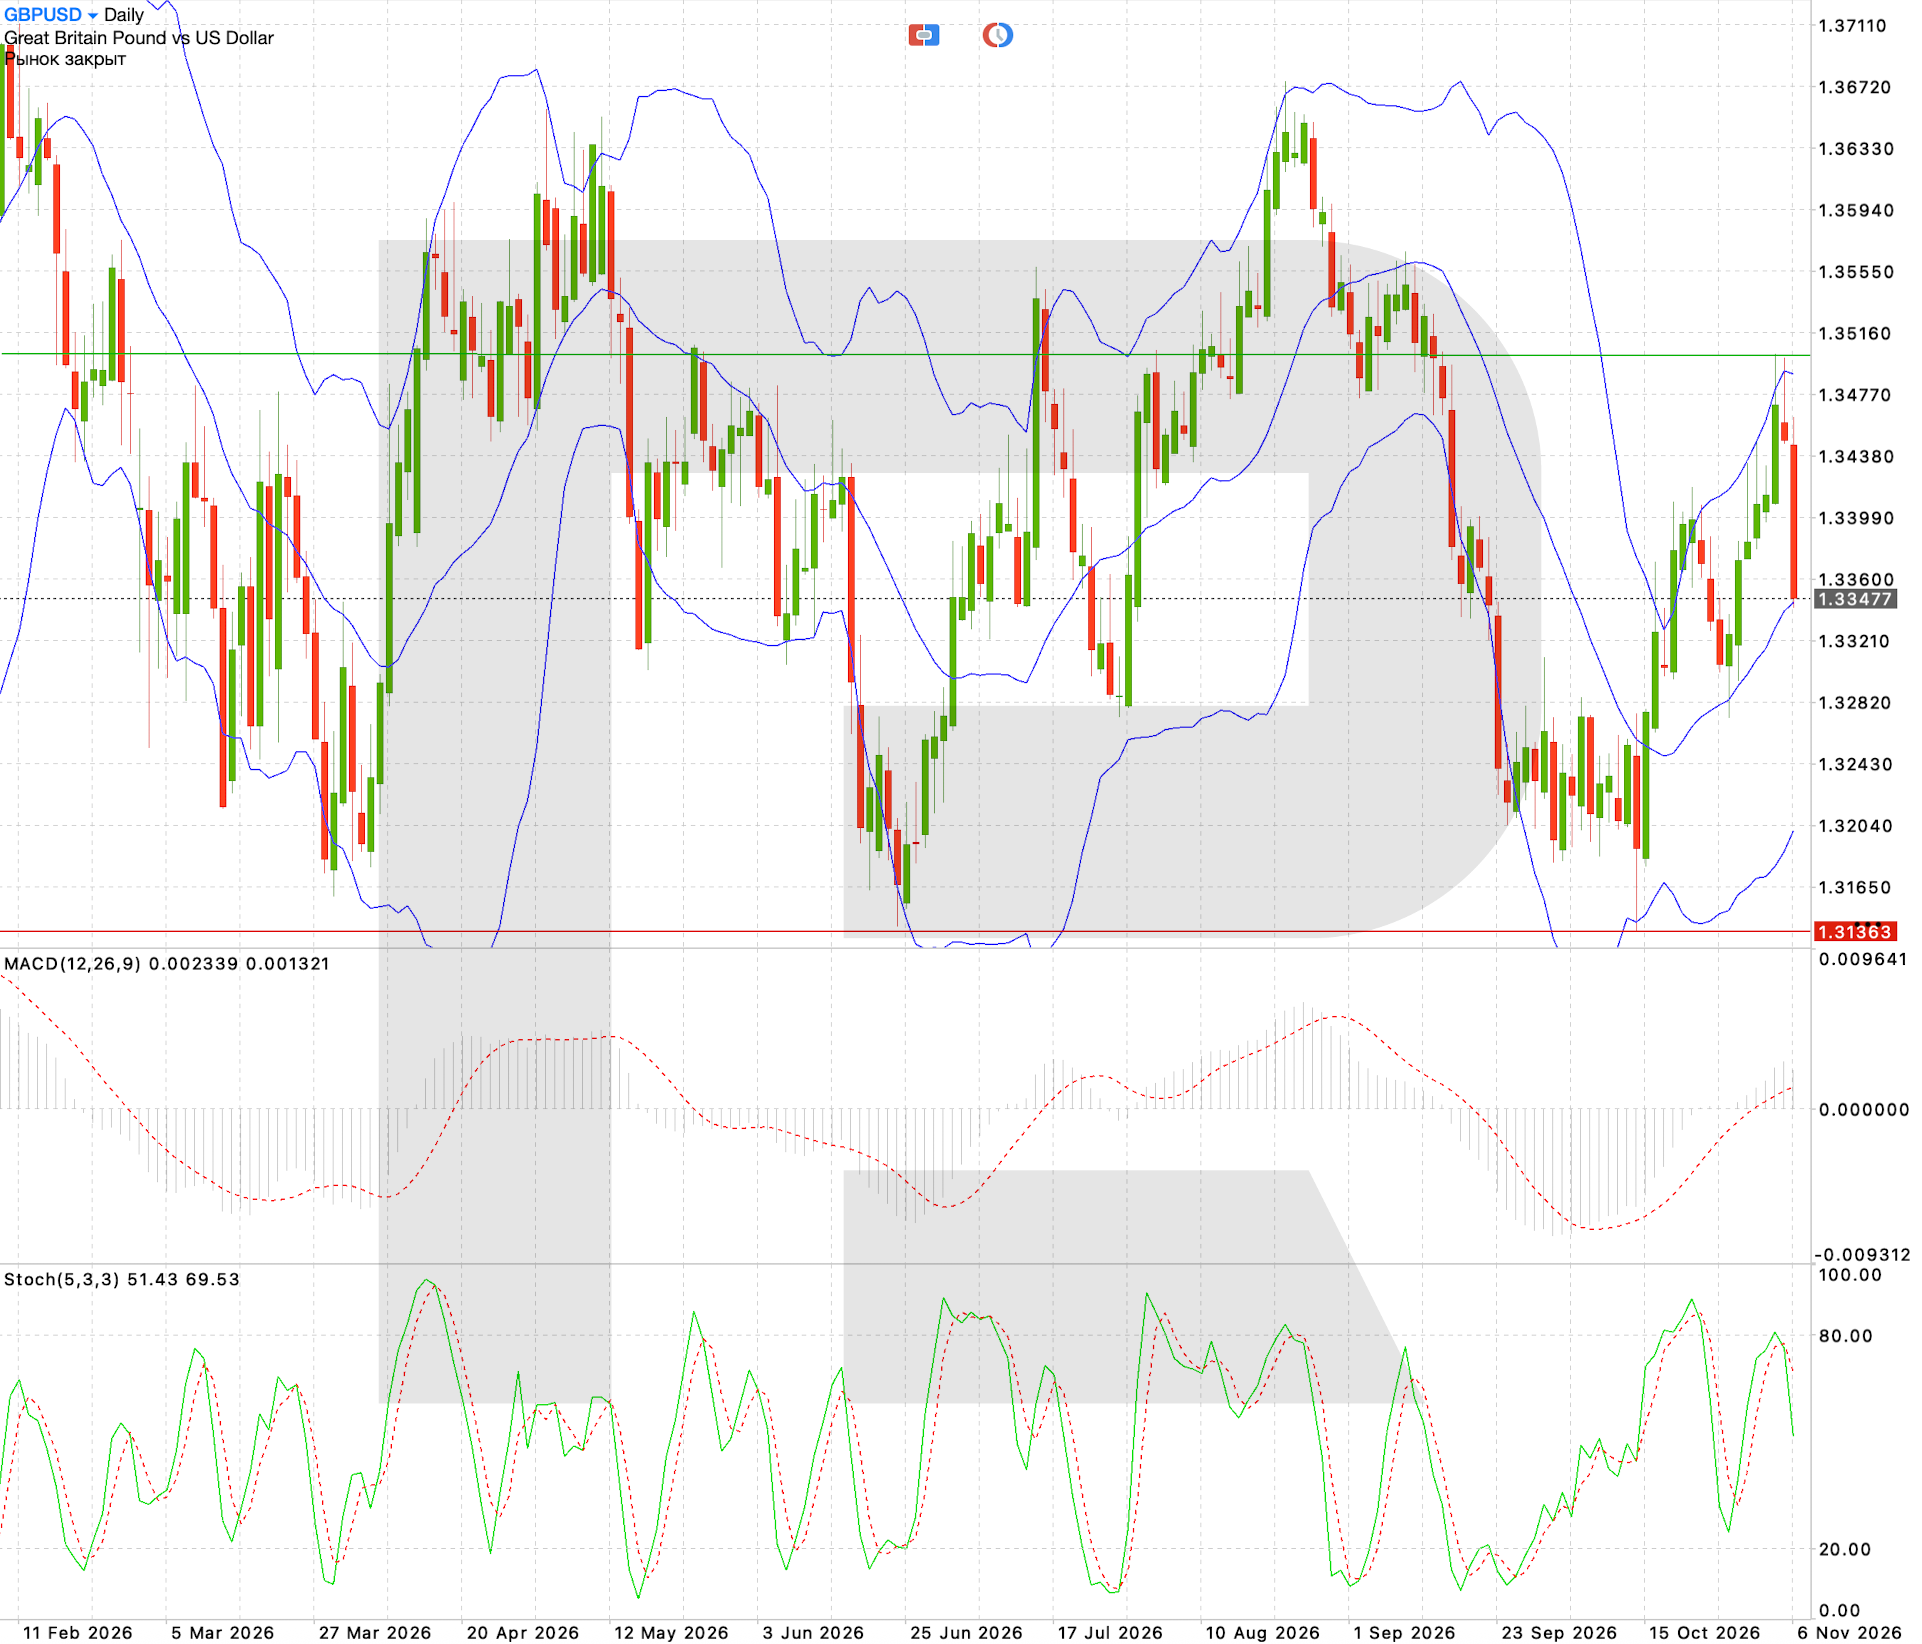
The short-term picture for GBP/USD has turned cautious. The pair closed the week near 1.3348 after it failed to hold above 1.3450, and the price is back at the middle Bollinger Band, so the recovery impulse is fading. The MACD is still positive, with the main line at 0.002339 above the signal line at 0.001321, which leaves some room for recovery even though the latest price action looks less confident. The stochastic reads 51.43 and 69.53, and the fast line under the slow one warns that the pullback may continue. The setup is a sell after a break of 1.3320, with a target at 1.3150. A hold above 1.3390 cancels it, and a return above 1.3450 would bring the 1.3500 resistance back into view.
Key Levels and Trade Parameters — GBP/USD
| Parameter | Value |
|---|---|
| Resistance | 1.3450 / 1.3500 |
| Support | 1.3320 / 1.3240 / 1.3136 |
| Entry, Sell Stop | 1.3310 |
| Stop loss | 1.3390 |
| Take profit | 1.3150 |
| Risk to reward | 1:2.0 |
13
Nov
PPI (October), Month on Month, Forecast
0.1%
Previous
1.3%
Why It Matters
Friday's producer price index closes a busy inflation week in the US. After the consumer figures, investors get a view of price trends at the production and wholesale level. The forecast calls for the monthly rise in PPI to slow sharply, to 0.1% from 1.3%. If that comes true, concern about producers passing higher costs on to consumers would ease, and expectations of softer Fed policy would get support. Higher producer inflation would put stocks under pressure again: rising Treasury yields and a repricing of rate expectations hit companies with high valuations hardest. Read how traders use the producer price index.
Market Reaction
US 500: PPI below the forecast could support a recovery, and a figure above it would raise the risk of a deeper correction. US Tech: technology companies are especially sensitive to bond yields and the cost of capital. US dollar: higher producer inflation would support the currency.
Market Sentiment
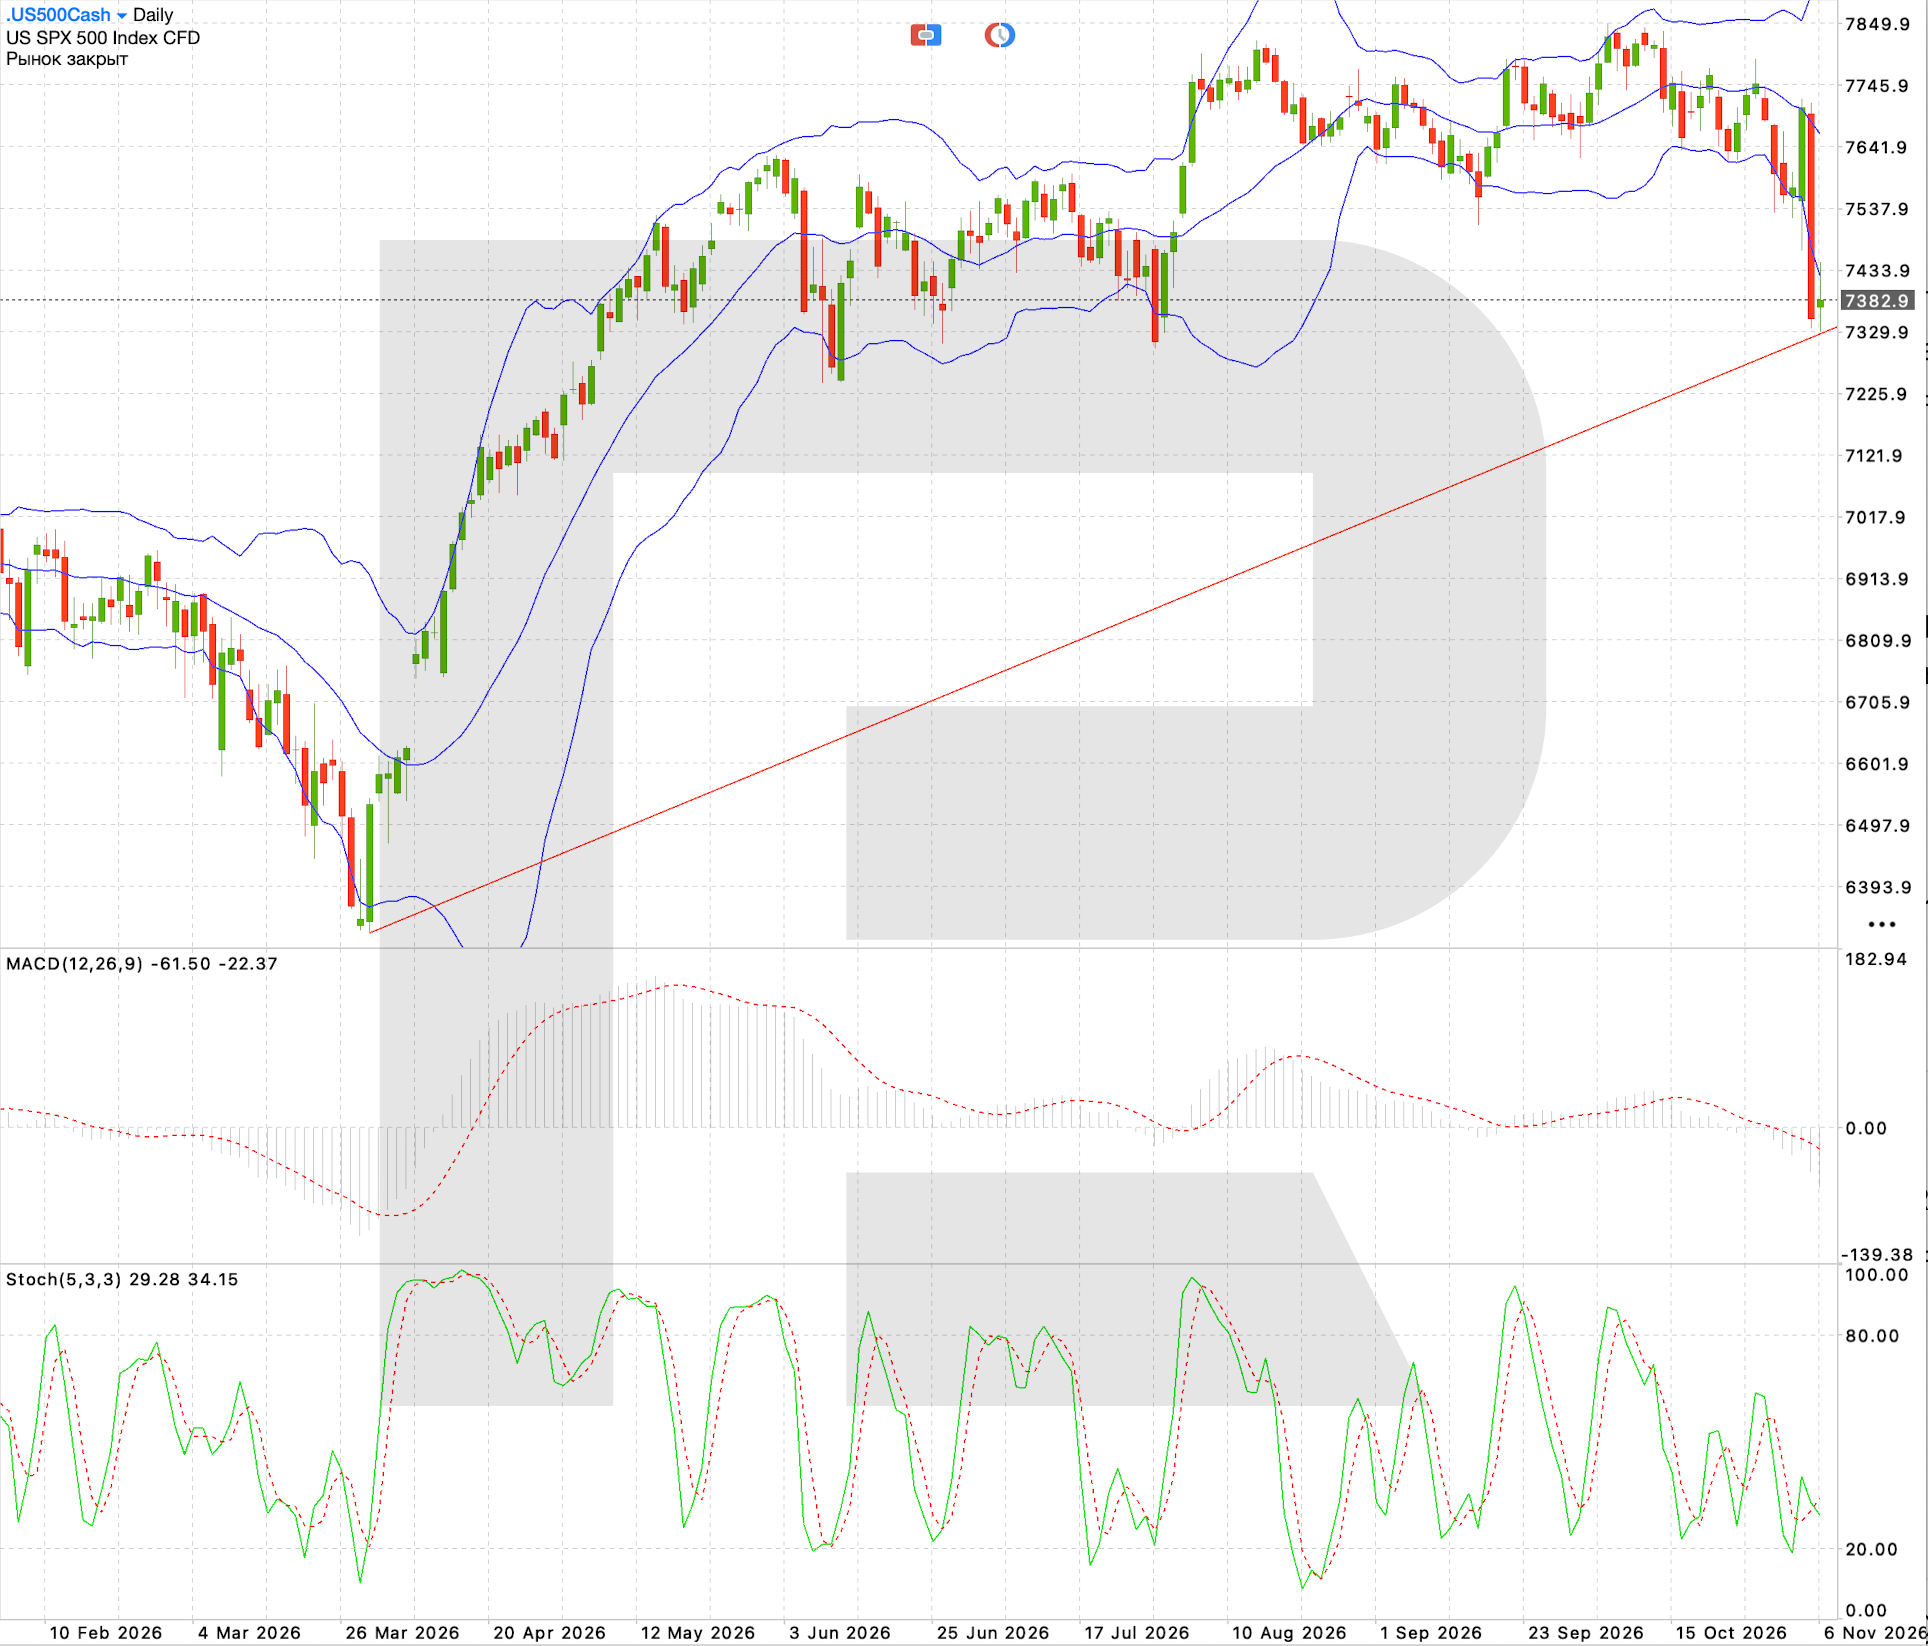
US 500 has come under strong selling pressure and closed the week near 7,382.9 after a sharp drop from the 7,700 to 7,750 area. On the daily chart the index has broken the lower Bollinger Band and is approaching the rising trendline near 7,330, the line that holds the medium-term uptrend together. The MACD at -61.50 sits below its signal line at -22.37, and the negative histogram confirms growing bearish momentum. The stochastic has dropped to 29.28 and 34.15 with the fast line below the slow one, so sellers keep control, though the approach to oversold territory raises the odds of a short bounce. The base scenario is a further decline after a break of the trendline near 7,330, toward 7,225 and then 7,080. A hold above 7,440 cancels the setup, and a recovery above 7,540 would put 7,640 and 7,750 back in play.
Key Levels and Trade Parameters — US 500
| Parameter | Value |
|---|---|
| Resistance | 7540 / 7640 / 7750 |
| Support | 7330 / 7225 / 7080 |
| Entry, Sell Stop | 7320 |
| Stop loss | 7440 |
| Take profit | 7080 |
| Risk to reward | 1:2.0 |
Track the forecast and the actual figure for each release, since the gap between consensus and the outcome is what tends to move prices the most. Learn more about how to read the economic calendar and trade the news.
Conclusion
US inflation data on Tuesday and Friday drives the week of November 9 to 13. The CPI report on Tuesday sets expectations for Fed policy, and Friday's PPI shows how fast price pressure is easing at the producer level. In EUR/USD, a break of 1.1103 points to 1.0960, and a hold above 1.1170 cancels the signal. US 500 sits on its rising trendline near 7,330: a break targets 7,225 and 7,080.
China's trade balance and UK GDP add two more reference points for currencies. AUD/USD meets the Chinese data with strong downward momentum, with a sell below 0.6855 aimed at 0.6730, and GBP/USD tries to keep its recent gains, with 1.3320 as the trigger for a move to 1.3150. Bitcoin tests buyers near 75,000 USD, and a break of 74,960 USD points to 73,335 USD and 69,000 USD. Soft US inflation would support technical rebounds, but a confirmed reversal in any of these markets needs a recovery above the nearest resistance first.
FAQ
When is the next CPI report?
The next CPI report, covering October 2026, comes out on Tuesday, November 10, at 8:30 a.m. Eastern Time (13:30 GMT). The US Bureau of Labor Statistics (BLS) publishes it. Annual inflation is expected to hold at 3.7%, and the monthly rise to slow to 0.2% from 0.6%. Core CPI is seen at 2.5% a year. US producer prices follow on Friday, November 13.
What is the main market event of November 9 to 13?
The main event is the US consumer price index (CPI) for October, released on Tuesday, November 10. The inflation figures can change expectations for Fed rates and move the dollar, stock indices and crypto.
Why does China's trade balance matter for AUD/USD?
China is Australia's largest trading partner. Its foreign trade shapes expectations for demand for Australian raw materials and for the outlook of the Australian dollar.
What is expected from UK GDP?
The forecast calls for quarterly growth of 0.4% after 0.5% and annual growth of 1.7% after 1.4%. A gap between the actual figures and the forecast can move GBP/USD.
How can US PPI affect US 500?
Lower producer inflation can support expectations of softer Fed policy and help stocks. A figure above the forecast can push the index lower, and it already trades near its rising trendline at 7,330.
Which level matters most for Bitcoin this week?
The nearest key support is near 74,960 USD. A break below it widens the risk of a further decline toward 73,335 USD and 69,000 USD, and a recovery above 79,350 USD would improve the short-term picture.
Any forecasts contained herein are based on the author's independent analysis and reflect their personal opinion. These articles should not be construed as trading recommendations or a call to action. The authors and RoboForex accept no responsibility for the results of any trades made on the basis of these recommendations and reviews. Past performance is not indicative of future results. Trading stocks and CFDs involves a high risk of capital loss.