A 15-Minute Backtest: How to Test a Trading Robot in MetaTrader 5

To test a trading robot in MetaTrader 5, install the Expert Advisor in the MQL5 folder, download real tick history, set a realistic spread and execution delay in the Strategy Tester and run the test in Every tick based on real ticks mode. Then read the report: profit factor, maximum drawdown, trade count and the equity curve show whether the robot is ready for a demo account.
TL;DR
- Copy the EA to MQL5 -> Experts and download at least 12 months of real tick history for the symbol.
- In the Strategy Tester, choose Every tick based on real ticks, a realistic spread and a non-zero execution delay.
- Trust the result only with History Quality near 99.9%, a profit factor of about 1.4 to 2.0 and enough trades; then forward test and move to a demo account.
Launching a trading robot on a real account without checking it first sharply raises the odds of running into a coding error, flawed logic, or a strategy that simply cannot handle changing market conditions. A backtest in MetaTrader 5 runs the robot against historical data, so its parameters and weak points surface before any real money is on the line.
A basic check in the MetaTrader 5 Strategy Tester takes about 15 minutes and needs no programming, just correctly configured simulation settings and a careful read of the report. This guide walks through the full sequence: installing the robot, loading quality tick history, setting realistic spread and execution-delay parameters, and interpreting the results.
What Is a Backtest and What It Shows
In algorithmic trading, a backtest checks how a trading robot would have performed over a historical period, anywhere from a few months to several years. The MetaTrader 5 Strategy Tester replays that history through the algorithm tick by tick, opening and closing trades exactly as the strategy's code dictates, and lets a trader evaluate a system's behavior without risking real capital.
What a Quality Backtest Can Tell You
- Behavioral dynamics. How the algorithm reacts to sharp price moves and shifts between rising and falling phases.
- Maximum drawdown. The largest drop in balance from a prior peak, a direct read on the strategy's risk level.
- Trade frequency. The average number of positions opened per day, week, or month.
- Average holding time. How long trades typically stay open, which points to the robot's trading style.
What a Backtest Can't Guarantee
A strong historical result is not a promise of equivalent future profit. A backtest only shows how well the strategy's math held up against past price data, nothing more.
MetaTrader 5's main advantage for backtesting is its built-in multi-threaded Strategy Tester, which uses available computing resources efficiently and supports simulation on real tick history, giving a far more detailed read on a robot's behavior before it goes live.
Preparing for the Test: Installing the EA and Loading Historical Data
The reliability of a backtest depends entirely on how well it was set up. Before running the simulator, two steps are mandatory: move the robot's file into the terminal, and download tick-level quote history.
This is where most tests go wrong. Knowing how to backtest an EA starts with the files: the robot must sit in the right folder of the terminal you plan to trade in, or the Strategy Tester will not find it. The data matters just as much. The history that loads with a chart is enough for a quick look, but a test on it rebuilds prices between minute bars by formula, and a robot with tight stops or scalping logic will show results it could never repeat. Downloading real ticks for the symbol and period takes a few minutes and is the single biggest step towards an honest result. For a general introduction to trading robots, see the RoboForex page on Expert Advisors.
Step 1. Install the Expert Advisor in MetaTrader 5
1
Open the data folder
In the top menu, go to File → Open Data Folder.
2
Copy the robot's file
In the file explorer window, navigate to MQL5 → Experts and copy the trading robot's file into that folder.
3
Refresh the Navigator panel
Close the file explorer. In MetaTrader 5's Navigator panel, right-click Expert Advisors and choose Refresh. The robot now appears in the list and is ready to use.
Step 2. Download Quality Tick History
One of the most common reasons a robot looks profitable in the simulator but loses money live is poor-quality history. By default, MetaTrader 5 loads quote history from the broker's servers automatically when a chart opens, but that base data set is incomplete. An accurate test needs ticks, the smallest price changes occurring in fractions of a second.
1
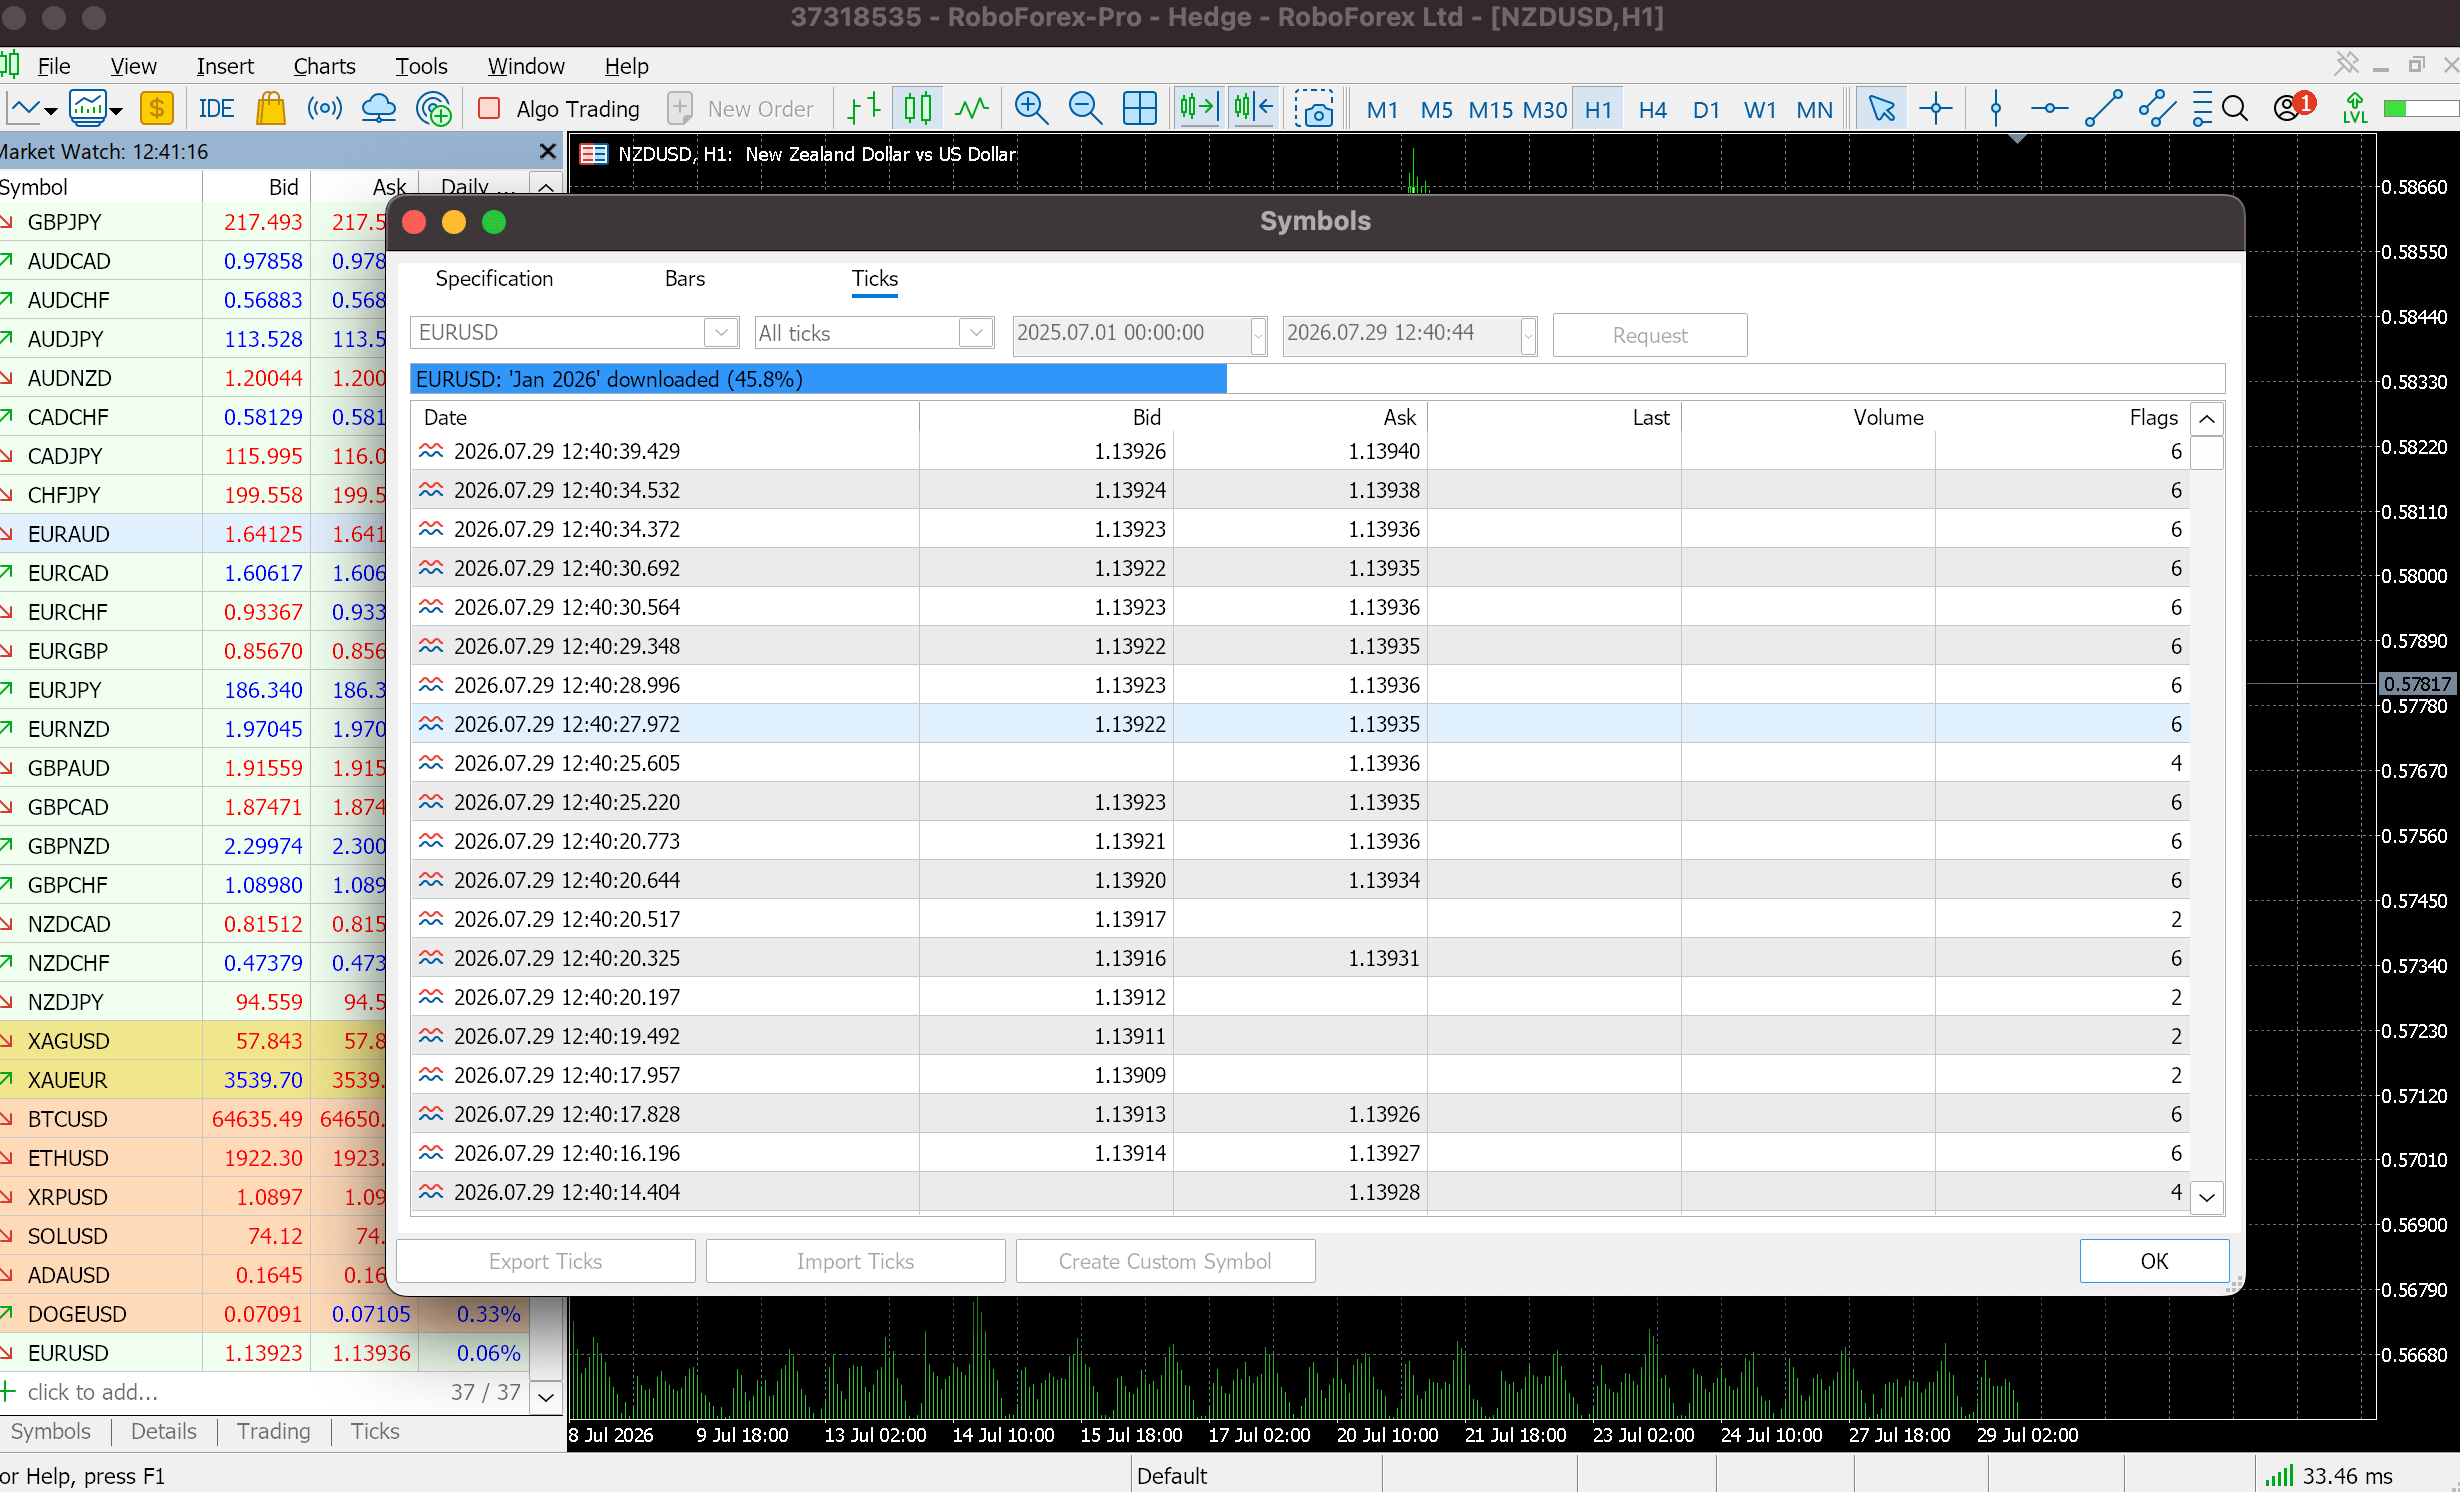
Open View → Symbols.
2
Select the instrument to test, for example EURUSD.
3
Open the Ticks tab, set the time range (a period of 12 months or more is recommended) and click Request. The terminal downloads the archive of real ticks directly from the broker's server.
What Is History Quality, and Why Does 99.9% Matter?
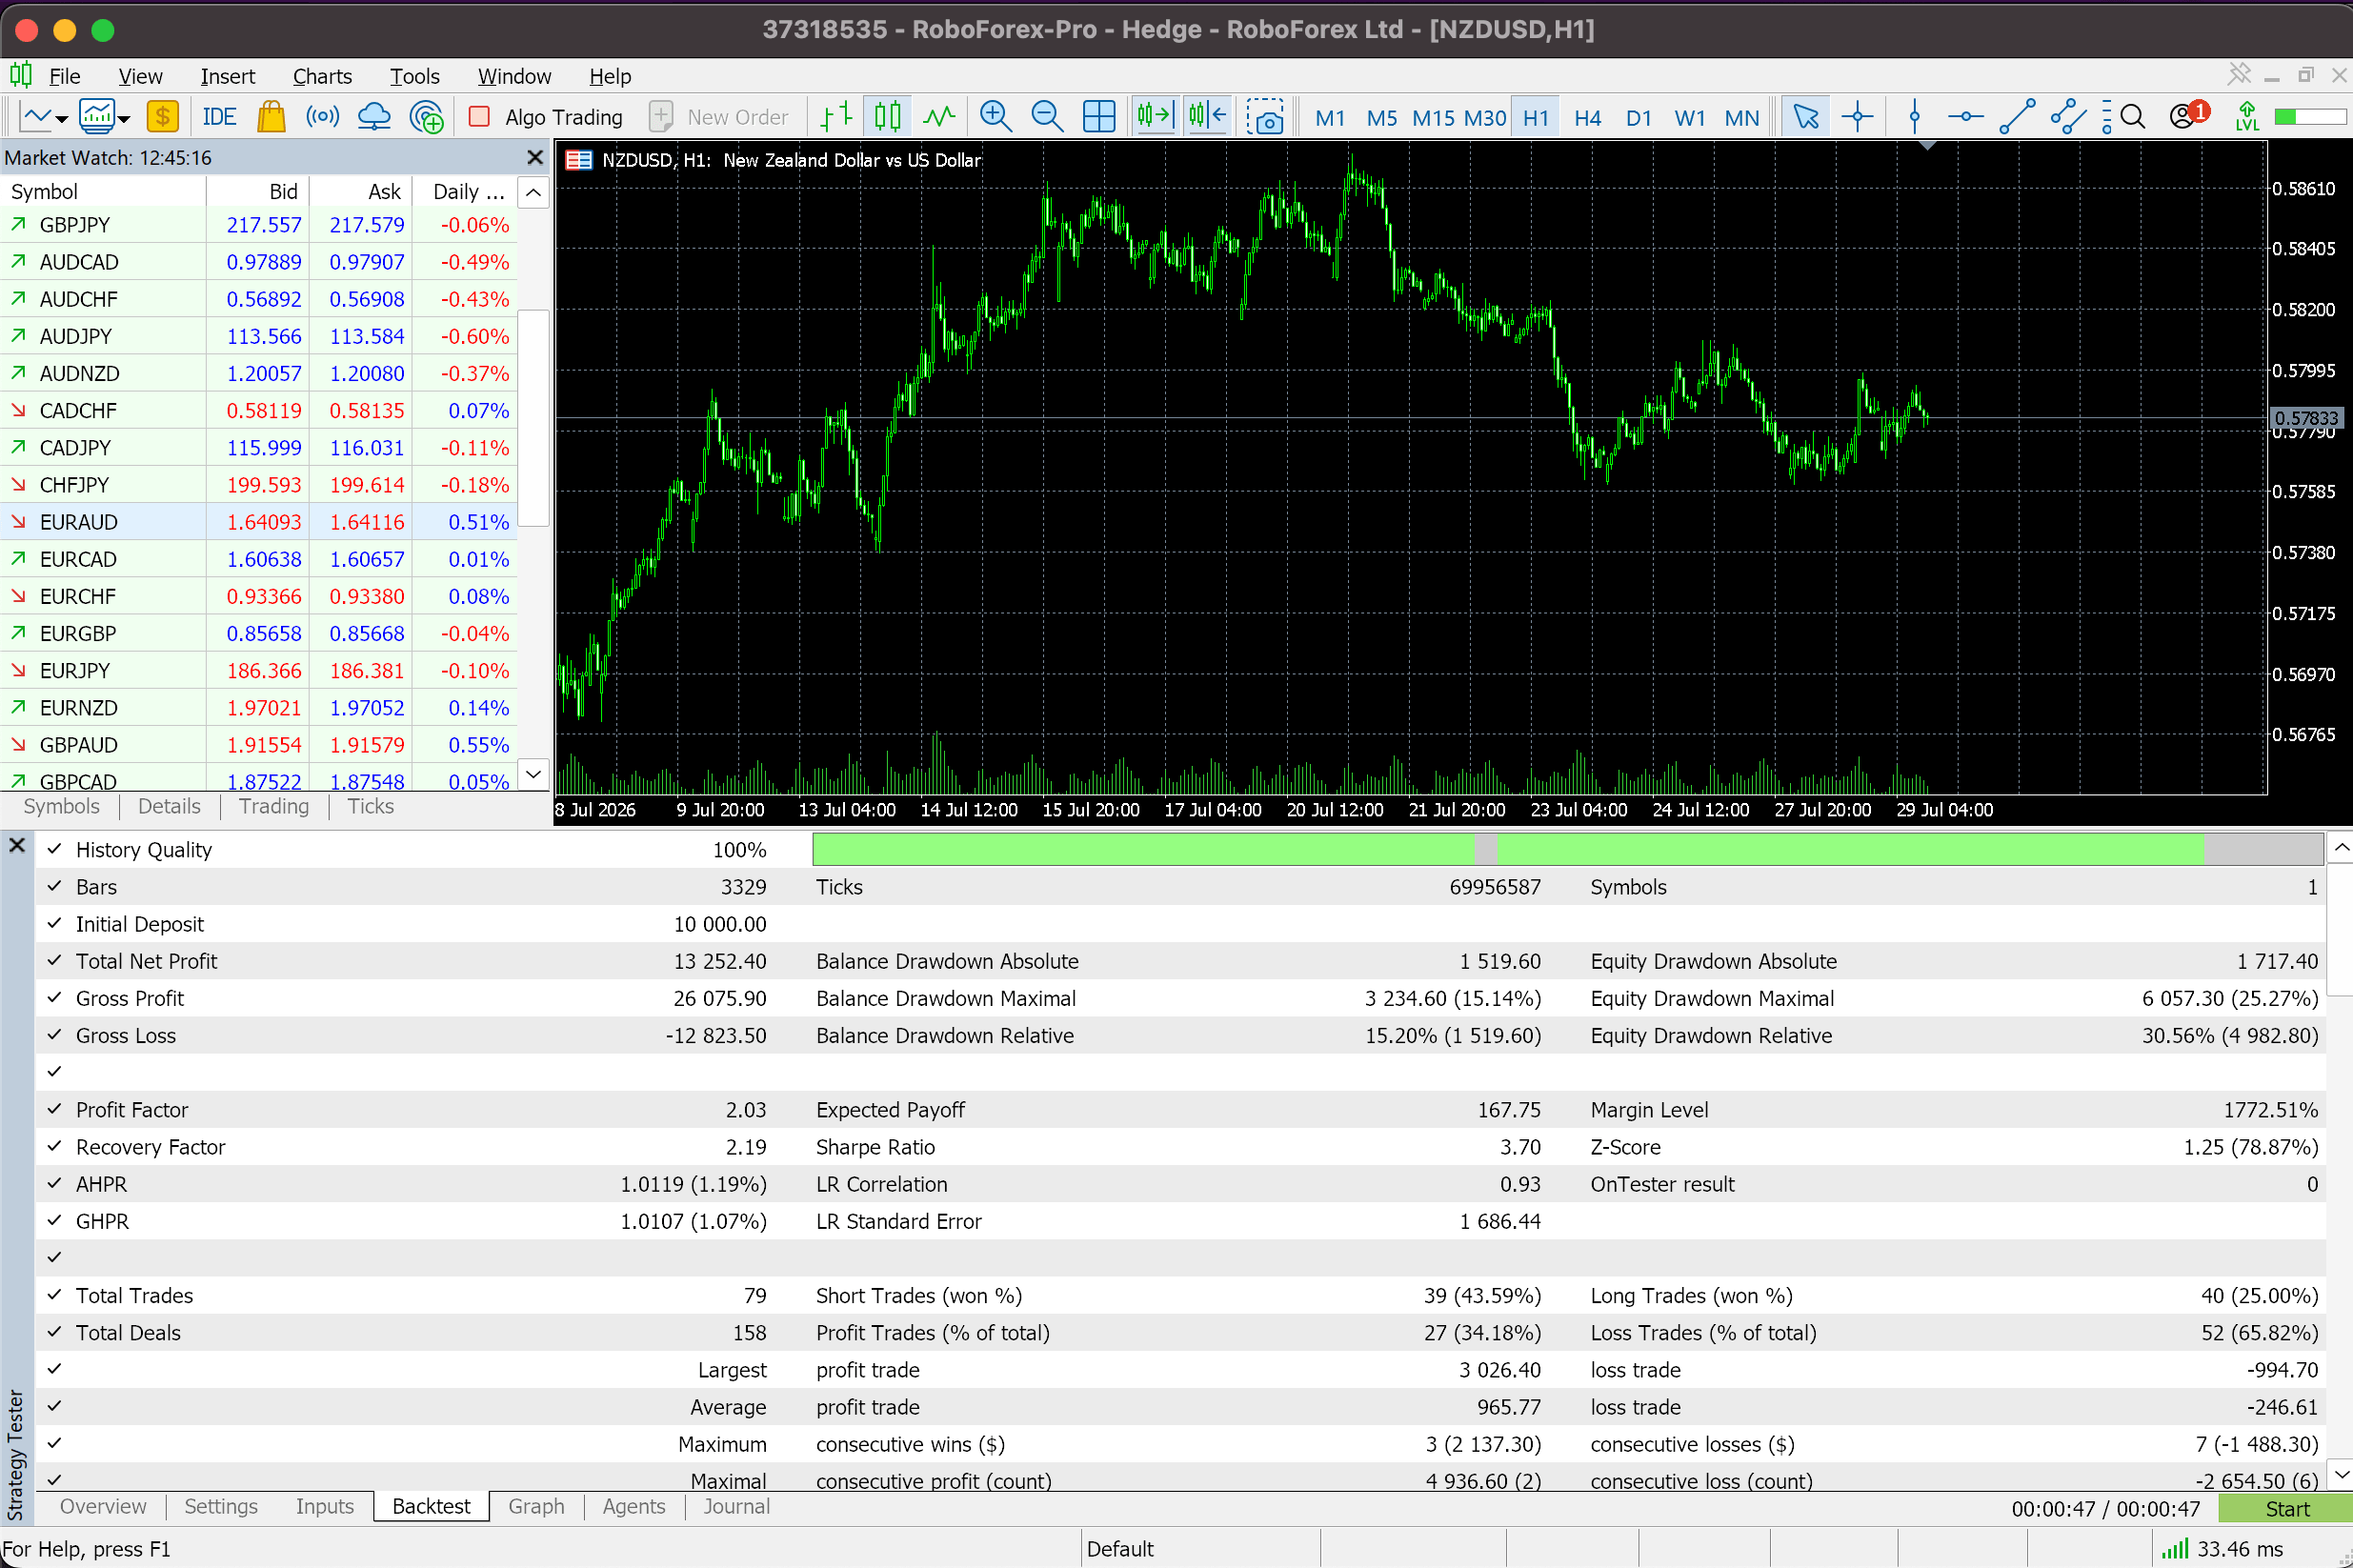
History Quality is a Strategy Tester report metric that scores how accurately the tester was able to reconstruct past price movement from the available quote history.
- Below roughly 90%, the historical data has gaps, and the tester partially reconstructs missing ticks mathematically. Entry and exit timing, and stop-loss/take-profit triggers, may then drift from real market conditions.
- 99.9% is the standard for a quality backtest. A green quality bar means the test ran on the most complete historical data available, giving the most accurate possible read on a strategy's past performance.
Trade on the Go With RoboForex MobileTrader
A portable trading workstation on your phone, on Android and iOS.
Step-by-Step Strategy Tester Configuration
This is the core of how to backtest an EA in MetaTrader 5. Open the built-in Strategy Tester via View → Strategy Tester. The process covers installing the robot, configuring parameters, running the simulation, and reading the results. Under normal conditions, a basic test runs start to finish in about 15 minutes.
15-Minute Backtest Timeline
00:00 to 02:00 · 2 min
Install and open the tester
Install the robot in the terminal, open the Strategy Tester window, and select the Expert Advisor.
02:00 to 05:00 · 3 min
Configure the test parameters
Set the symbol, period, timeframe, modeling mode, deposit size, and the robot's own input parameters.
05:00 to 10:00 · 5 min
Run the test
The terminal replays historical market conditions, simulates the algorithm, and logs every trade.
10:00 to 15:00 · 5 min
Read the report
Check profit, maximum drawdown, trade count, and History Quality, and review the balance and equity curves.
Configuring Each Field
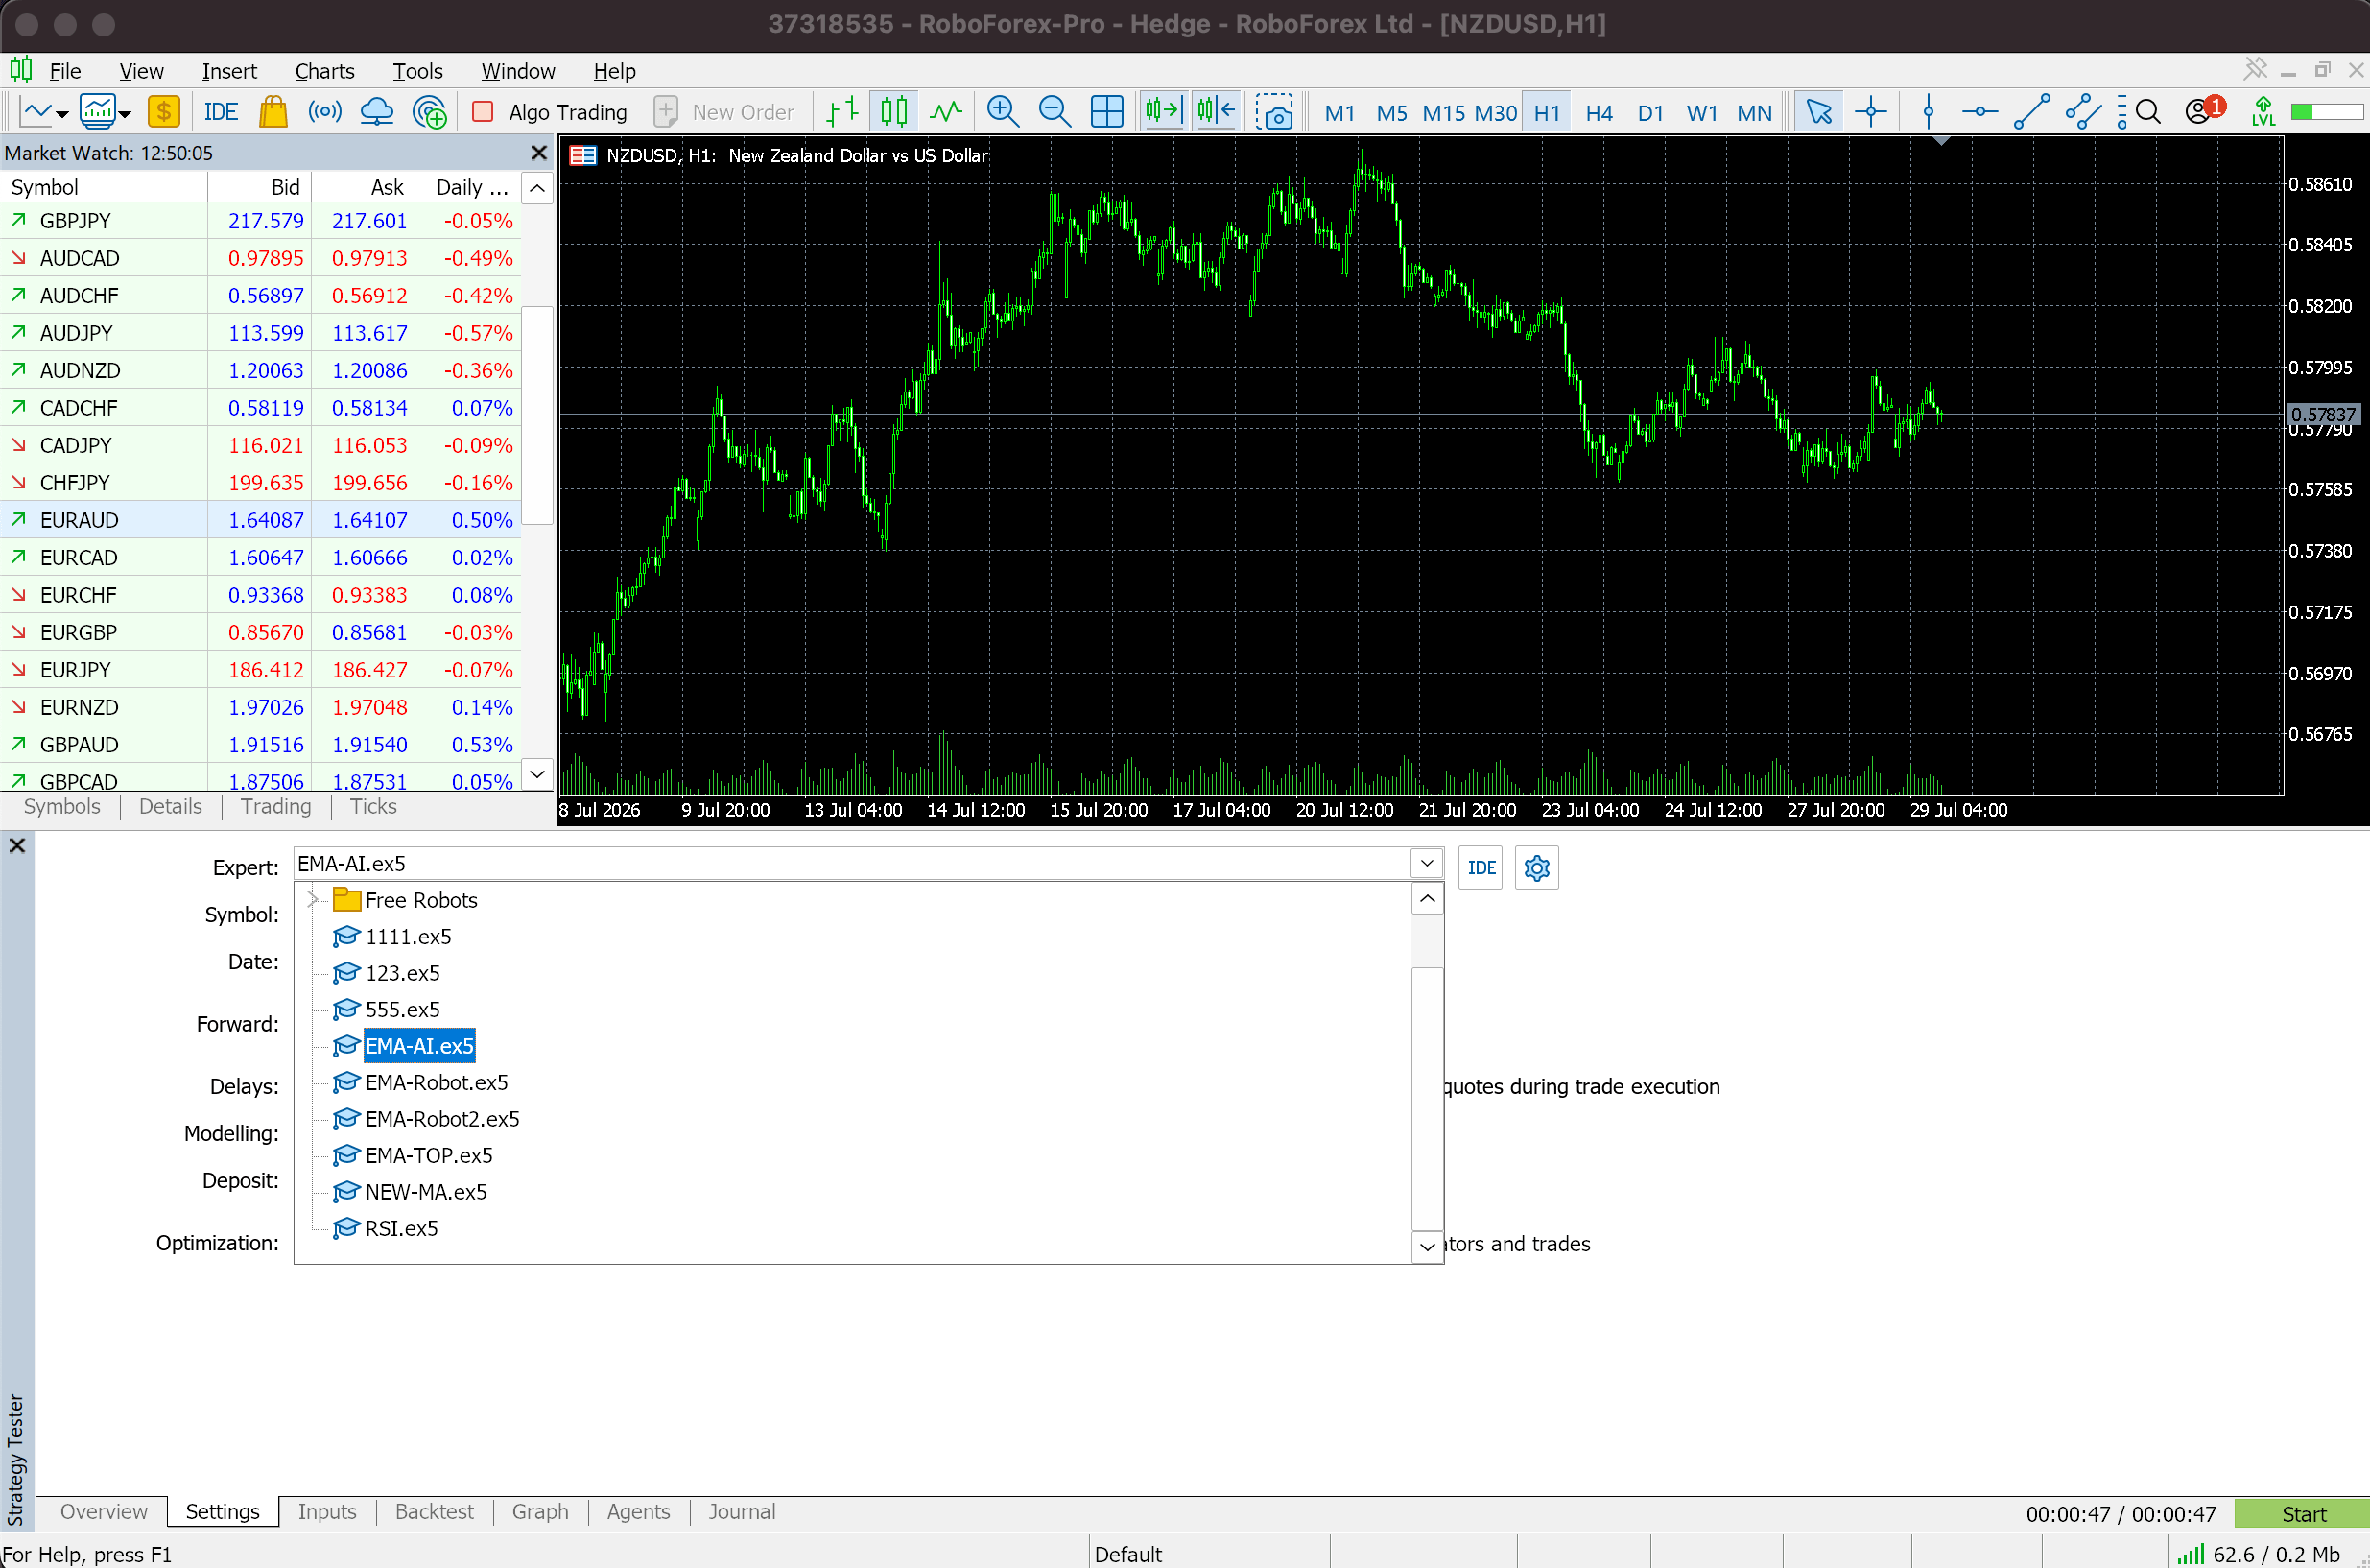
Expert. The robot to test, chosen from the installed Expert Advisors. The buttons alongside it open the EA's properties or jump straight into MetaEditor.
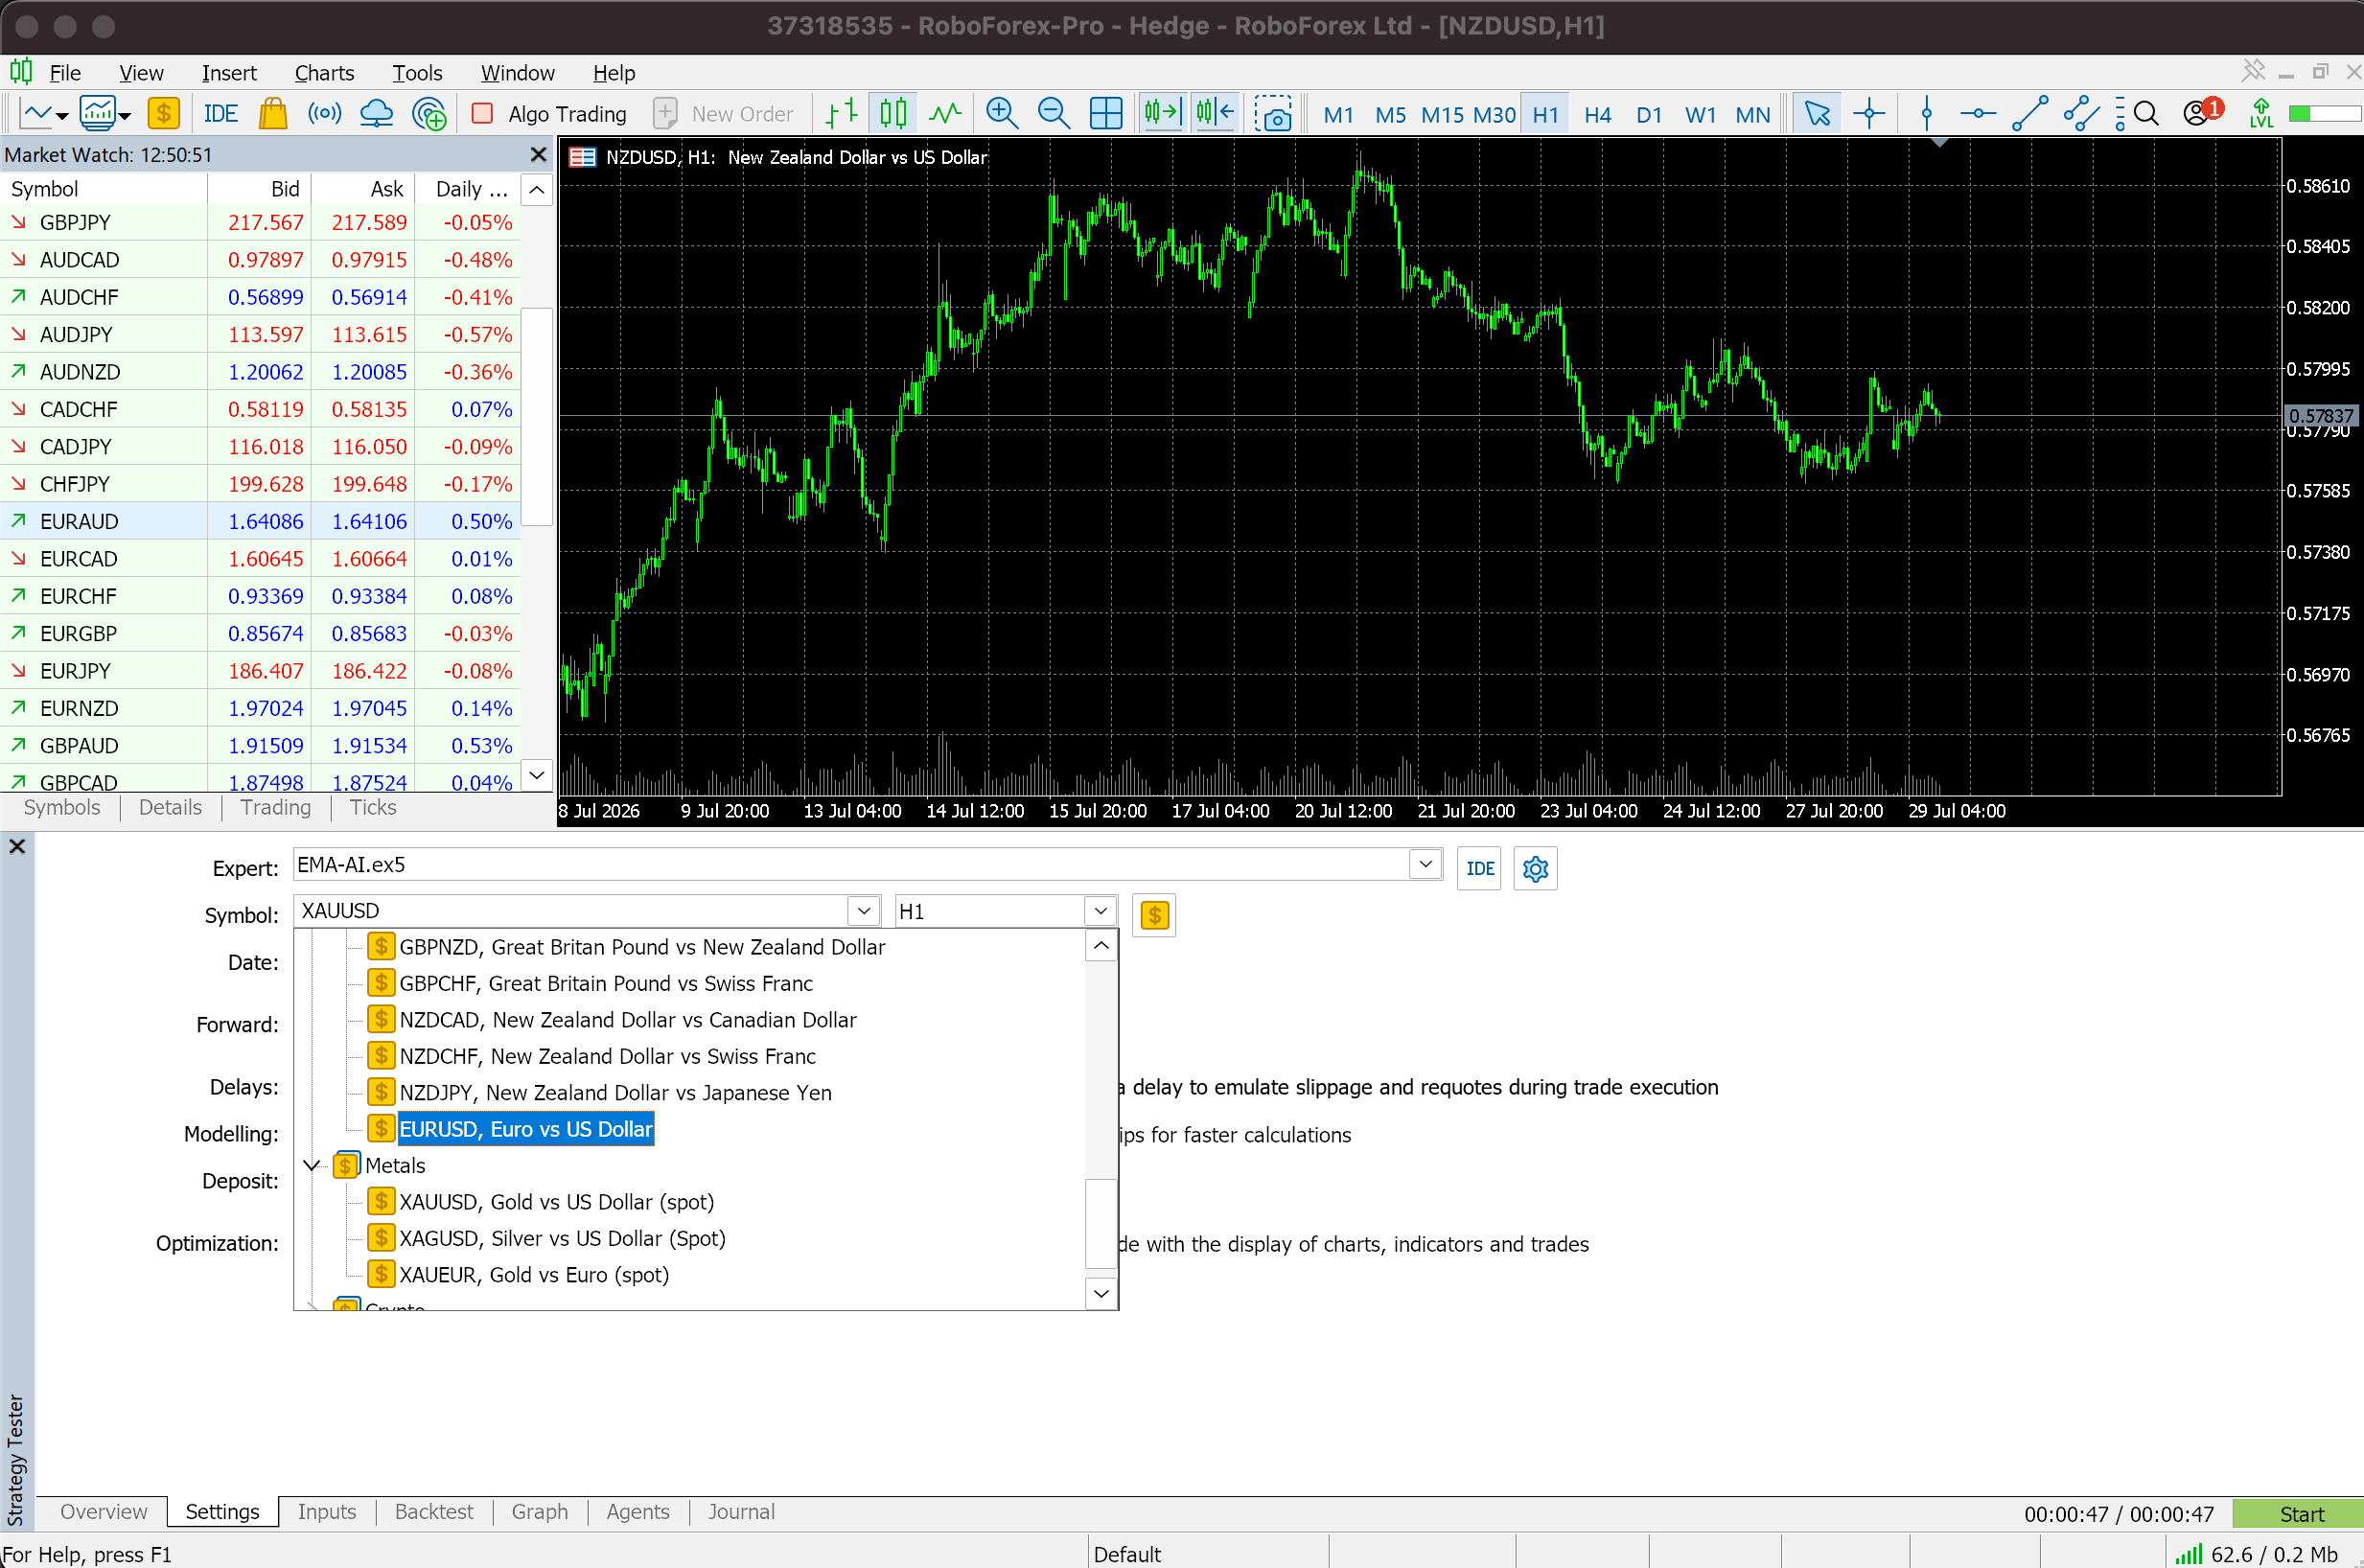
Symbol. The instrument the algorithm will trade, for example EURUSD or gold (XAUUSD).
Timeframe. The chart interval the strategy runs on, such as M1, M15, H1, or D1, which directly affects signal frequency. The specification button next to it shows contract size, settlement currency, margin requirements, and commissions.
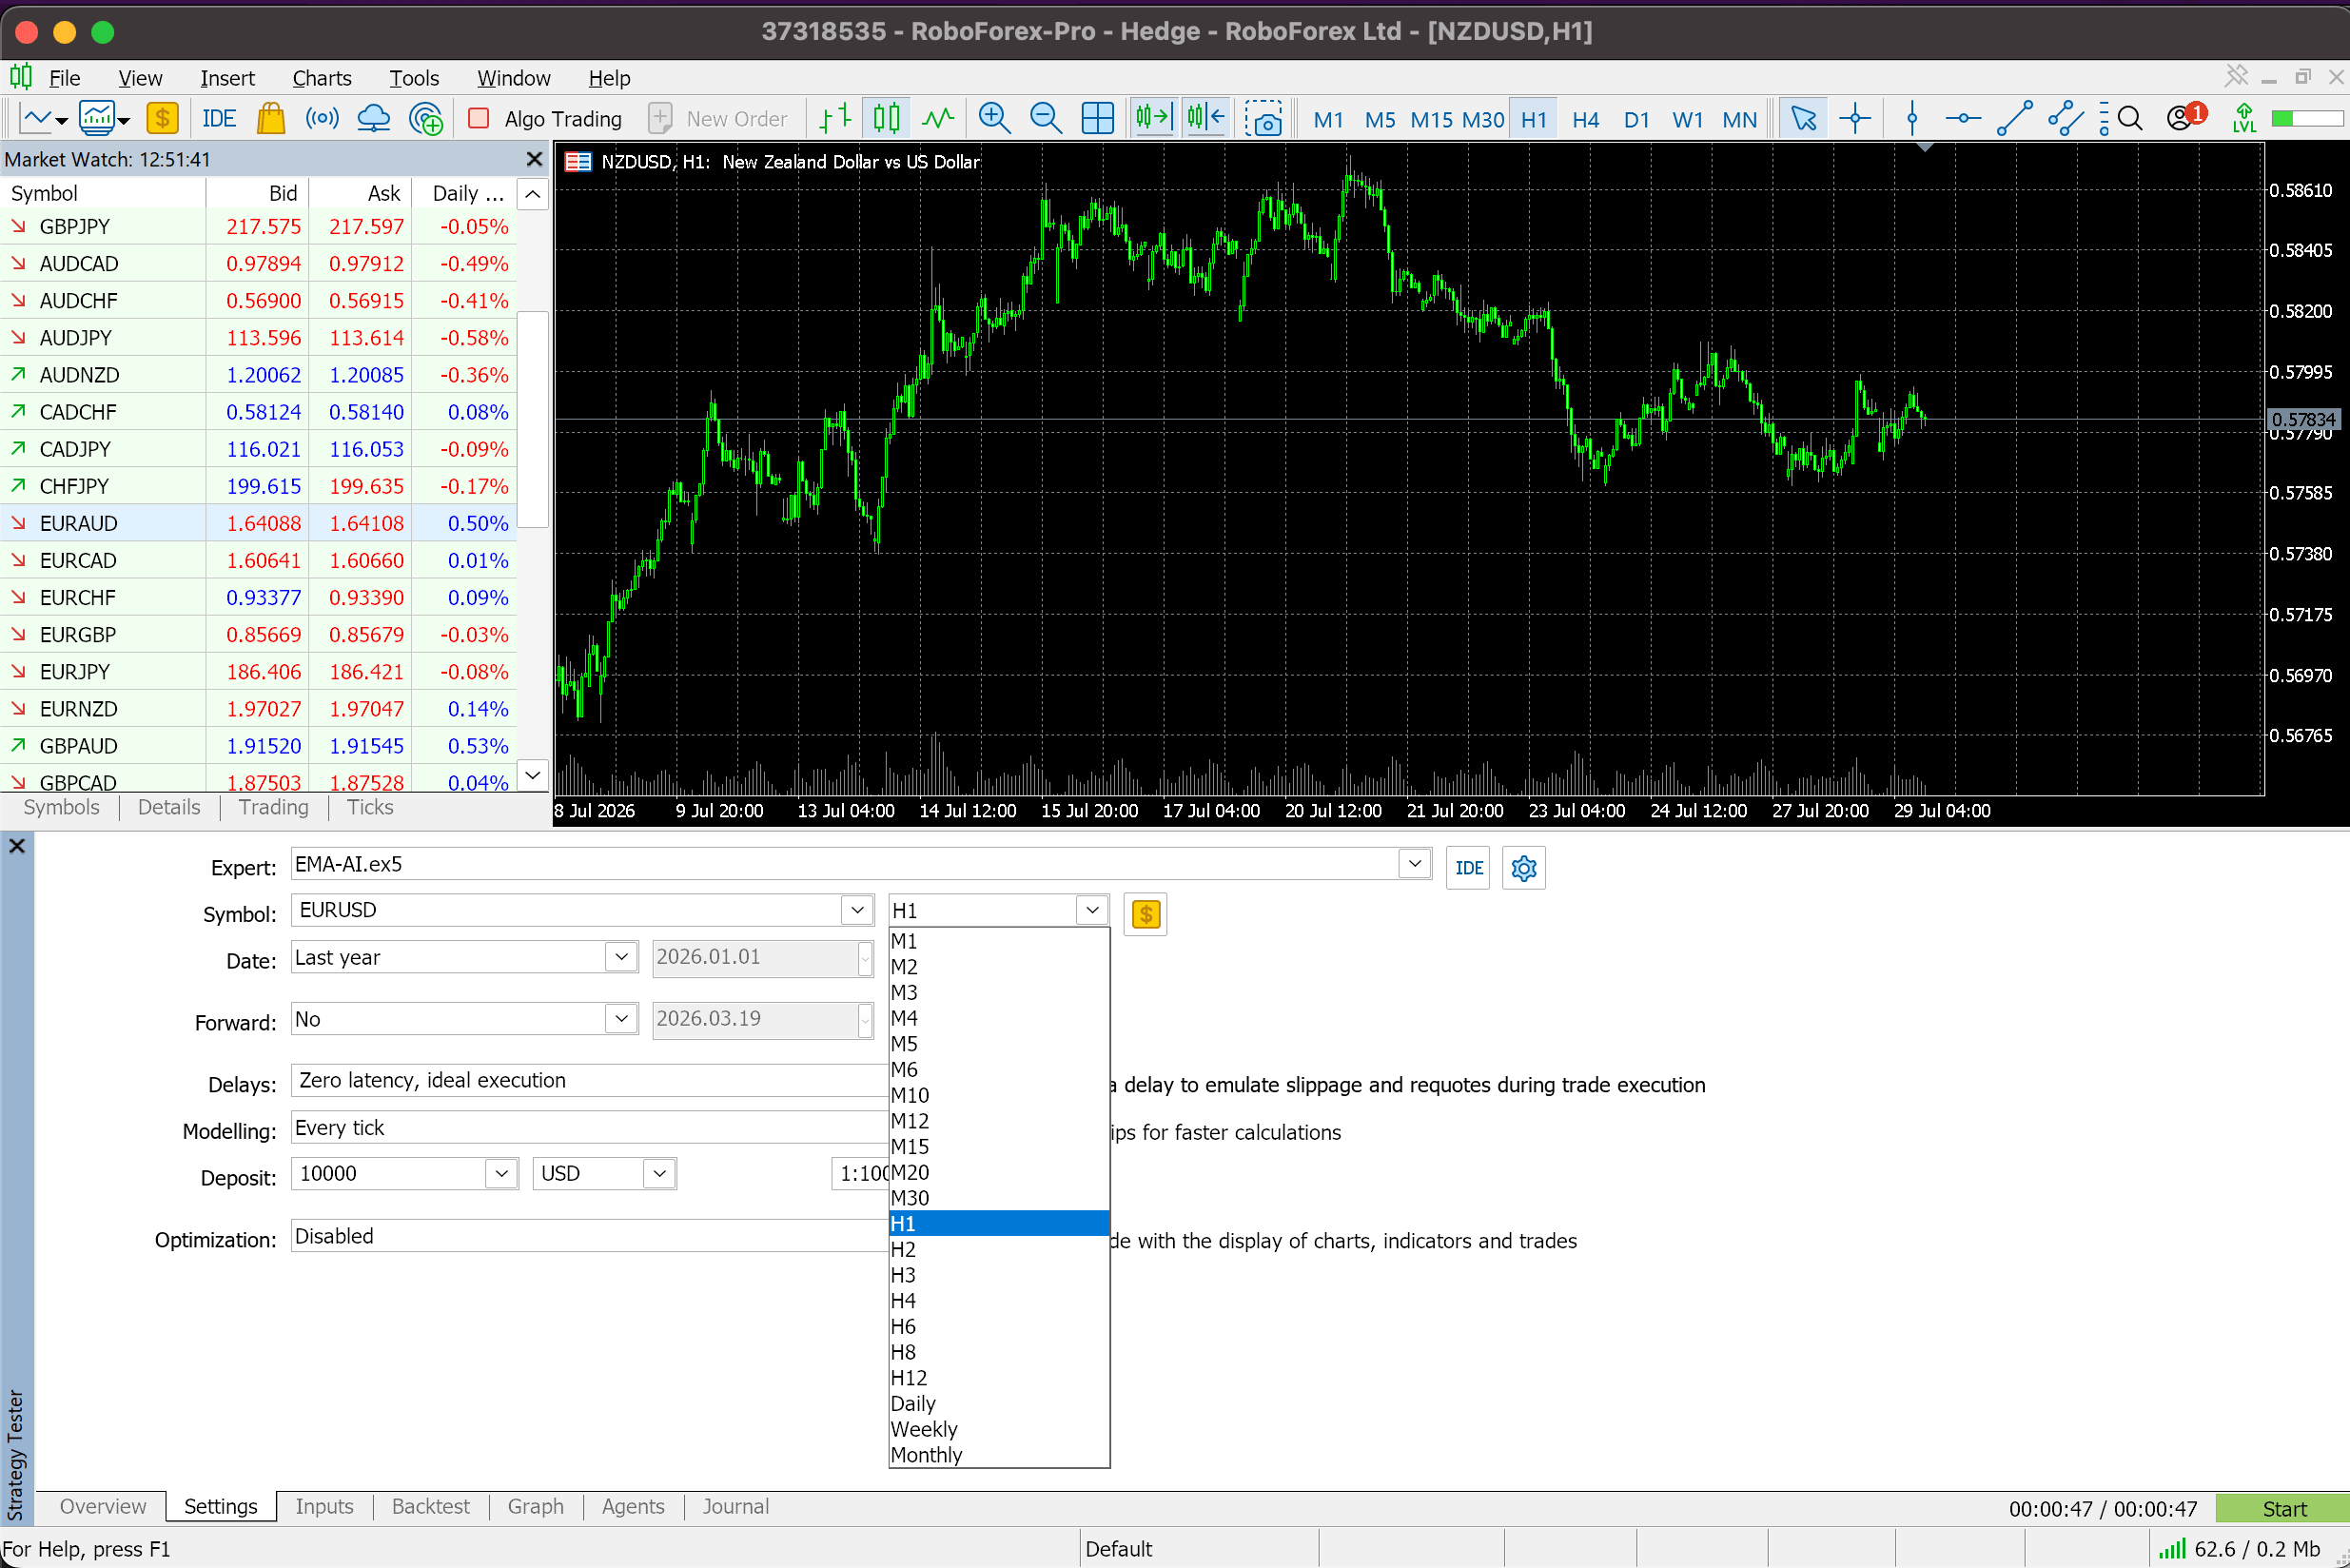
The Timeframe field sets the chart interval the strategy runs on.
Date. The historical period to test against. A period of at least 12 months is recommended for a statistically reliable result, ideally spanning an uptrend, a downtrend, and sideways conditions.
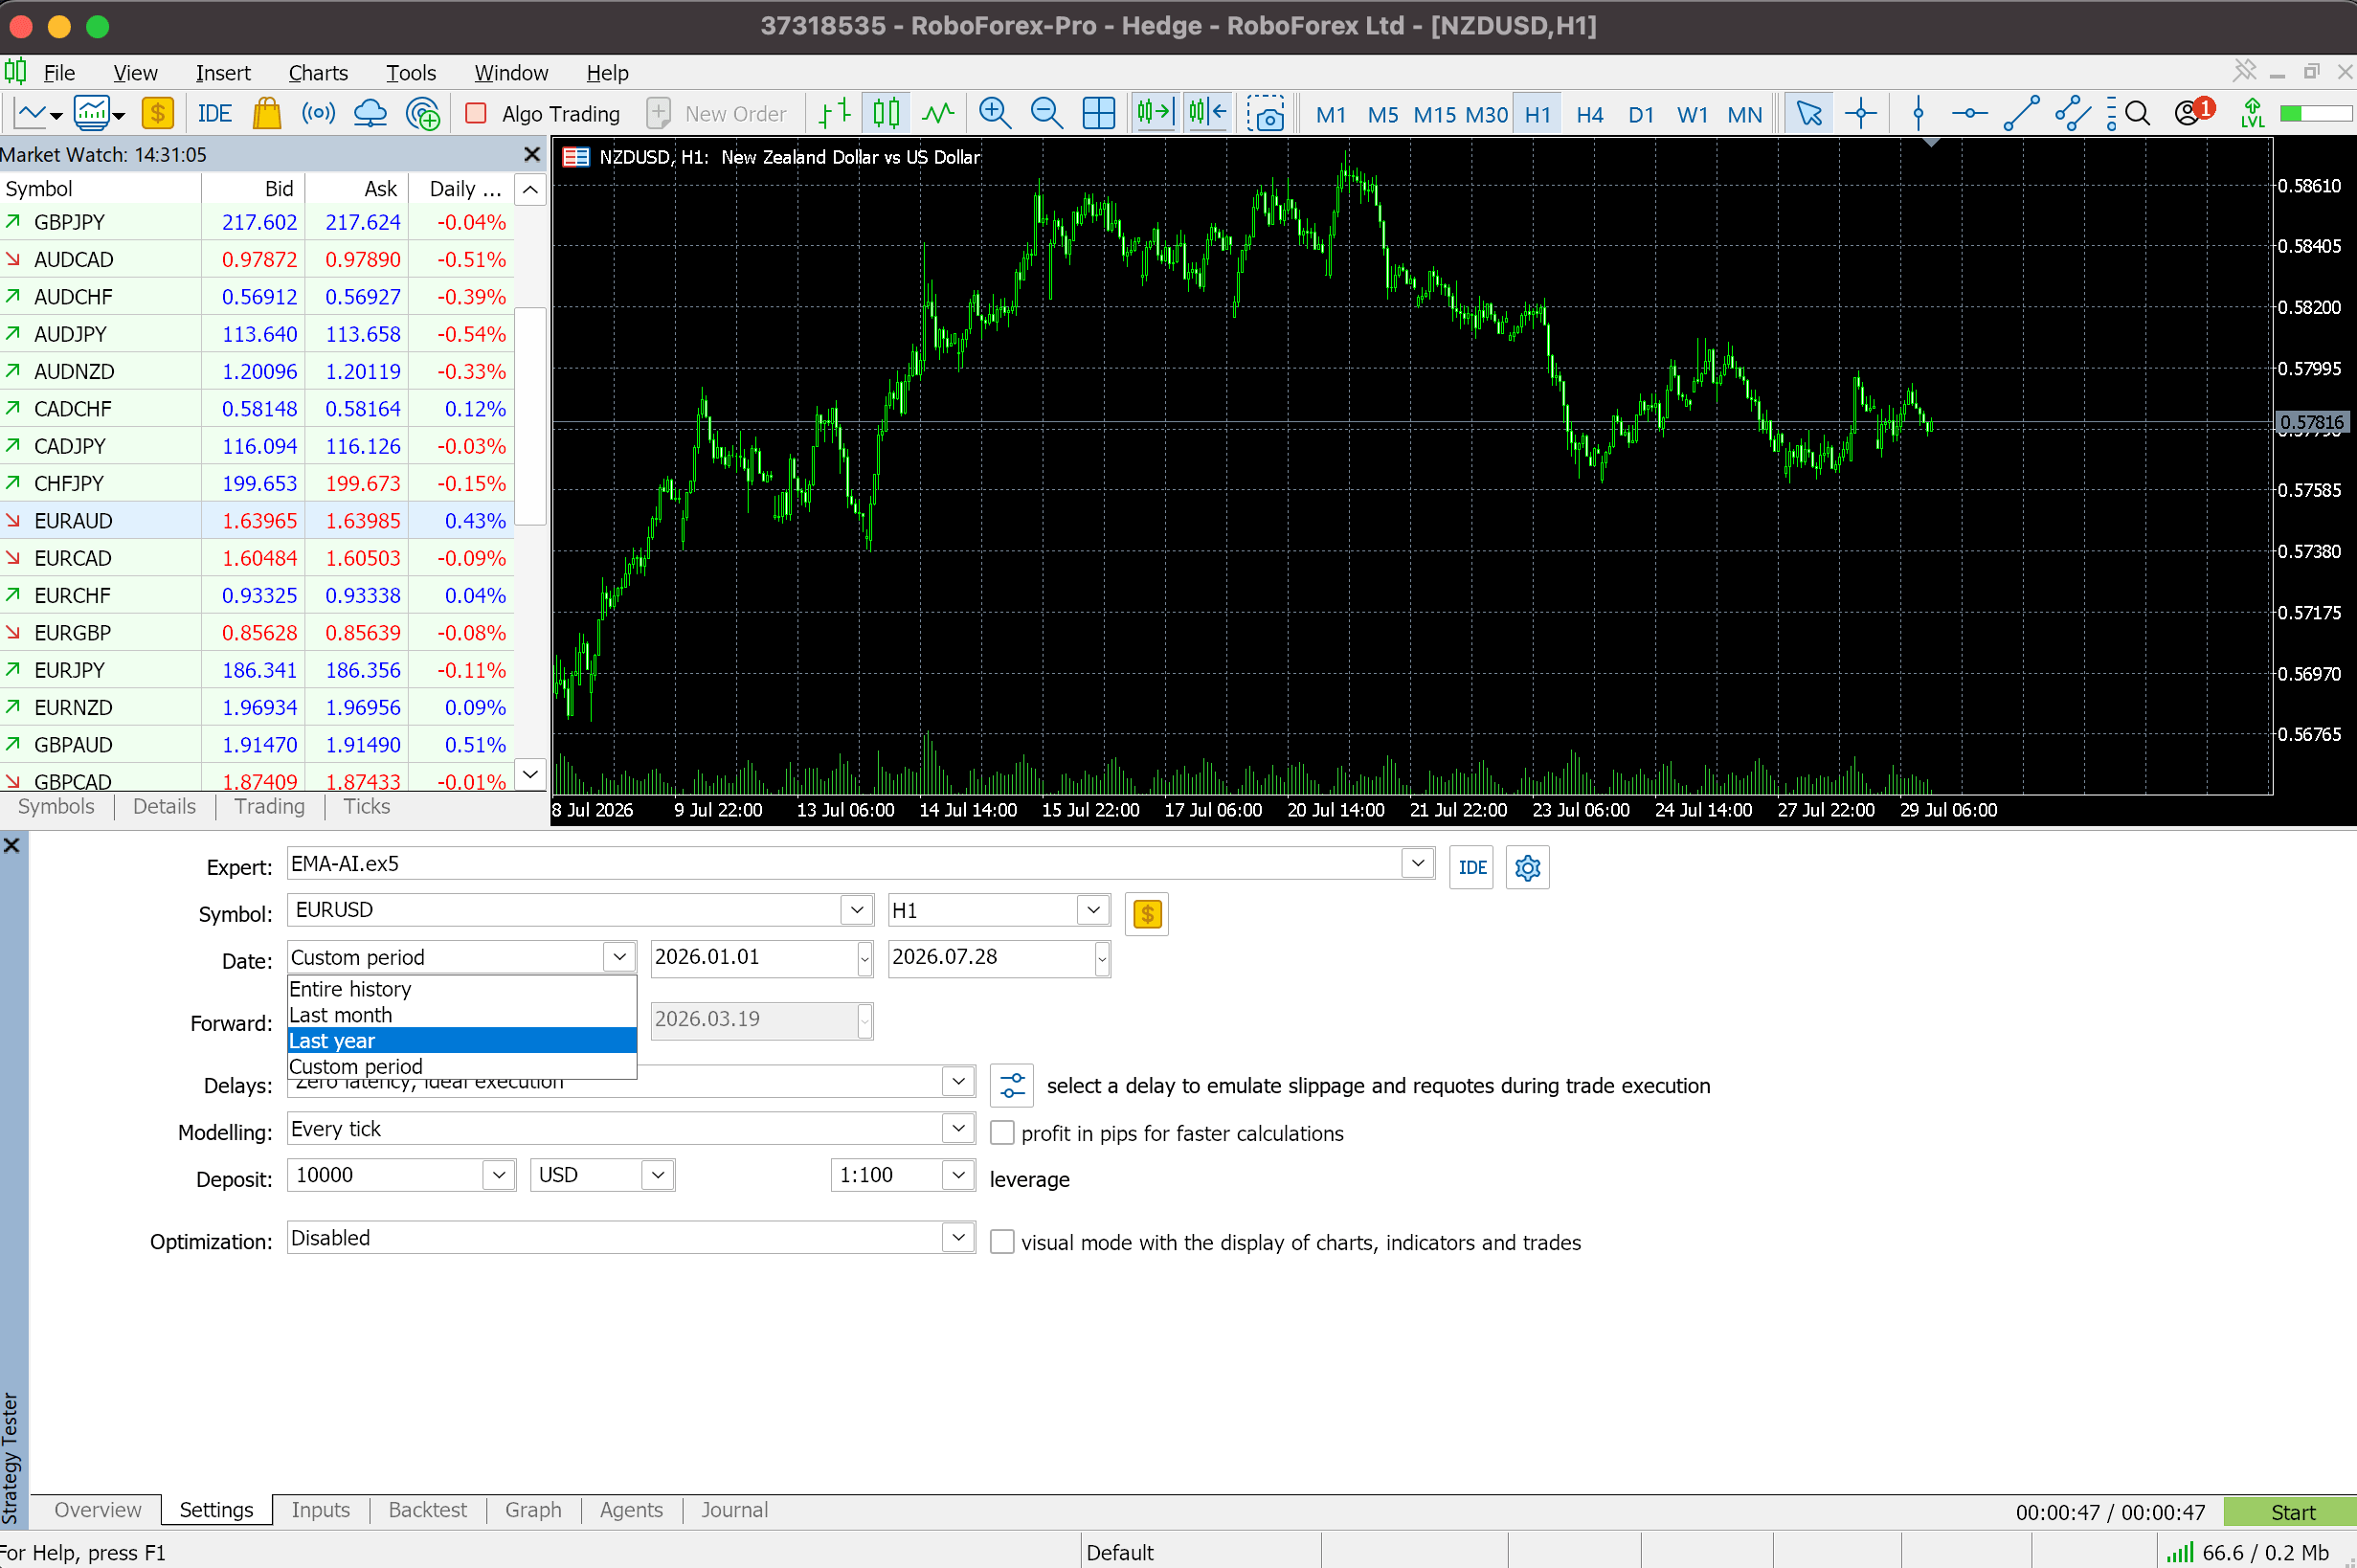
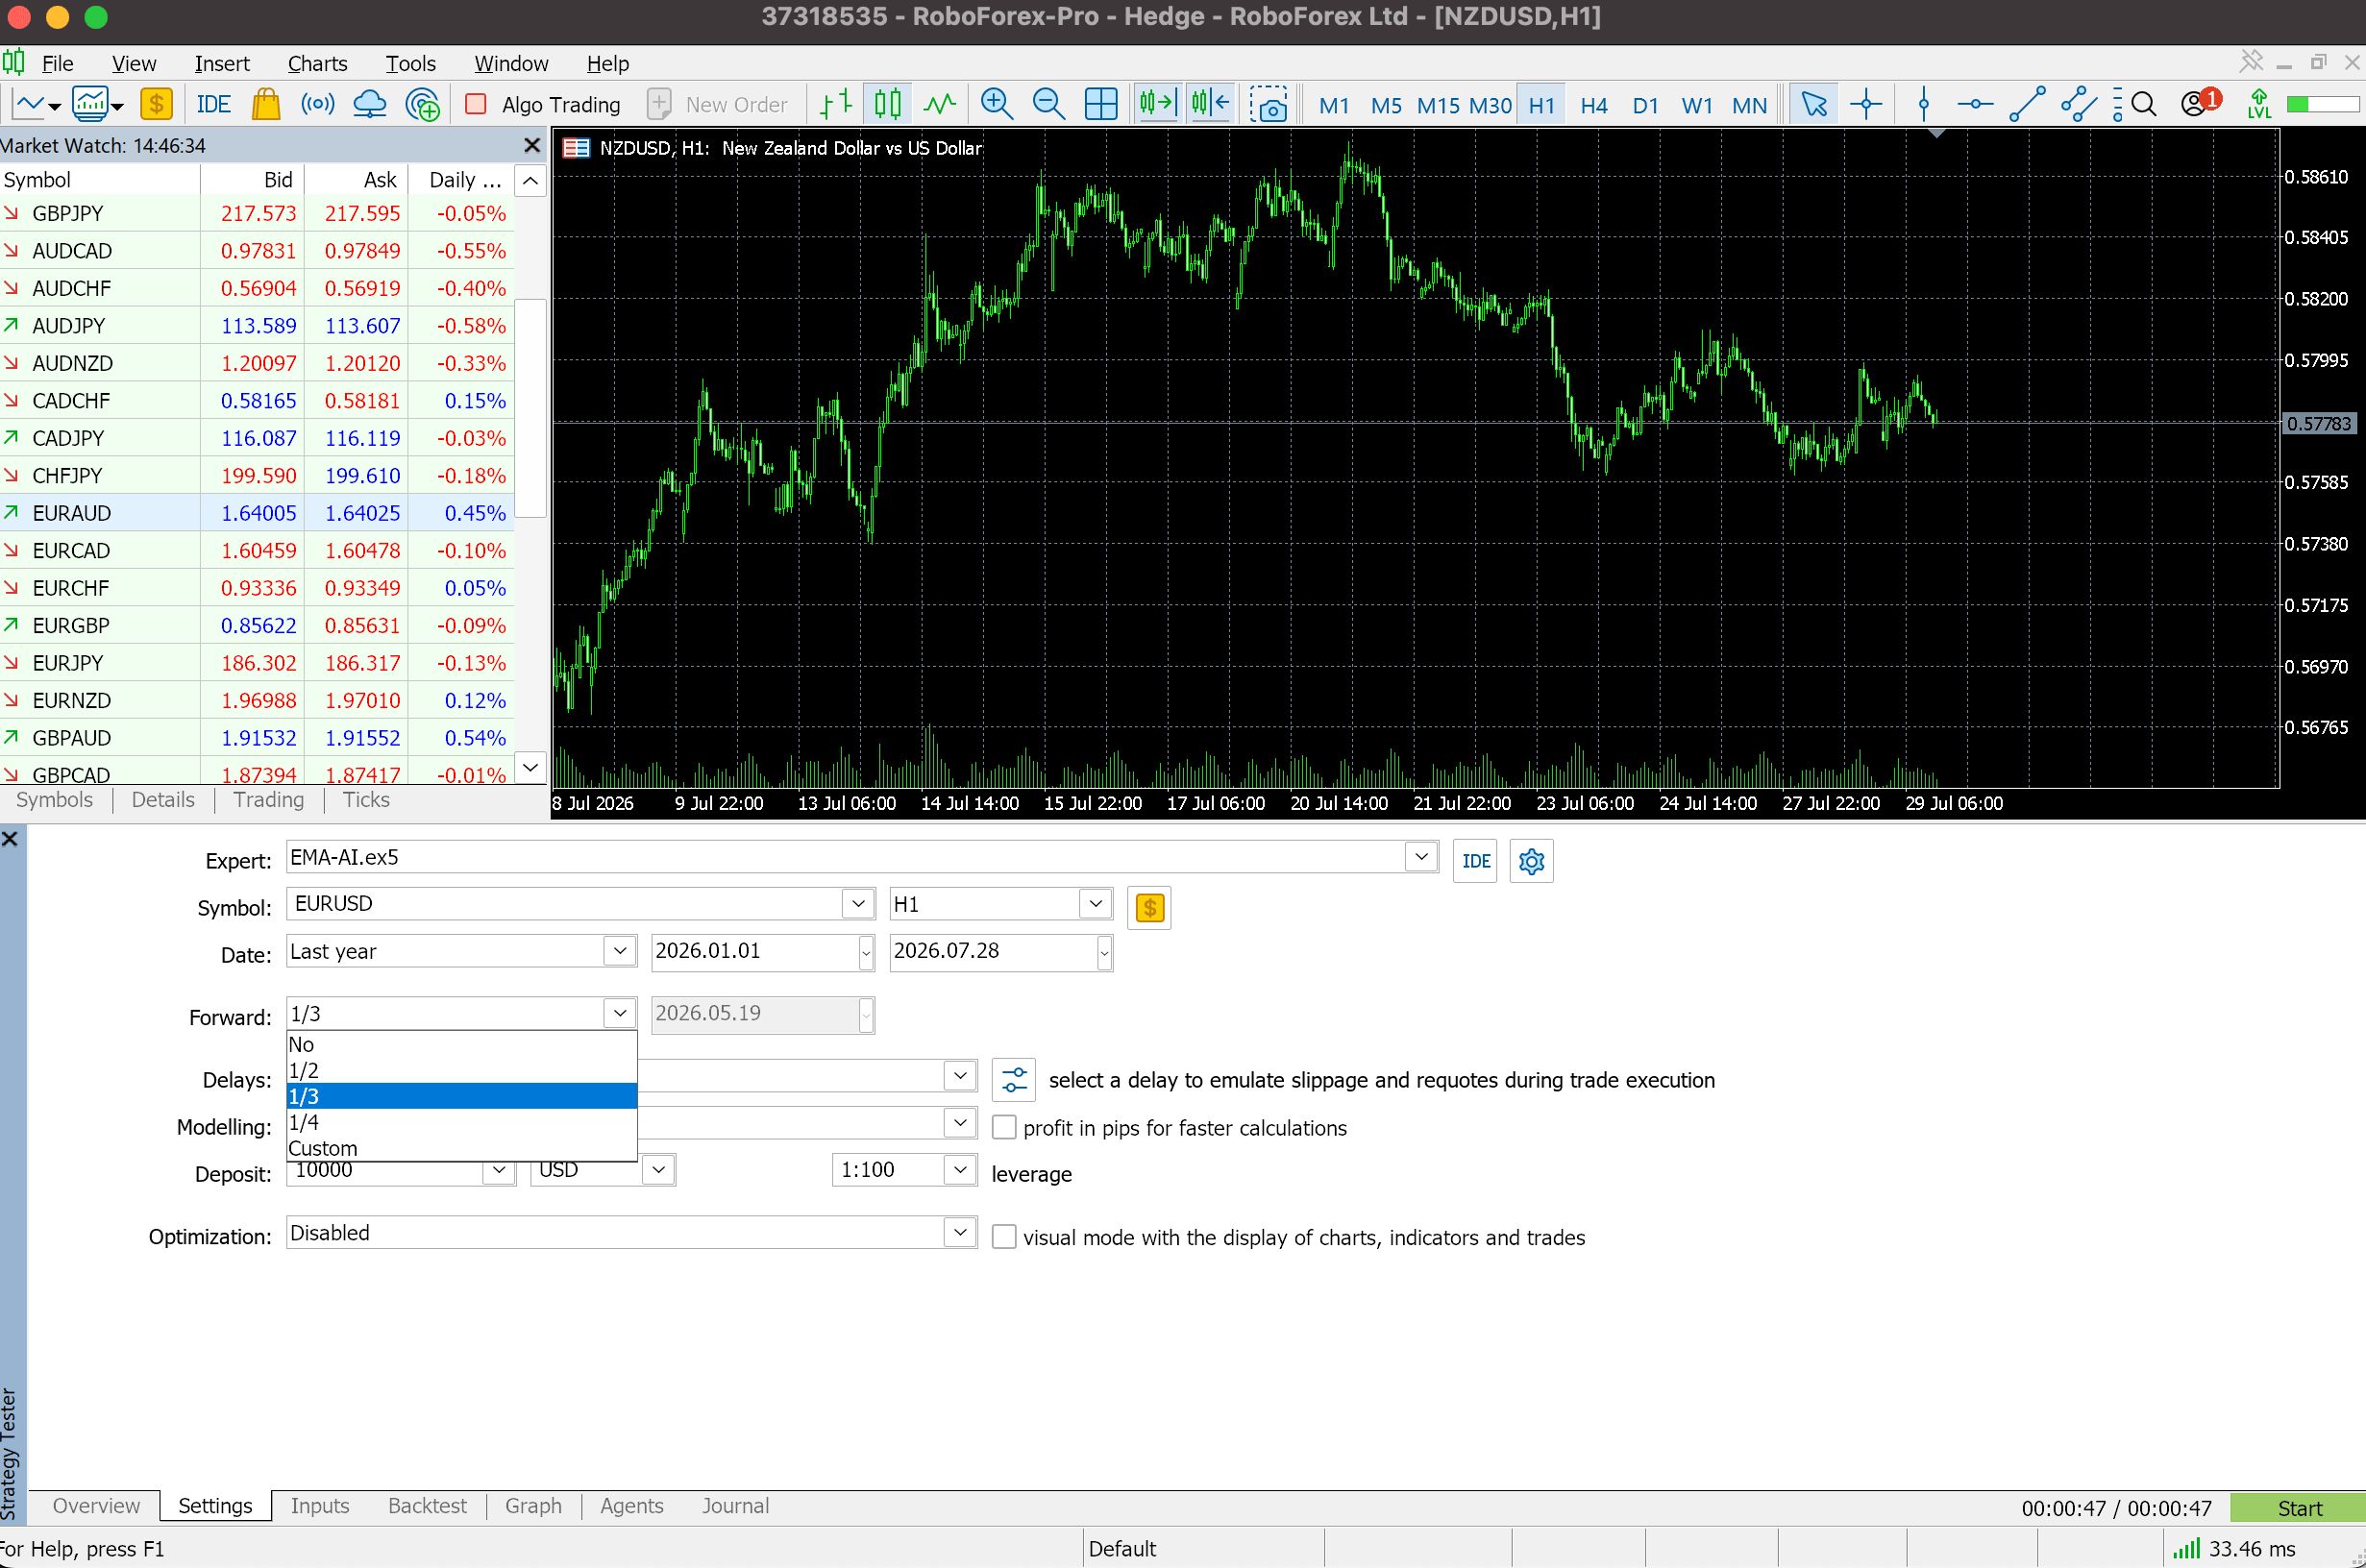
Forward. Splits the historical period into an optimization segment and an independent forward segment used to check the found settings on unseen data, available as 1/2, 1/3, 1/4, or a custom split.
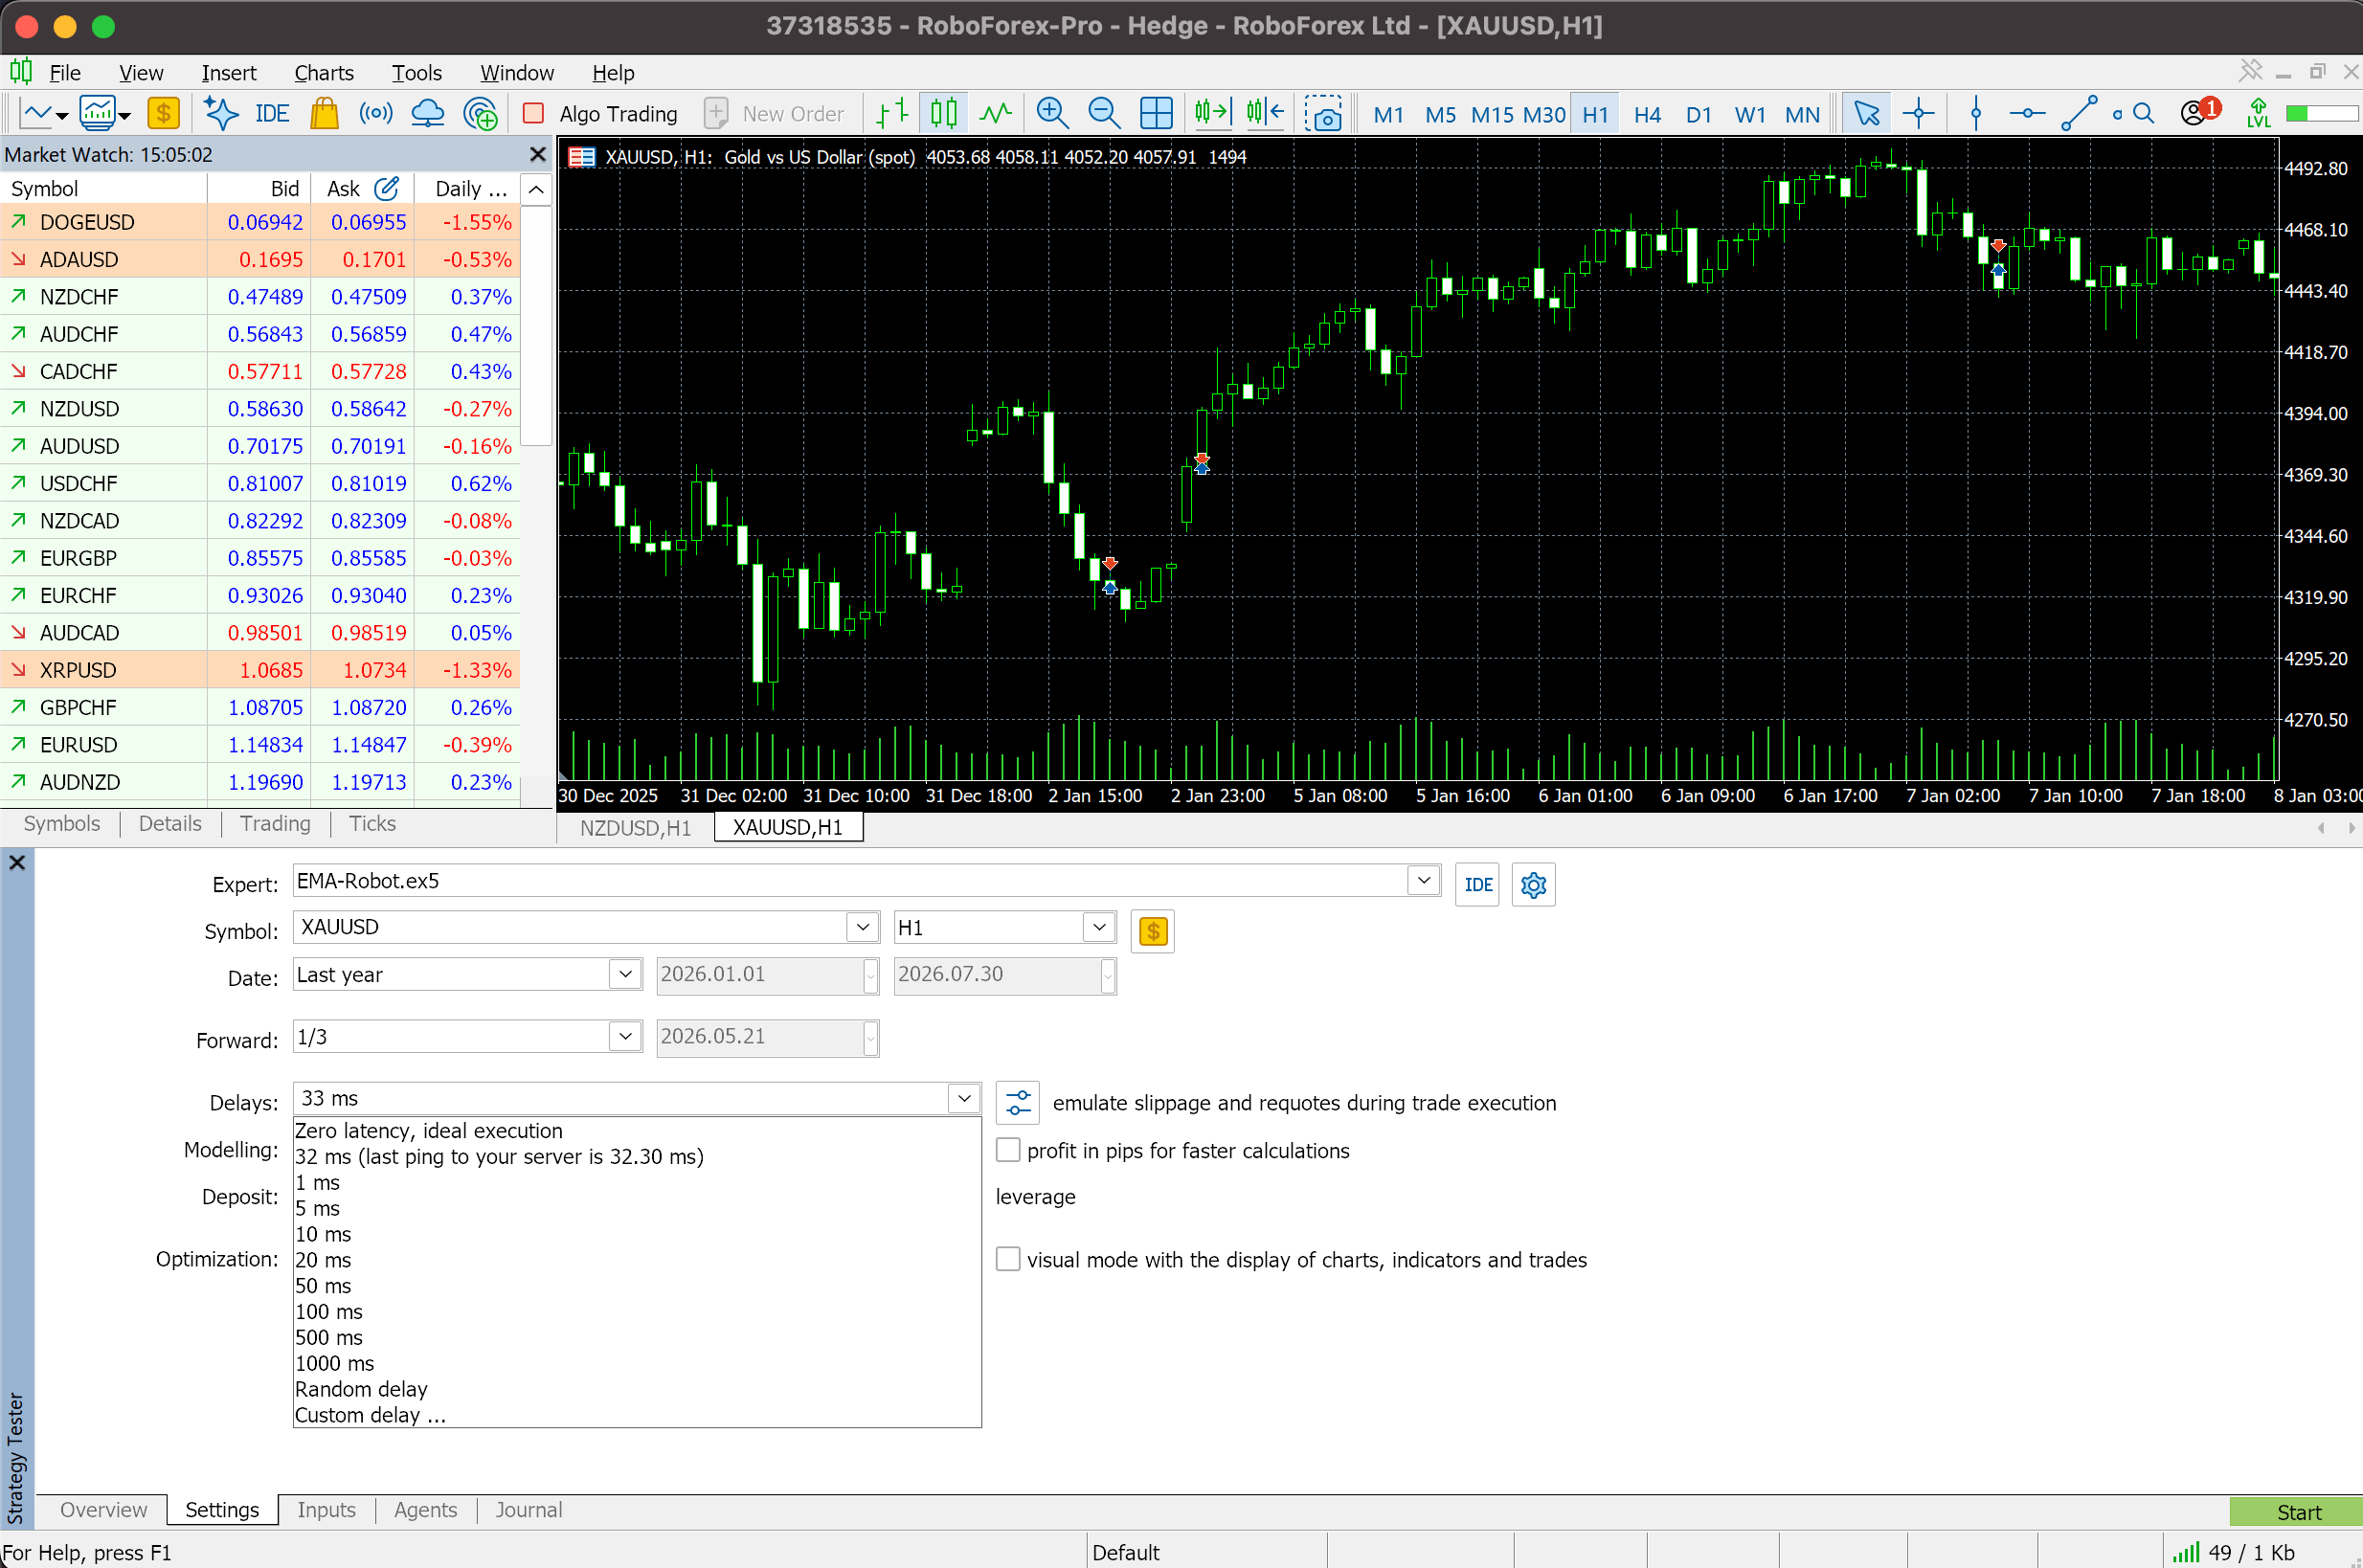
Delays. Models order-execution delay. Zero latency, ideal execution removes delays entirely, which real trading rarely offers; a randomized delay gives a more realistic read on execution speed and slippage.
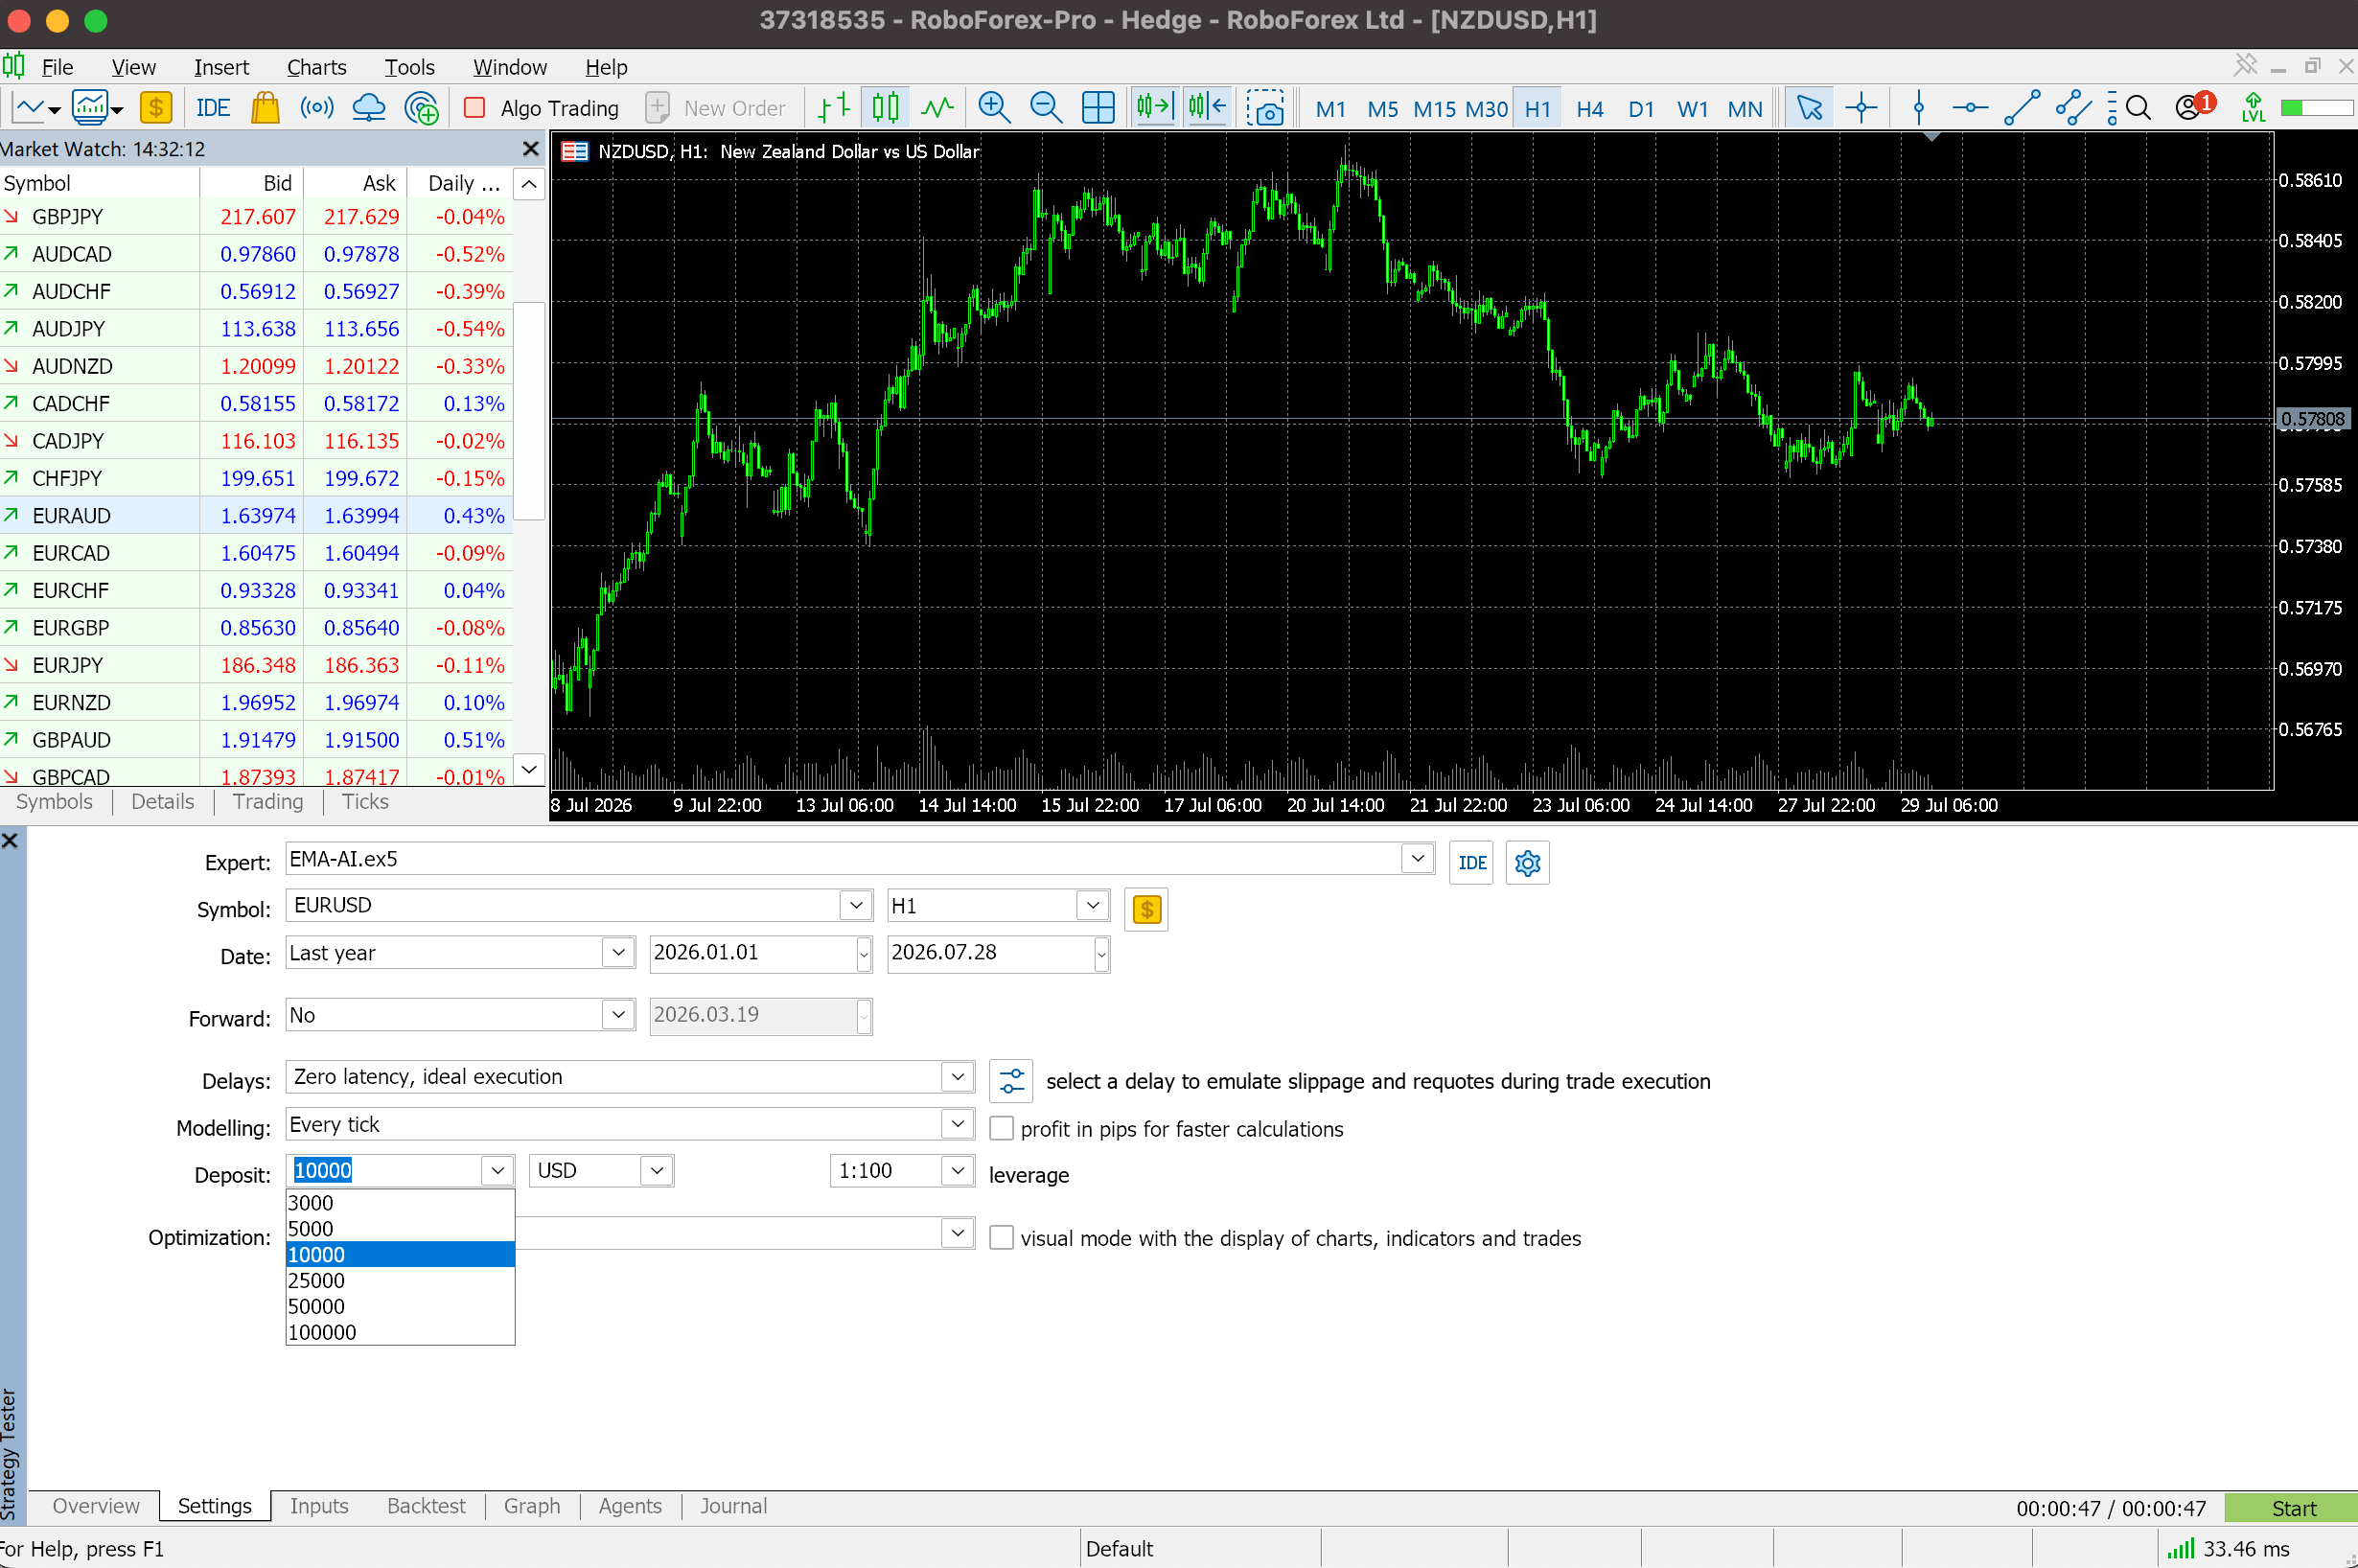
Deposit. The starting balance for the simulation, which affects profit, drawdown, position size, and margin calculations, so set it close to the real account size you plan to trade.
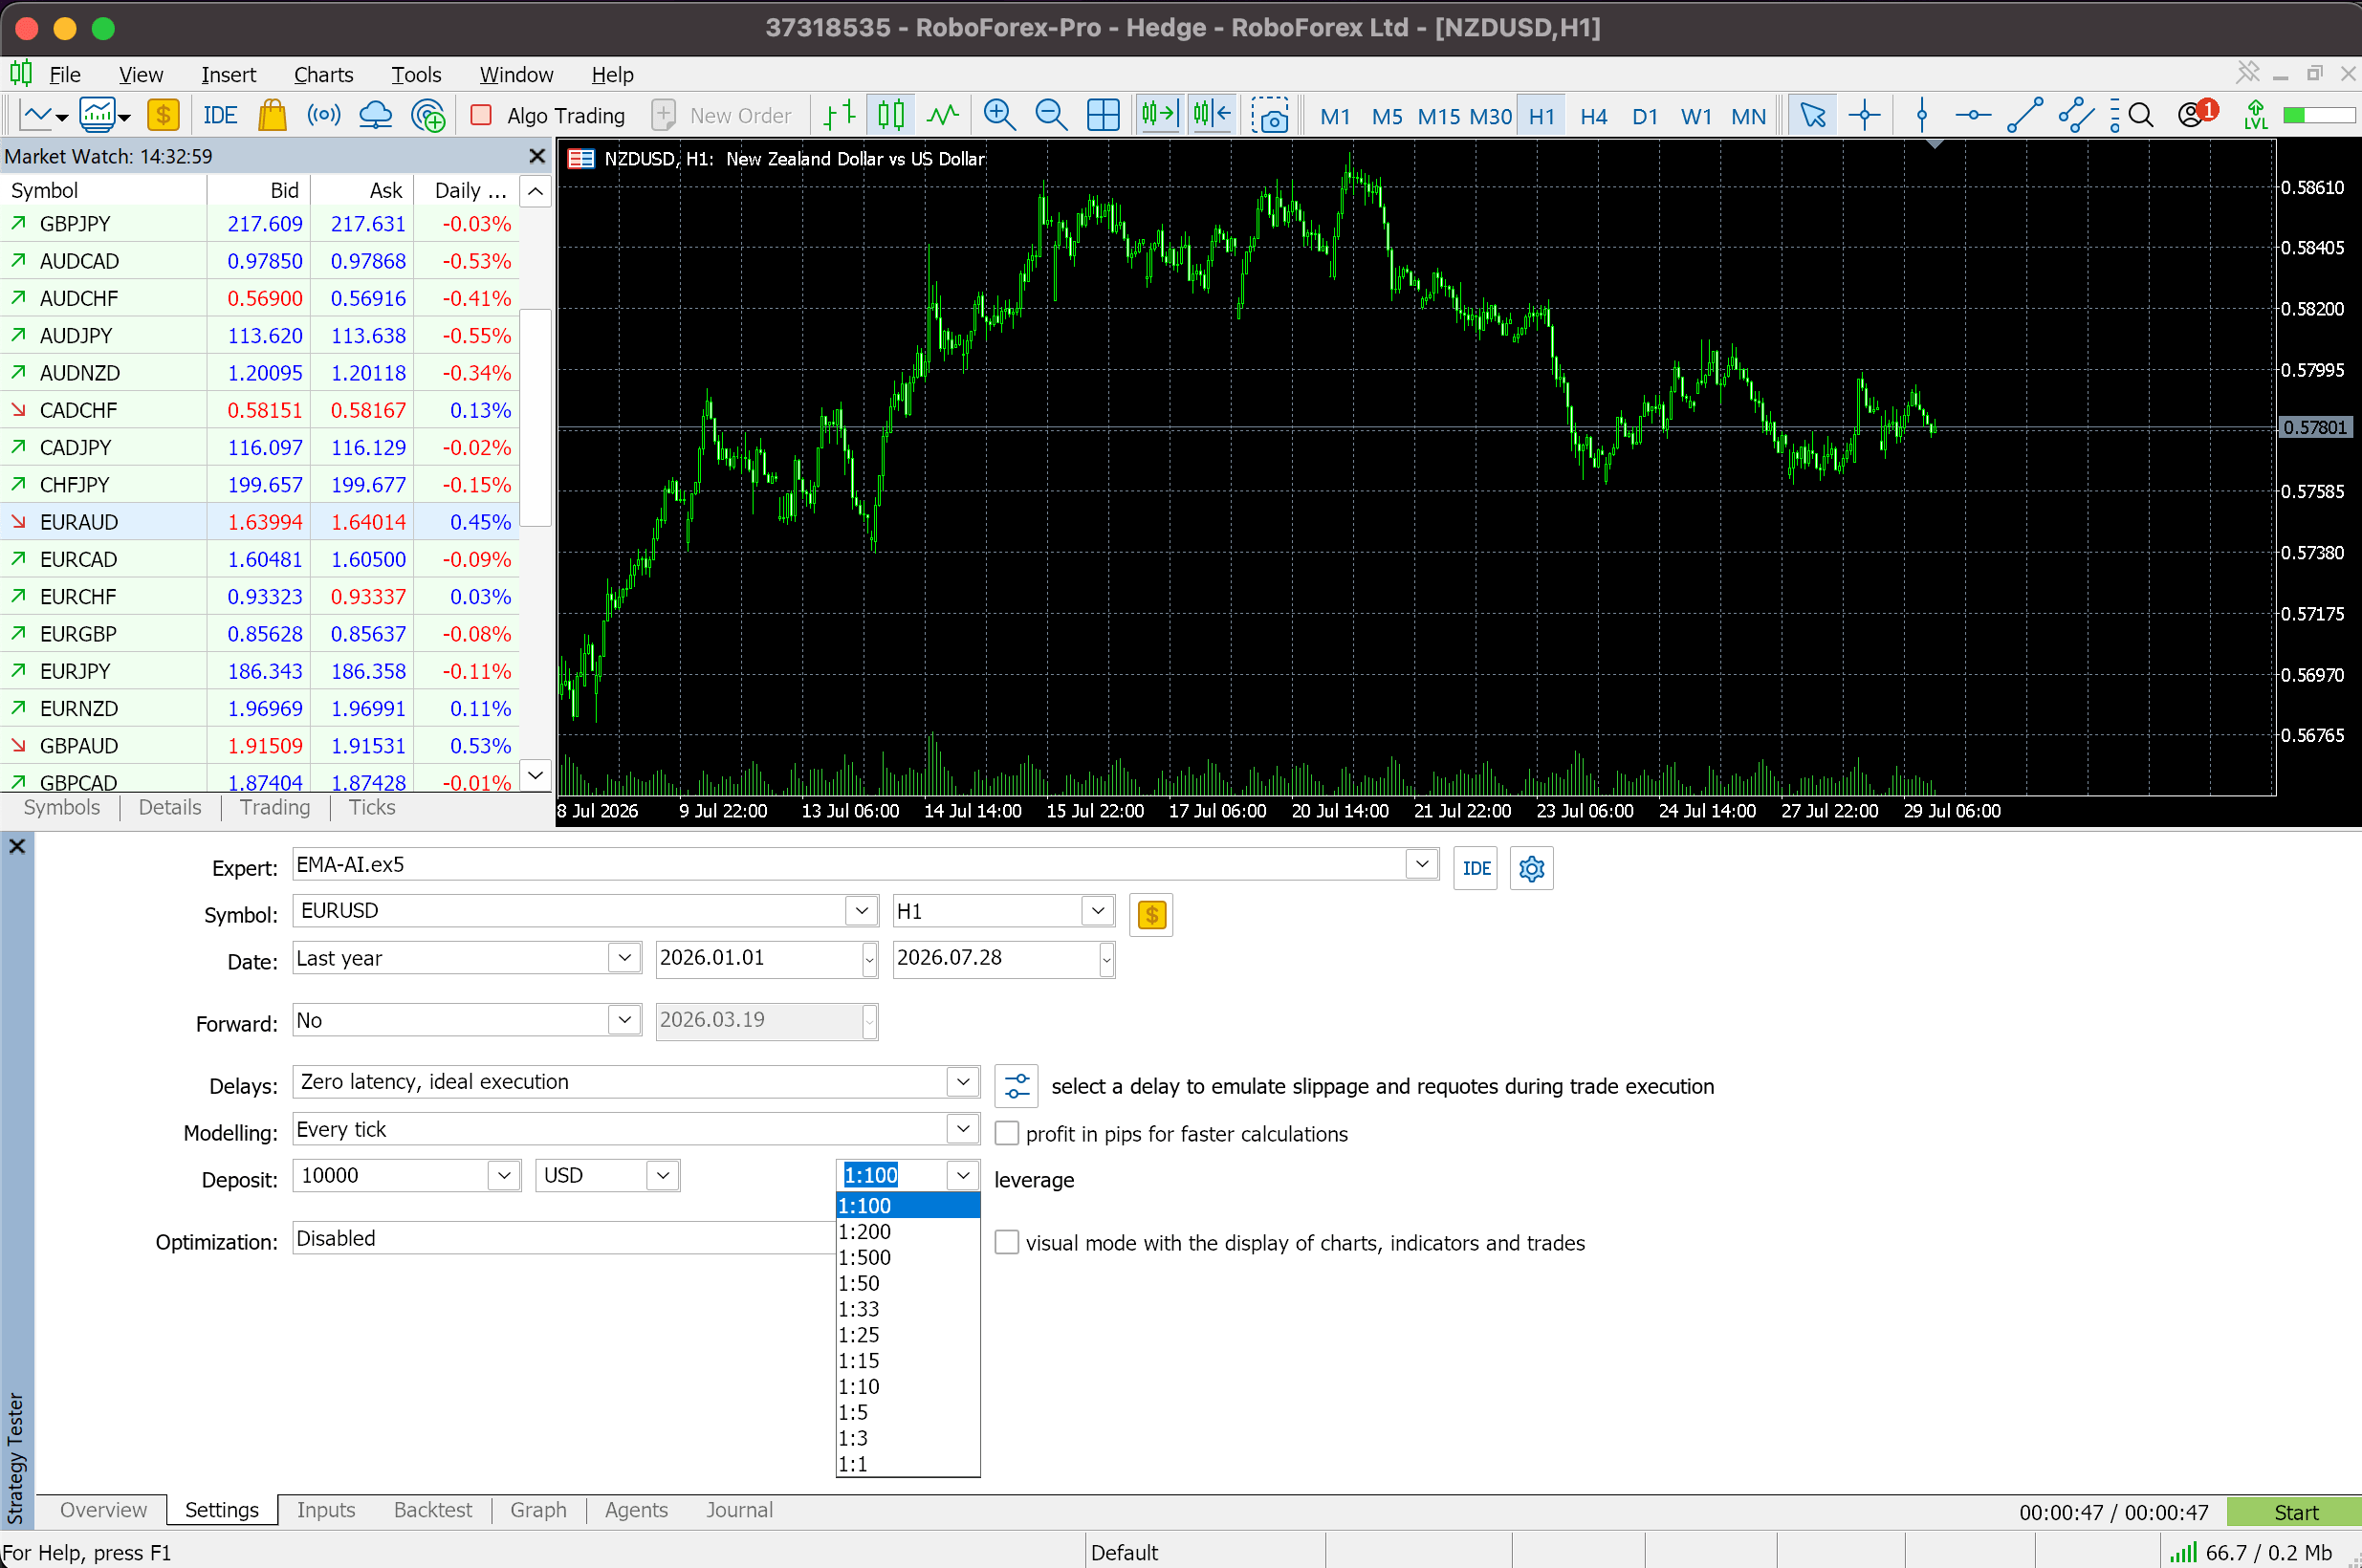
Leverage. The leverage ratio used in the simulation, e.g. 1:100 or 1:500, which should match the real trading account's conditions.
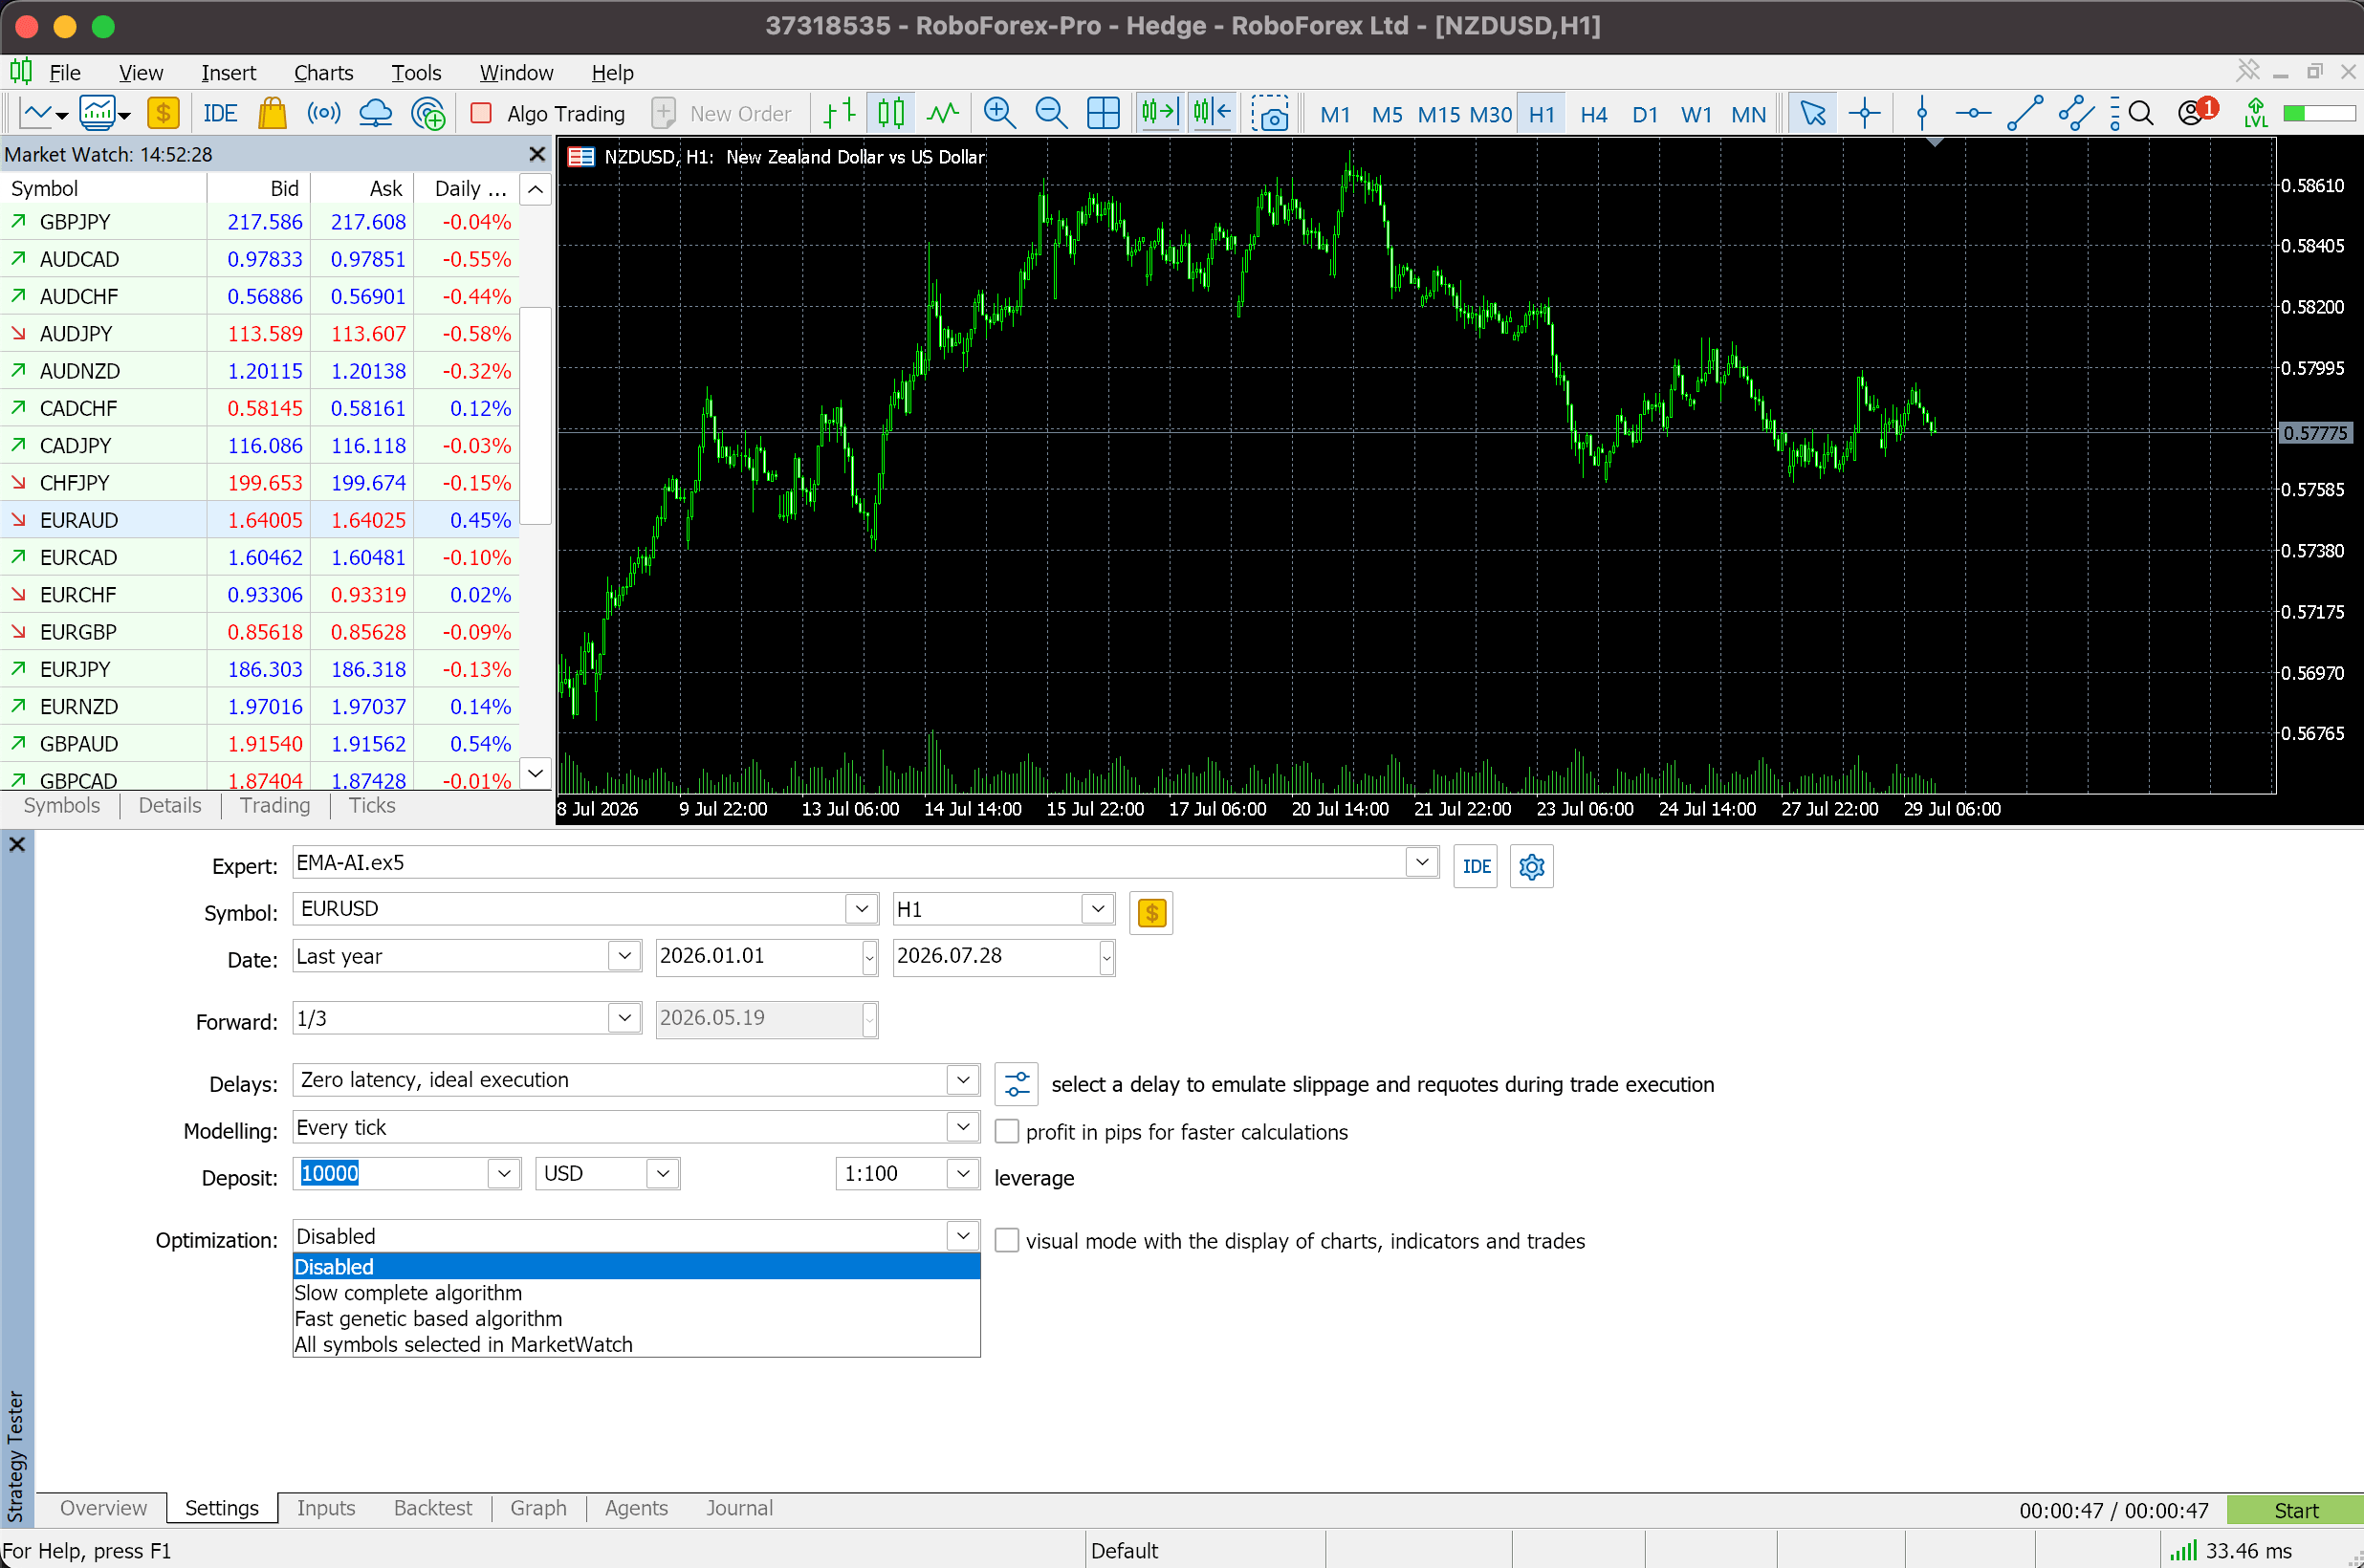
Optimization. Off for a single backtest run; when enabled, the terminal tests many parameter combinations and ranks them by a chosen criterion. A separate Visualization mode shows trades opening and closing directly on the chart as the test runs.
Setting Realistic Trading Conditions: Spread and Execution Delays
One of the main reasons a robot performs beautifully on history but loses money live is testing under conditions that are simply too ideal. Real trades depend not only on the strategy's signals but on spread, order-execution speed, slippage, and connection quality to the trading server, so before running a backtest, the simulation parameters need to be brought as close to real conditions as possible.
Fixed vs. Current Spread
Spread is the gap between the buy price (Ask) and the sell price (Bid), and it directly affects results, especially for strategies with many trades and short holding times. The tester offers two spread modes: Current, which uses live spread conditions, and a fixed value set manually in points.
Why the Wrong Spread Distorts Results
A spread that's too tight or zero hands the robot an advantage it won't have live, especially damaging for scalping strategies, where a few points of difference can flip the entire result. Every real trade starts at a loss because of the spread: a buy opens at Ask and closes at Bid. A strategy that's only profitable at minimal trading costs can turn unprofitable under real conditions.
The fix is to use a spread as close as possible to the broker's average for the chosen instrument; if quality historical spread data isn't available, a fixed spread matching typical real conditions can be set manually.
Emulating Execution Delays
In live trading, a measurable amount of time passes between sending an order from the terminal and its execution on the broker's server. During those milliseconds, the price can move, and the trade fills at a different price. This is slippage. Zero latency, ideal execution removes this entirely, which is convenient for an initial logic check but can inflate results. For a more objective read on a robot's resilience, use modeled execution delay or the real measured ping to the trading server, when available. This shows whether the strategy holds up under less-than-ideal conditions or depends too heavily on instant execution.
Comparing MetaTrader 5 Modeling Modes
Before running a backtest, the Modelling field in the Strategy Tester sets how price movement is simulated. The chosen mode determines test speed, how much historical data is used, and how accurately the robot's behavior is evaluated.
| Modeling Mode | Accuracy | Speed | When to Use |
|---|---|---|---|
| Every tick based on real ticks | Maximum, uses real tick data | Slowest, due to the volume of calculations | Final check before a live launch; recommended for scalping strategies, high-frequency robots, and systems sensitive to entry precision |
| Every tick | High, though some ticks are algorithmically modeled | Medium | Testing most robots where reasonably accurate price modeling is needed without a full real-tick data set |
| 1 minute OHLC | Medium, uses only the four values of a one-minute candle | Fast | Quick checks on strategies with relatively infrequent trades and long holding times |
| Open prices only | Low, the EA only receives data on a new candle's open | Very fast | Initial logic checks, filtering out unworkable settings, and scanning large numbers of variants quickly |
| Math calculations | Not intended for full trading simulation | Maximum | Running optimization calculations where real trade and price-movement simulation isn't required |
For a final assessment, Every tick based on real ticks is the recommended mode, since it reflects real historical price changes most closely, which matters most for scalpers, volatile-instrument strategies, and algorithms where a few points of price change affect the outcome. Faster modes are useful for early-stage idea testing and optimization, but final profitability conclusions should come only from a test on the highest-quality data available.
Visualization Mode: Spotting Logical Errors
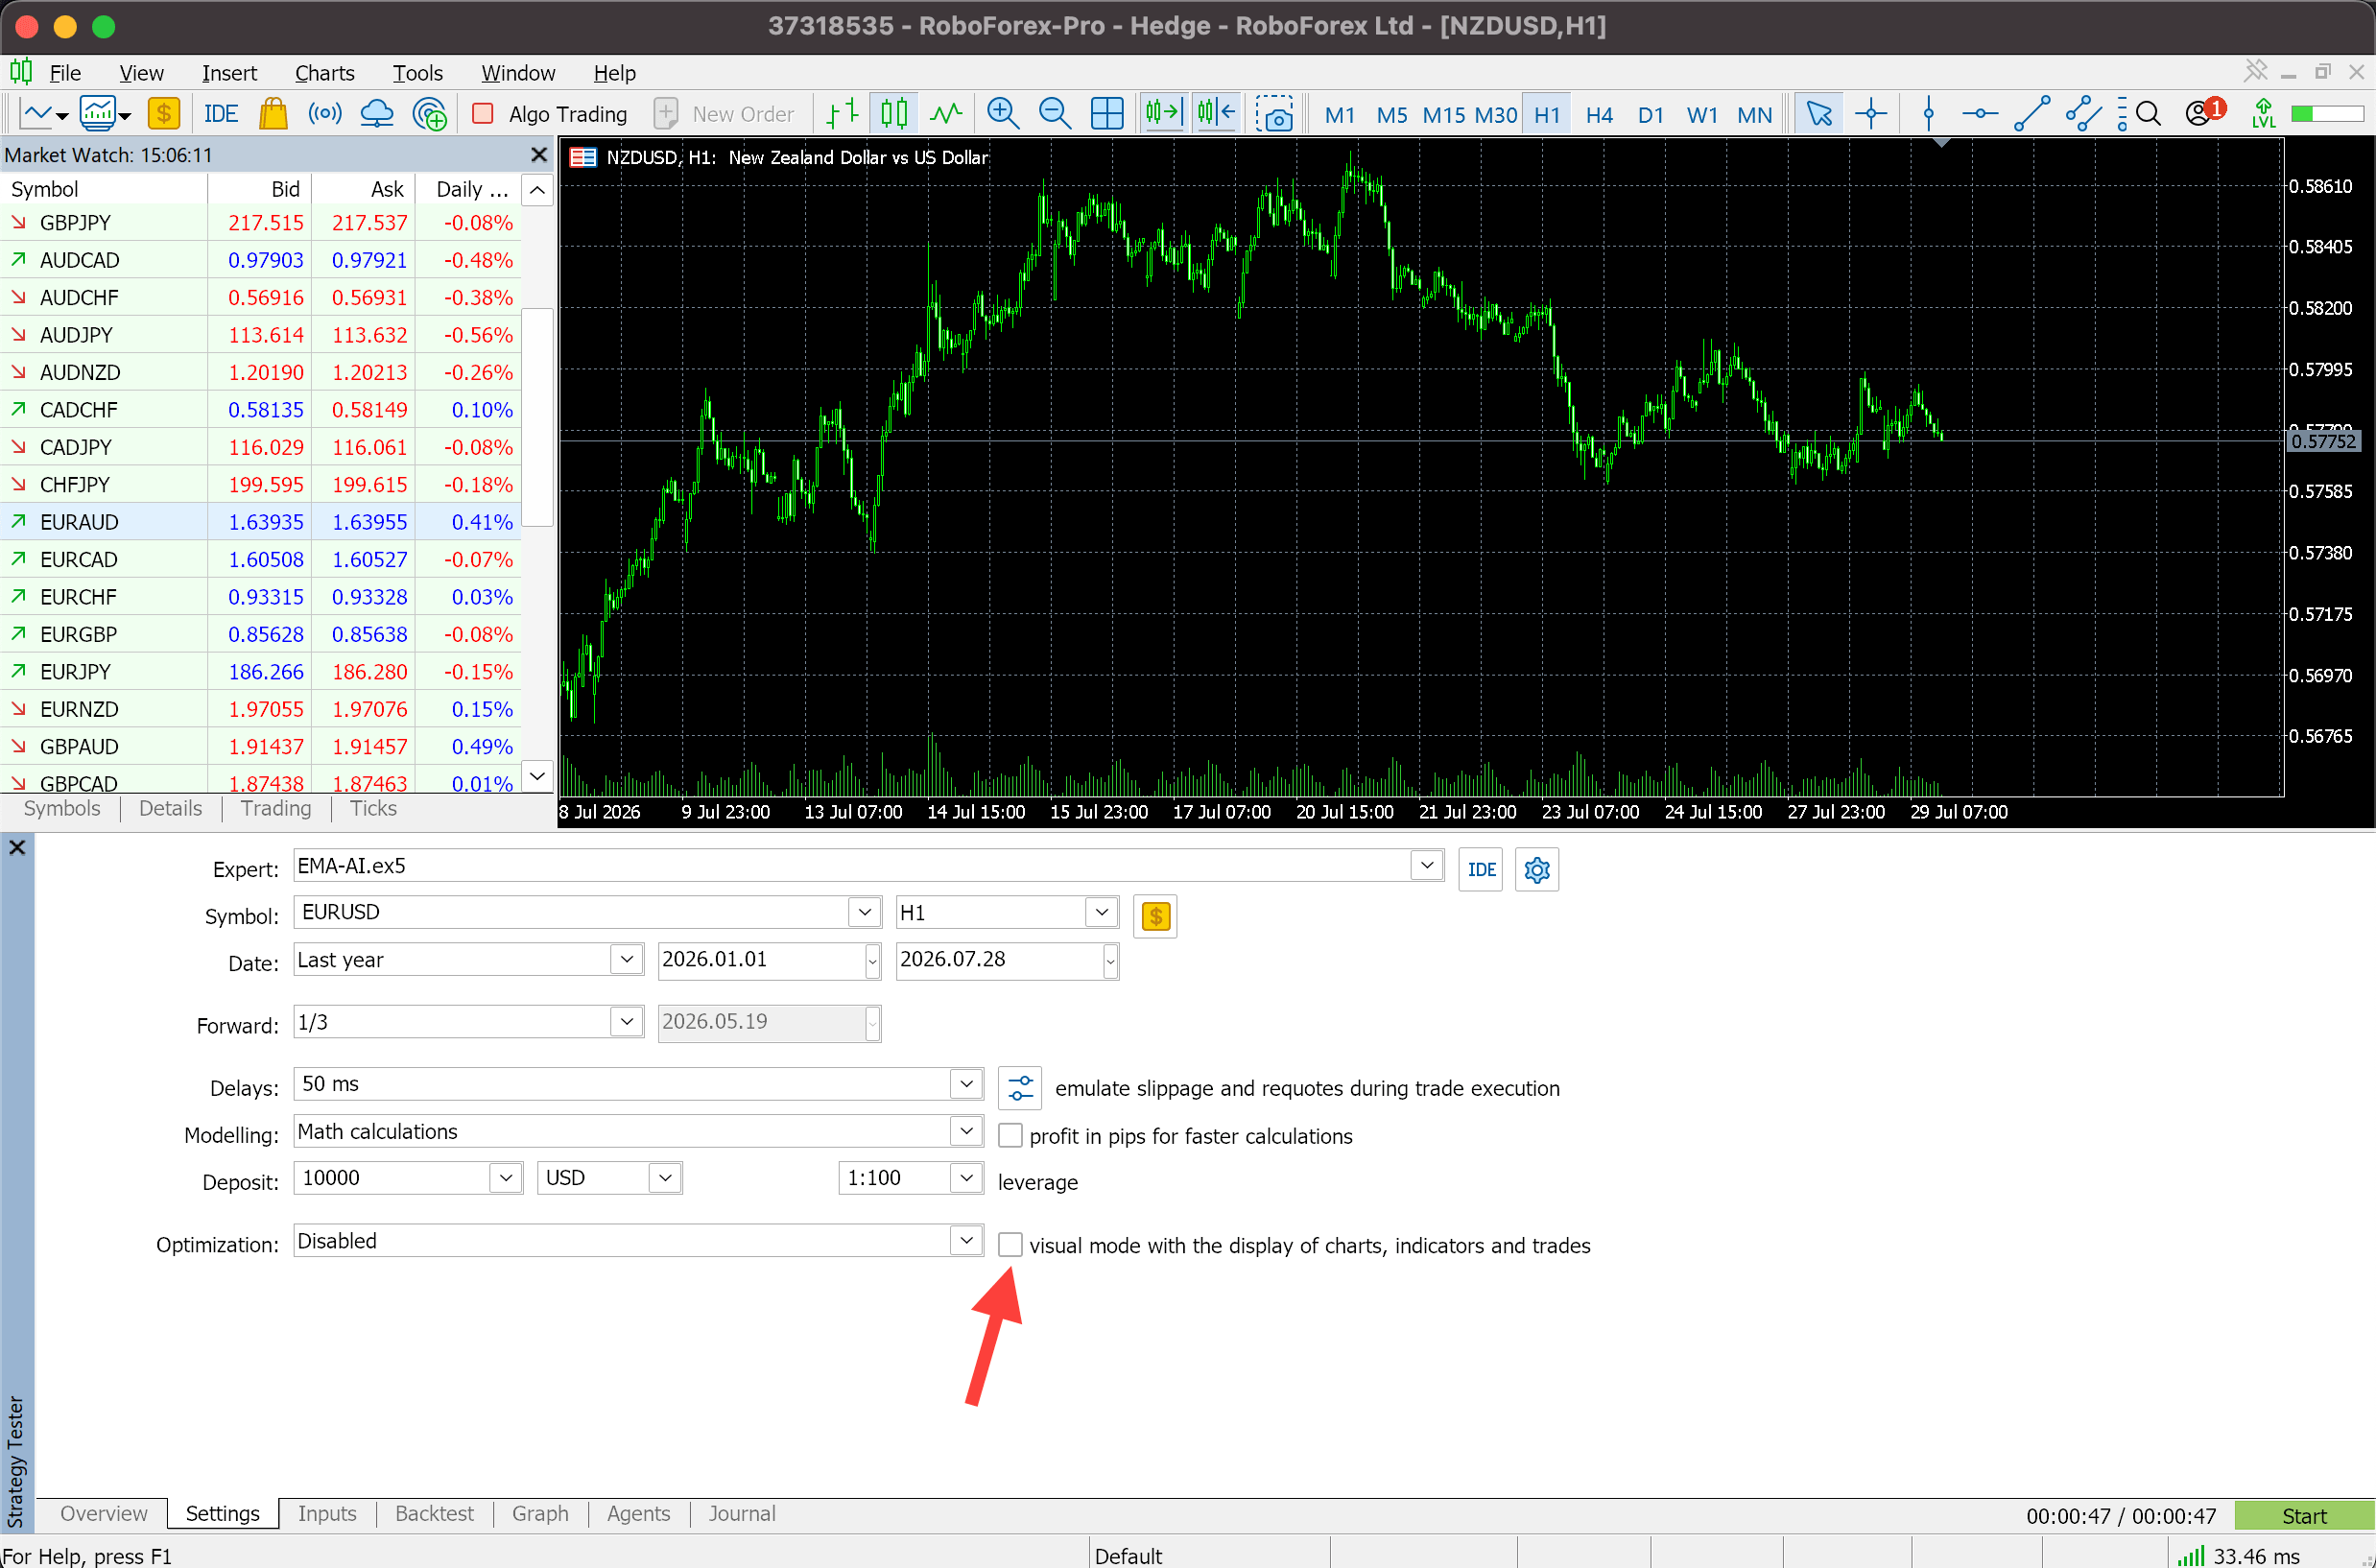
Visualization mode opens a separate window showing historical price movement, letting a trader watch candles form, indicators update, and positions open and close, along with stop-loss and take-profit placement. It's especially useful during development and debugging, helping catch errors such as trades opening in the wrong direction, duplicate positions on the same signal, misread indicator signals, or orders closing incorrectly.
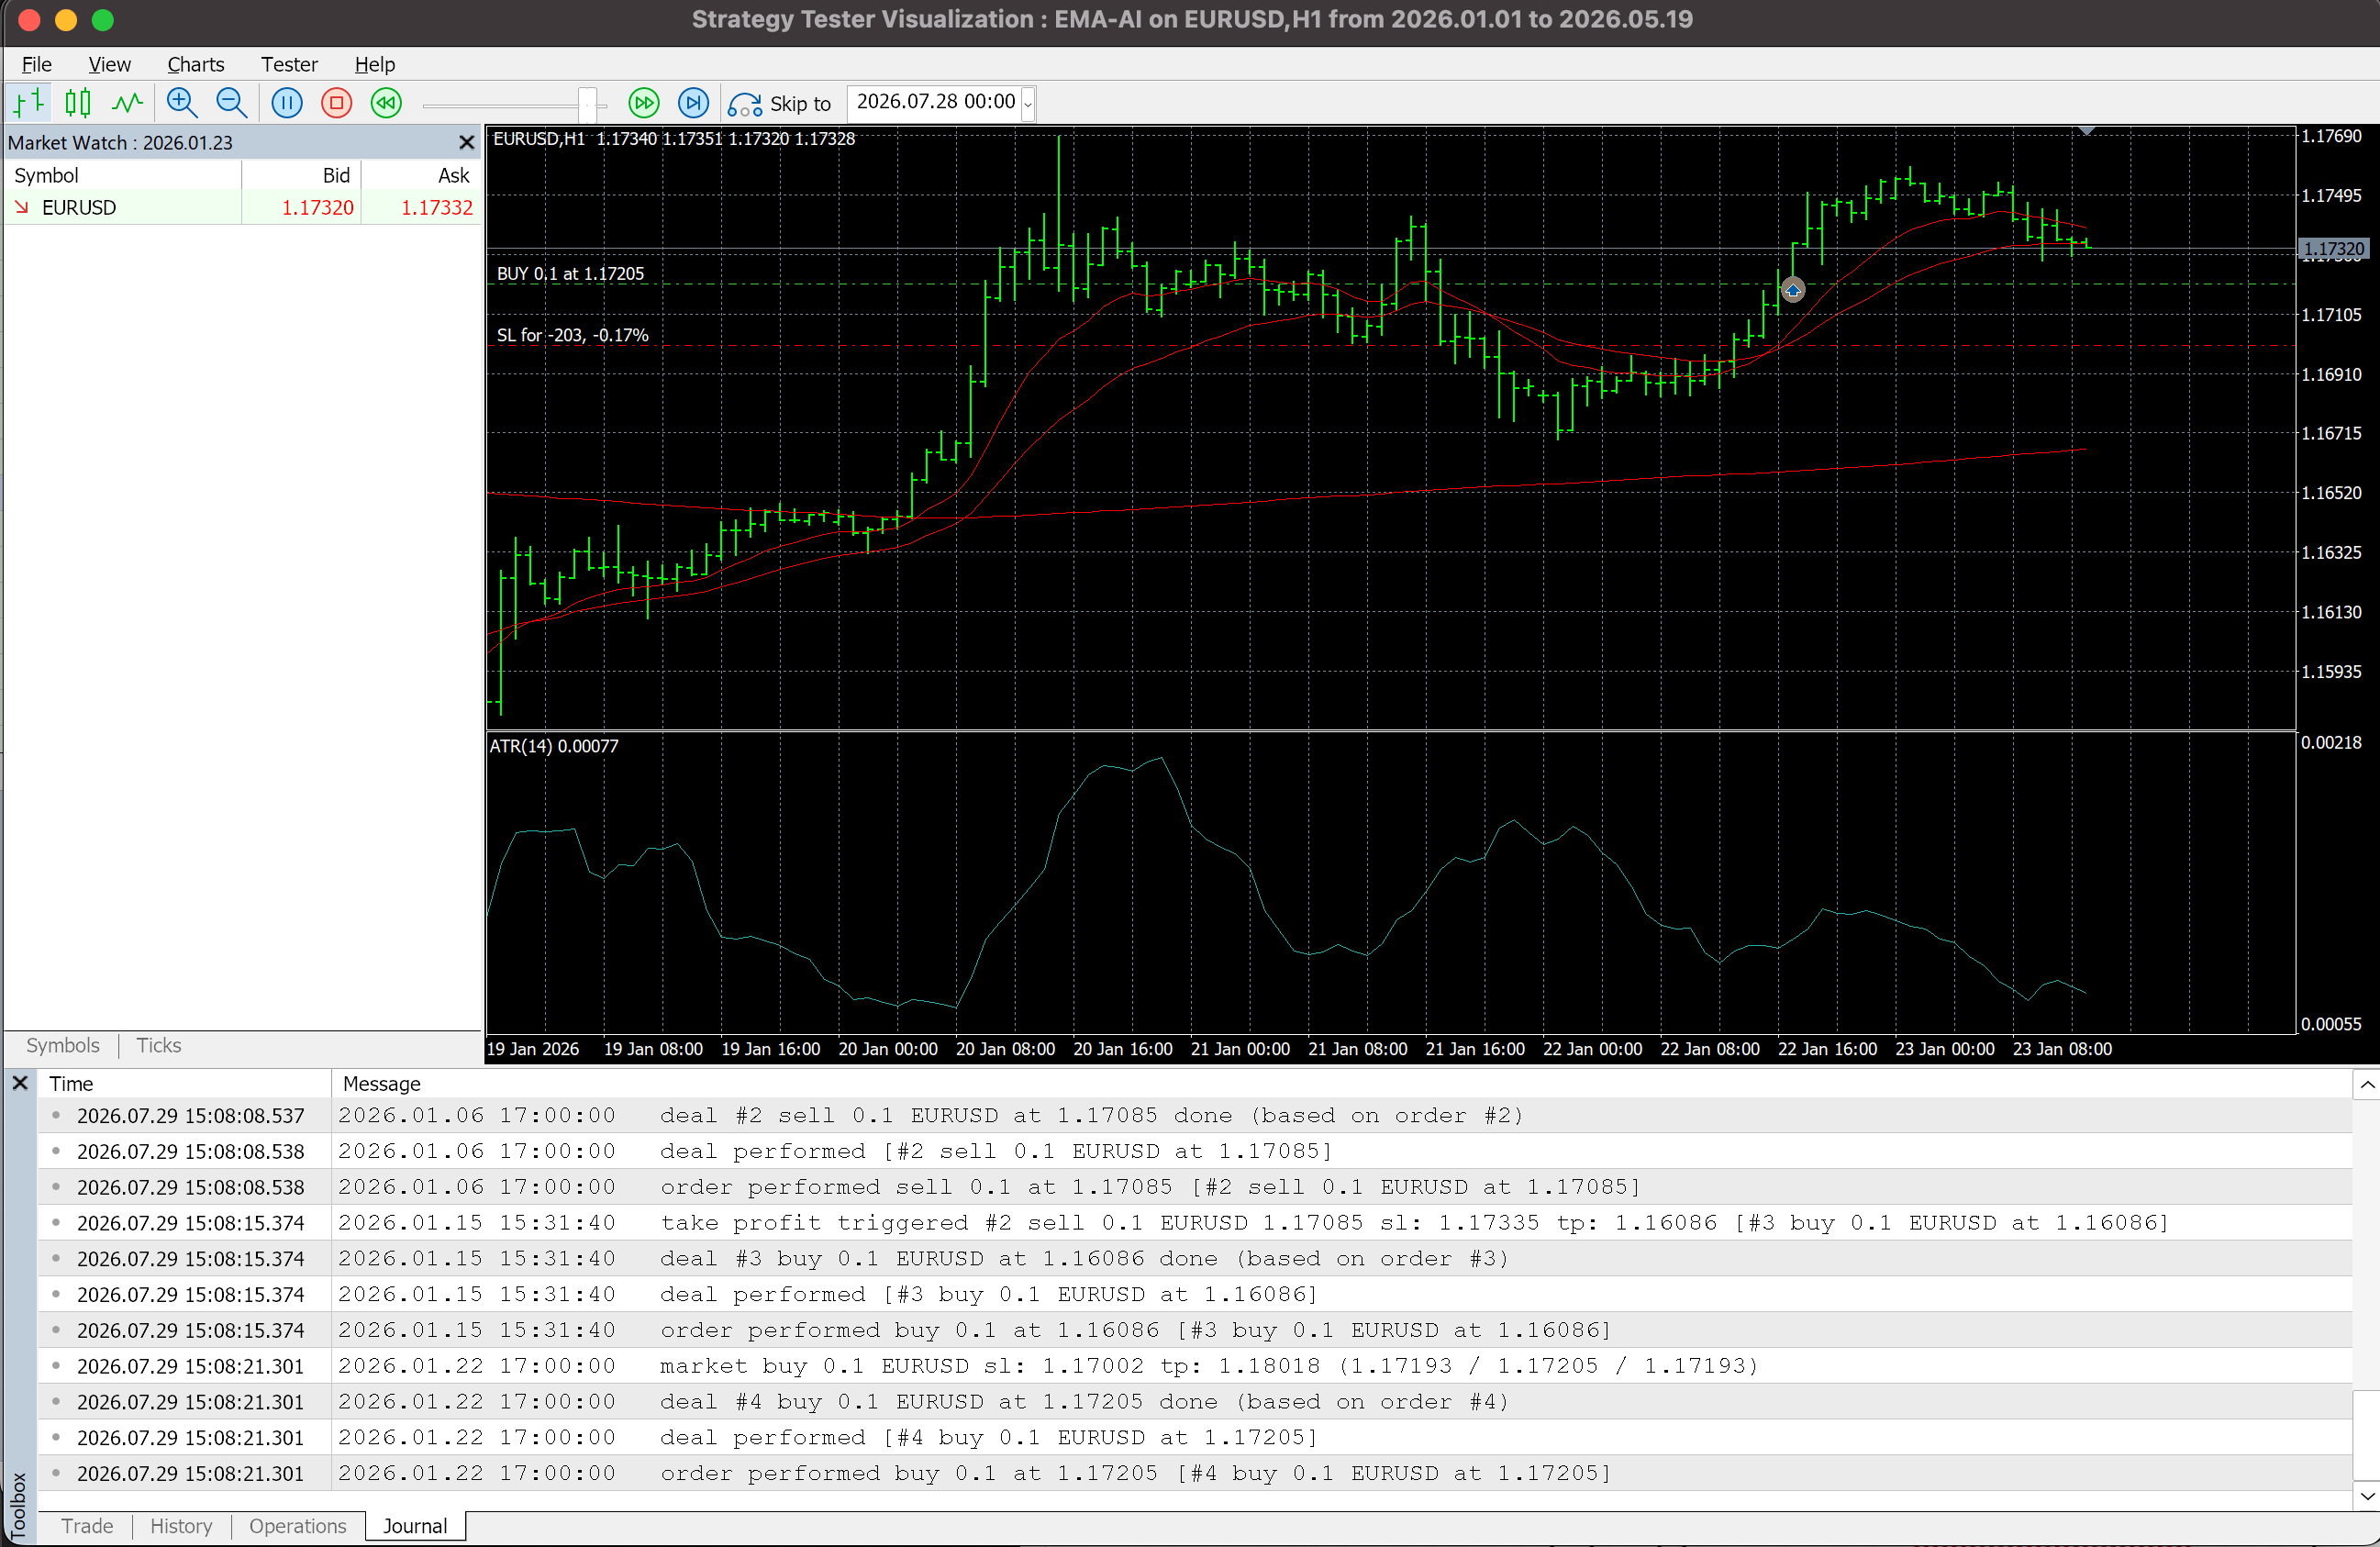
Visualization is a tool for checking the algorithm's logic, not for judging profitability, so it doesn't replace a full statistical read of the report.
Start Trading Now
Forex, stocks, indices and gold on MetaTrader 4 and MetaTrader 5, from a free demo account to a live one.
How to Read a Backtest Report Correctly
Once testing finishes, MetaTrader 5 generates a detailed report. The most common mistake is judging a strategy on net profit alone, since a high headline number says nothing about reliability on its own. A proper assessment weighs data quality, the risk-to-reward relationship, trade count, drawdown size, and the shape of the equity curve together.
| Metric | What It Means | What to Look For |
|---|---|---|
| History Quality | Scores the quality of the historical data used to model price movement | Aim for around 99.9%. Lower values point to incomplete data or algorithmically reconstructed price movement, which reduces reliability |
| Profit Factor | Ratio of total gross profit to total gross loss over the full test period | Roughly 1.4 to 2.0 is often considered a more sustainable range. Values above 3.0 warrant a closer look for overfitting, too few trades, or aggressive risk settings |
| Balance Drawdown Maximal | The largest drop in balance from a prior peak during the test | Up to 15% is relatively low risk; 15 to 25% is a moderate load; above 30% calls for further analysis and possibly a smaller trading volume |
| Total Trades | The total number of completed trades over the test period | A statistically meaningful sample matters. Just 20 to 30 trades over several years can be little more than chance, while hundreds of trades give far more reliable statistics |
| Equity Curve | The account value over time, including open positions and floating results | A sound strategy shows a relatively smooth curve without sharp drops. A large gap between Balance and Equity points to large floating losses, overheld positions, or weak risk control |
Backtesting Risks: Overfitting and Forward Testing
One of the most common problems in building trading robots is overfitting, when an algorithm adapts too closely to historical data and loses effectiveness under new market conditions. During optimization, the tester can run through huge numbers of parameter combinations (indicator settings, stop-loss and take-profit levels, entry filters) and produce a near-perfect historical profit curve that doesn't reflect real robustness. The core danger is that the robot starts memorizing the past instead of finding patterns that generalize.
A Simple Sign of Overfitting
A sound trading system should hold up under small parameter changes. If a strategy runs on a 14-period RSI, shifting that to 13 or 15 shouldn't destroy the result. Some mild degradation is normal. But if the system is highly profitable at RSI 14 and collapses into heavy losses the moment the period shifts slightly, that's a sign the parameters were fitted too tightly to historical data, and settings like that carry a high risk of failing once they meet the real market.
Built-In Forward Testing in MT5
Forward testing checks a strategy's robustness by splitting historical data into two independent segments: an optimization period, where the best parameters are found, and a forward period, made up of unseen data used to verify those settings. MetaTrader 5 builds this process directly into the Strategy Tester, running the check automatically without manual data splitting. If the forward-period equity curve keeps climbing smoothly with no sharp drawdowns, that's strong evidence the underlying logic is sound; if the curve falls sharply during the forward test, the settings were likely fitted artificially to history and the system needs reworking.
Common Causes of False Backtest Results
Technical mistakes, incomplete historical data, and misconfigured tester settings often distort backtest statistics and create a false impression of profitability. A proper audit means connecting the cause of an error to how it shows up in the report and how to fix it.
| Problem | How It Shows Up | Solution |
|---|---|---|
| No trades at all in the test | The robot opens no positions, the report is empty, and the balance chart is a flat line | Check the Journal tab for errors, review the robot's input parameters and trading restrictions, and confirm the deposit and position size actually allow trades to open |
| Low modeling quality | Profit, drawdown, and trade-count figures may be unreliable due to poor historical data | Check for complete instrument history, download current historical data, and use Every tick based on real ticks for the final check |
| Different results on different servers | The same robot with identical settings shows a profit at one broker and a loss at another | Compare the instrument specification (spread, commissions, swaps, contract size) and test using the data and conditions of the broker you plan to trade with |
| Testing only on a rising segment of history | The robot shows near-perfect results over a short period but loses effectiveness after launch | Use at least 12 months of history and test across different market phases, trending moves and sideways consolidation |
| Unrealistic deposit and position size | The tester uses a large balance and volume that couldn't be applied on a real account | Set a starting deposit close to real trading conditions and check how position size affects drawdown and margin requirements |
What to Do After a Successful Backtest
A profitable result in the Strategy Tester is only the first checkpoint. Even a high-quality backtest can't fully reproduce real market conditions, including execution delays, changing spreads, technical glitches, connection issues, and unusual market events. Moving a robot to real capital should happen in stages.
1
Demo account testing
Install the robot on a VPS and run it on a demo account to confirm 24/7 stability, correct order handling, working stop-loss and take-profit levels, and to catch connection issues or terminal freezes. A few weeks is a reasonable observation window, long enough to see the robot handle different market conditions.
2
Minimum real-volume verification
After a clean demo run, move to a real account with the smallest possible position size to check real order execution, the impact of spread and commissions, possible slippage, and how the algorithm behaves under real market conditions. The goal here is confirming the robot behaves the same as it did in testing, not maximizing profit.
3
Gradual scaling
Only after confirming stable performance on minimal capital does it make sense to consider increasing volume, gradually, and building on real trading statistics instead of the historical test alone.
For a detailed walkthrough of each stage, see our guide on launching a trading robot safely, step by step. Getting started only takes a free RoboForex demo account, a trading terminal, quality historical data, and the MetaTrader 5 Strategy Tester.
Get MetaTrader 5 From RoboForex
A free platform with a built-in multi-threaded Strategy Tester for backtesting your own trading robots.
Conclusion
A profitable result in the Strategy Tester is only the first stage of checking a trading robot. Even a high-quality backtest can't fully reproduce real market conditions, including spread changes, execution delays, and technical failures.
A reliable check combines historical analysis, risk assessment, forward testing, and follow-up observation on a demo account. That combination evaluates a strategy's resilience as well as its returns, and a trading robot, as an automation tool, needs ongoing monitoring and refinement, not a one-time test.
Frequently Asked Questions
How long should a backtest be?
At least 12 months is recommended, and ideally long enough to cover an uptrend, a downtrend, and sideways conditions, so the strategy is tested across a genuine mix of market phases instead of one favorable stretch.
Is backtesting accurate?
Accuracy depends heavily on data quality and test settings. A backtest run on real tick data with realistic spread and execution-delay settings, and a History Quality near 99.9%, gives a reliable picture of past behavior, but no backtest, however accurate, guarantees future results.
What is a good profit factor in a backtest?
A profit factor around 1.4 to 2.0 is often seen as a more sustainable range. A very high profit factor, above roughly 3.0, is worth double-checking for overfitting, too few trades, or overly aggressive risk settings, not taken at face value.
Can I backtest for free in MetaTrader?
Yes. The MetaTrader 5 Strategy Tester is built into the platform at no cost, including downloading real tick history and running Every tick based on real ticks simulations.
What is 99% modeling quality?
History Quality (often shown near 99.9% for a well-prepared test) measures how completely the Strategy Tester was able to reconstruct real historical price movement. Lower values mean the historical data has gaps that the tester had to fill in algorithmically, which can shift entry, exit, and stop-loss/take-profit timing away from real conditions.
What is the difference between backtesting and forward testing?
A backtest checks a strategy against a historical period it was already built or optimized around. Forward testing holds back a separate, unseen segment of history to verify those same settings on data the optimization never saw, functioning as a check against overfitting and not just another backtest.
Any information provided in articles on this website is based solely on the personal opinions of the authors. These articles should not be construed as trading recommendations or a call to action. The authors and RoboForex accept no responsibility for the results of any trades made on the basis of these recommendations and reviews. Past performance is not indicative of future results. Trading stocks and CFDs involves a high risk of capital loss.