Spike Pattern: Candlestick Model on Forex

A spike candlestick pattern is a sharp price impulse that the market takes back on the very next candle, returning to where the move began. It forms at the top of an uptrend or the bottom of a downtrend, usually after unexpected news, and often marks the start of a reversal. Traders enter after the returning candle closes.
TL;DR
- Look for a sharp impulse after a long trend that the next candle takes back in full.
- Enter at the close of the returning candle and place the stop loss beyond the spike's extreme.
- Move the stop loss after the price instead of setting a fixed target, because the entry comes at the start of a new trend.
Today, we will get acquainted with the Spike pattern. It is rather rare on charts but provides decent trading opportunities. It has been around for quite long but the one who noticed it first was Jack D. Schwager: he described the pattern and designed the trading rules.
This candlestick pattern may form both at the end of a bullish and bearish trends. The point is that it forms after a mighty up- or downward impulse when the price returns to the initial values upon its ending. If you look at the pattern closer, you will see the following.
A Spike Forming at the Top of an Uptrend
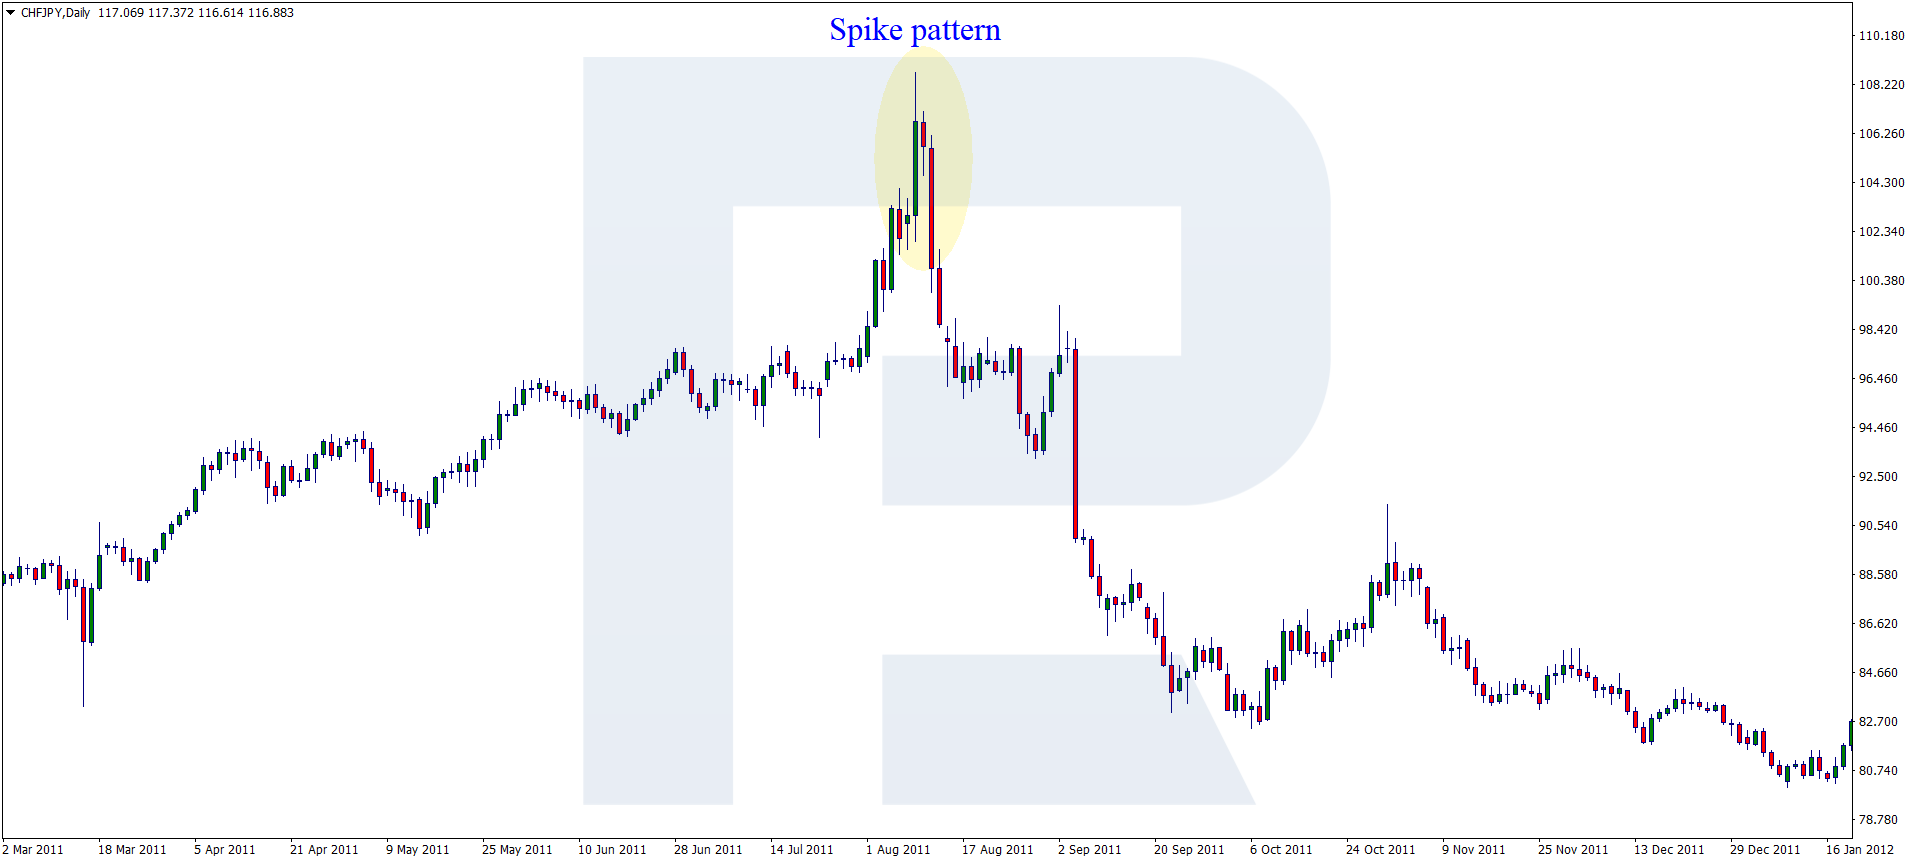
A certain event (some news on the economic calendar or a force majeure, mostly overvalued economically) makes the quotations sky-rocket.
After a precipitated impulse, the quotations stop at the high where a reversal candlestick may form (a Harami, Pin Bar, Shooting Star, and the like). Then on the next candlestick, the quotations return to their initial values which they started growing from. And then the existing trend normally reverses, and the price starts moving in the opposite direction.
A Spike Forming at the Bottom of a Downtrend
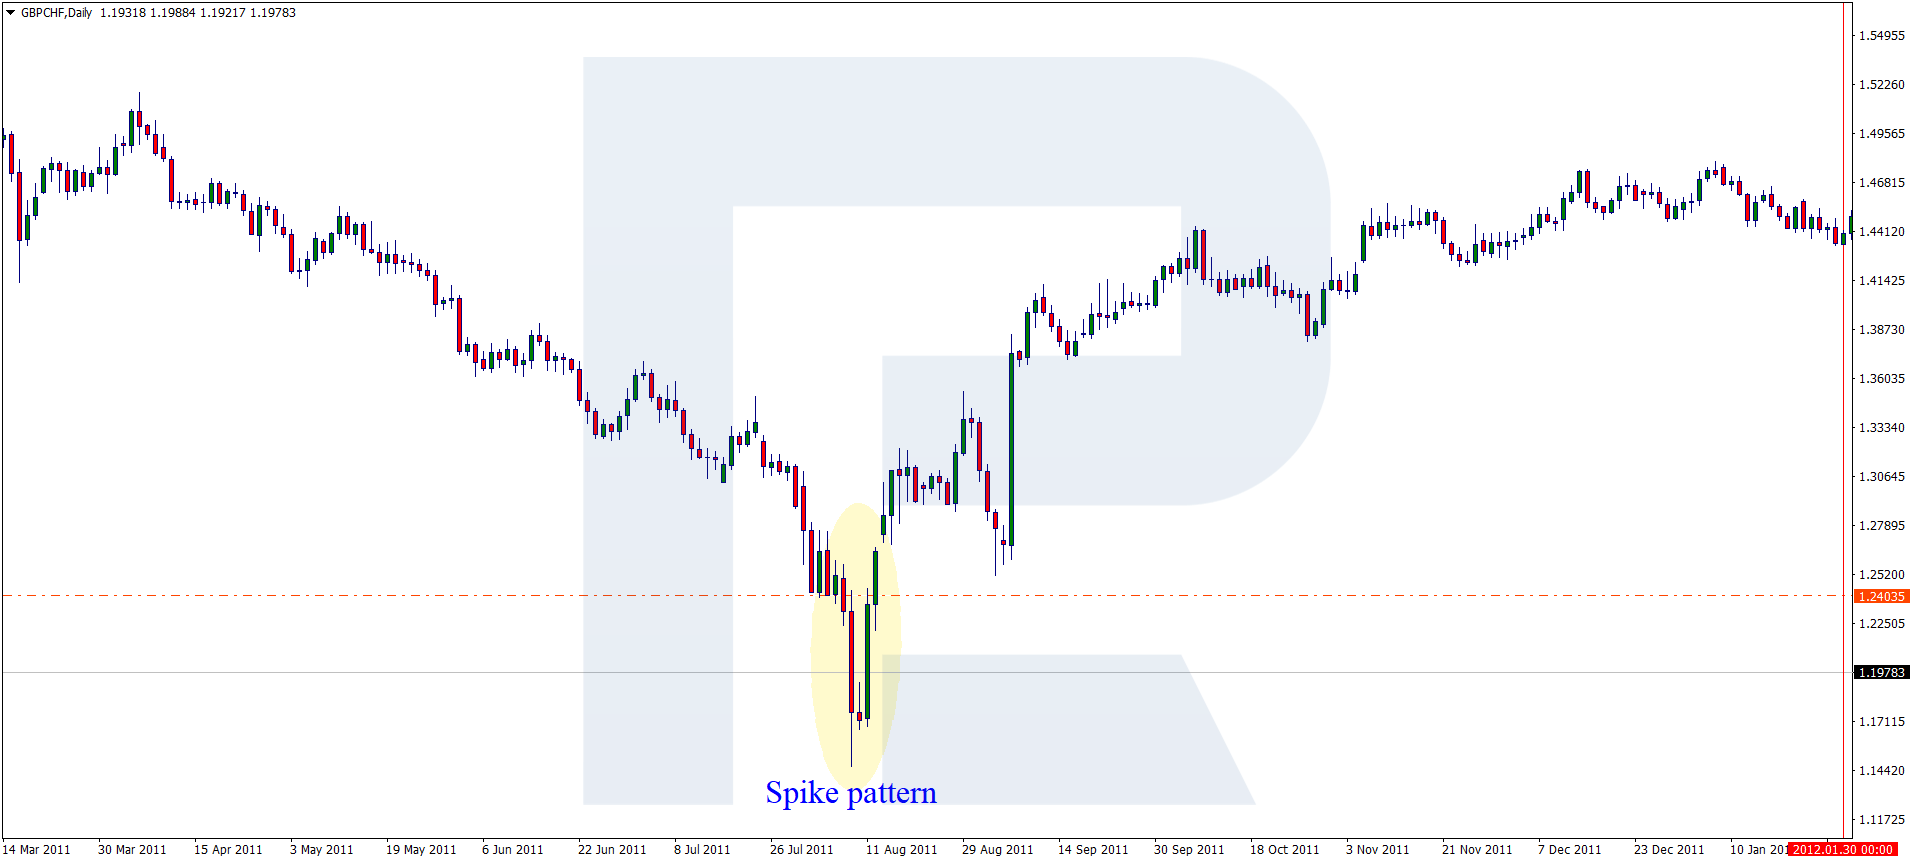
As described above, under the influence of some news or events, the quotations drop steeply. At the low, a reversal candlestick pattern may form (a Hammer, Harami, Inverted Hammer, and the like). Then on the next candlestick, the price returns to the place where it started falling from. And then the actual trend reverses, and the quotations start growing.
Trade on the Go With RoboForex MobileTrader
A portable trading workstation on your phone, on Android and iOS.
Why Does a Spike Appear?
As a rule, the appearance of a Spike is provoked by a human factor: greed, fear, and panic. Greed makes traders open trades after the beginning of the impulse, however, it might not be enough for the growth to continue. Then, after the decline begins, panic and a fear of losing money comes to the scene. The traders start closing orders massively, and after the price returns to the starting point, it goes on falling or growing.
The other situation when a Spike may form is when there appears a trader with an extremely large position volume. In this case, if you look at the market depth, large volumes are bought at all the existing prices, then the depth fills up with applications, and the quotations return to the initial levels.
Additional Reasons for a Spike to Formation
- There is a directed movement (a trend) on the chart;
- The price is not accumulating near the support or resistance levels (there is no flat);
- The price leaps equally sharply by the trend and counter it;
- The price does not lag between the impulses (after a “spurt” the quotations get back right on the next candlestick);
- A swift impulse may break away a key support or resistance level, after which the price will return;
- The price may break away an equidistant price channel (then the price returns, and the trend reverses);
- There might be a lot of gaps.
On large timeframes, the size of the Spike is normally no less than a hundred points and sometimes over a thousand.
The table sums up the two versions of the spike candlestick pattern and the trading rules from the examples below.
| Parameter | Bearish spike, at a high | Bullish spike, at a low |
|---|---|---|
| Where it forms | At the top of a long uptrend | At the bottom of a long downtrend |
| What happens | A sharp rise, usually on news, then the next candle falls back to where the rise began | A sharp fall, then the next candle climbs back to where the fall began |
| Candle at the extreme | Shooting Star, Pin Bar, Hanging Man, Harami | Hammer, Inverted Hammer, Harami |
| Signal | Sell, a likely reversal down | Buy, a likely reversal up |
| Confirmation | The returning candle closes near the start of the impulse | The returning candle closes near the start of the impulse |
| Entry | At the close of the returning candle | At the close of the returning candle |
| Stop loss | Above the spike high | Below the spike low |
| Target | A multiple of the stop, or a trailing stop to follow the new trend | A multiple of the stop, or a trailing stop to follow the new trend |
An Example of Trading a Spike: a Selling Trade
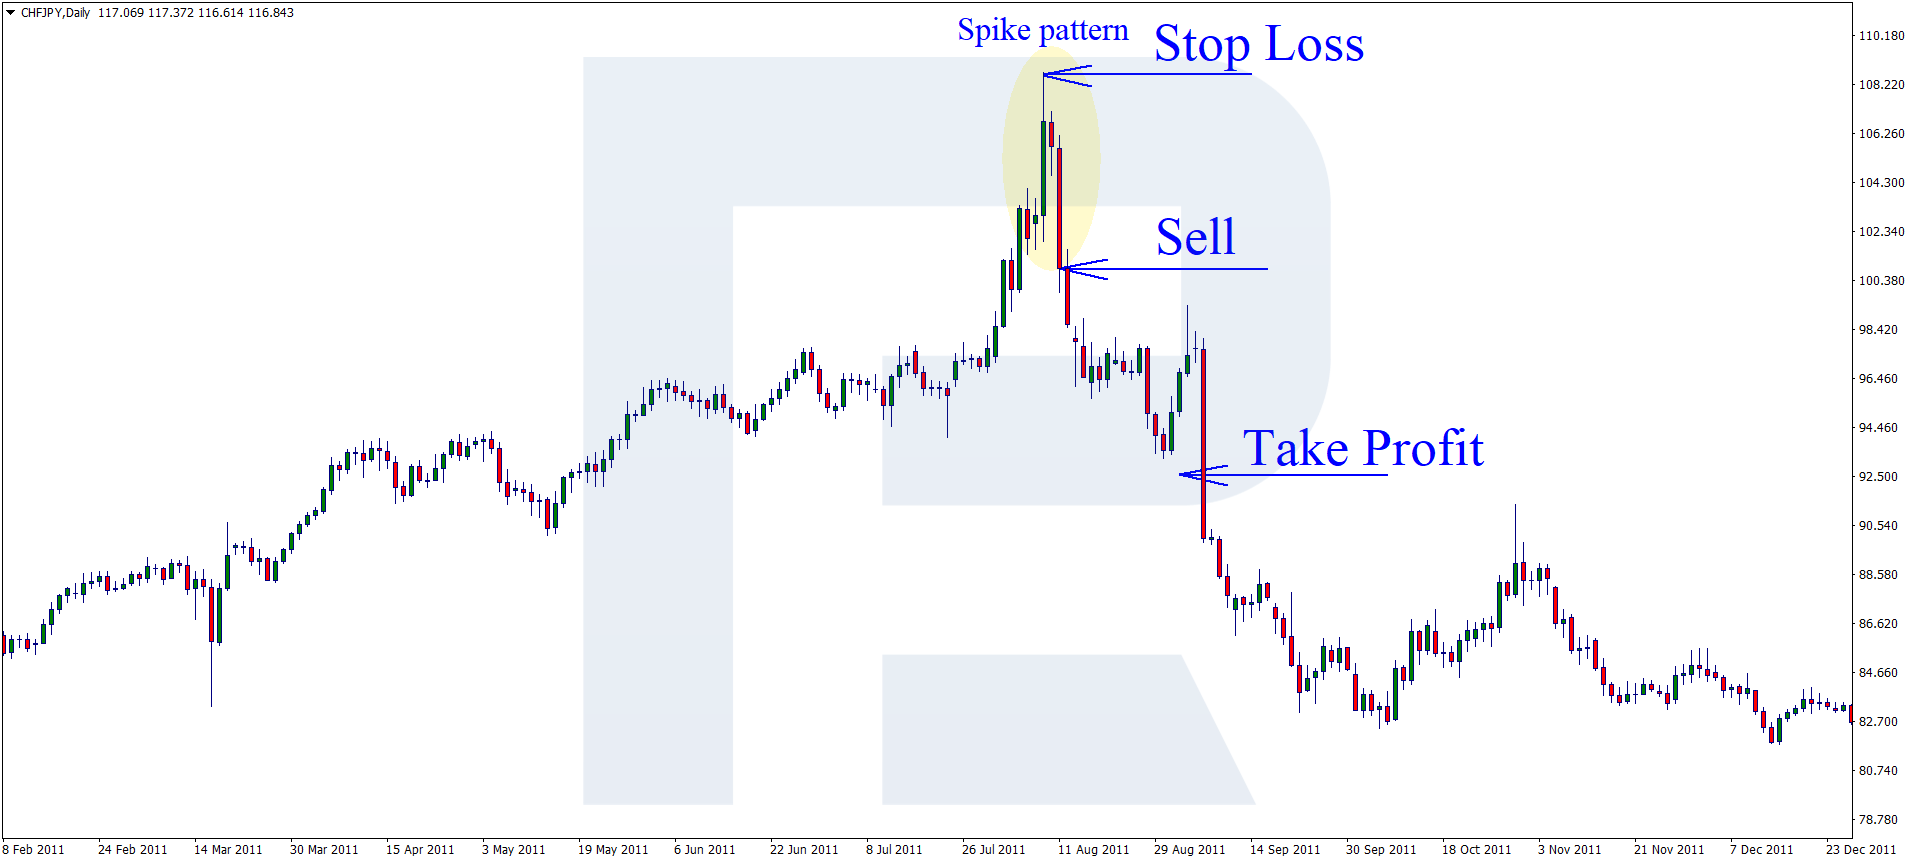
On the chart, the price has been growing for a long time; at some point, an important economic or political event happens, or active trading simply begins (the more unexpected the news, the acuter the market reaction).
The price leaps up high and stops on the next candlestick. In our example, the next candlestick is a Hanging Man. Then the quotations pull back. Ideally, a position should be opened at the level of the last low before the impulse; however, in this case, a selling trade will be opened at the closing of the returning candlestick.
Place a Stop Loss in a safe place behind the high. A Take Profit is calculated based on the size of the SL. To increase the profit, bearing in mind that the trade is opened at the very birth of a trend, it would be better to move the SL instead of placing a TP.
Start Trading Now
Forex, stocks, indices and gold on MetaTrader 4 and MetaTrader 5, from a free demo account to a live one.
An Example of Trading a Spike: a Buying Trade
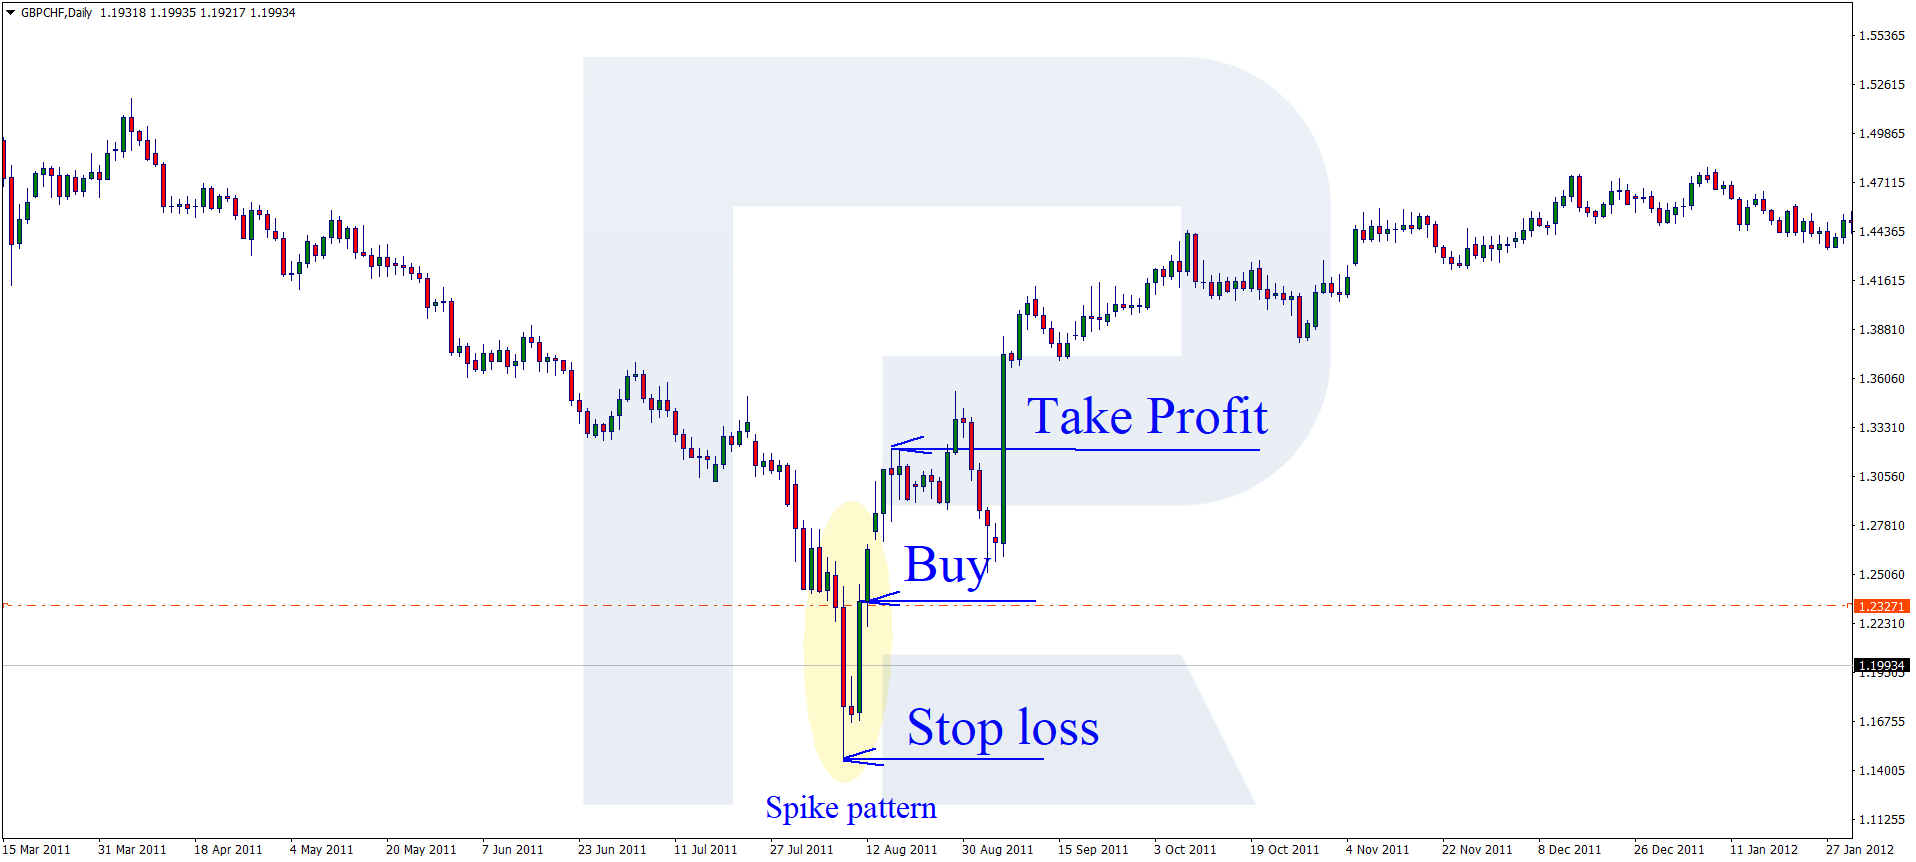
After a lengthy downtrend, the price demonstrates a sharp impulse then stops (on the chart, it looks like a complete Inverted Hammer). On the next candlestick, the price returns to the starting point. Here you may open a buying trade.
Place an SL behind the low. Calculate a TP based on the size of the SL. Some sources advise to make the TP as large as the Spike; however, bearing in mind that the trade is opened at the very birth of a trend, it would be wiser to move the SL instead of placing a TP.
No doubt this is not a perfect option but it will let you earn more points then if you place a fixed TP.
Spike vs Pin Bar
A Pin Bar is a single candle: a long wick and a small body show that the price tried to move and was pushed back within the same candle. A spike is a move across two or more candles: a strong impulse candle, often with a large body, and then a returning candle that takes the whole move back. A Pin Bar often appears at the extreme of a spike, which is why the article lists it among the candles to look for there.
The two also differ in size and in the entry. A Pin Bar can form on any timeframe and at any size. A spike on the daily chart usually covers a hundred points or more, because it needs a real surprise to start. Traders usually enter a Pin Bar when the price breaks its high or low, while a spike is entered after the returning candle closes. The stop loss goes beyond the extreme in both cases.
When a Pin Bar appears at the top of a sharp impulse and the next candle closes back at the start of the move, both signals point the same way, and the setup is stronger than either on its own.
Bottom Line
Trading Spikes entail high risks because they form in extremely volatile markets and, most often, on extremely volatile instruments, such as cross-rates or exotic currency pairs.
To detect Spikes precisely, the trader must study candlestick analysis thoroughly and master its use. The reason is that a Spike is formed on several candlesticks and in the end, it may turn out to be some other pattern. In some cases, signals might be false, especially if before the appearance of the Spike the market was quiet. So, market beginners should better avoid such situations and abstain from opening trades at sharp impulses.
Generally speaking, a Spike is a failed attempt to continue the existing trend. In certain cases, even experienced traders may have more troubles with this pattern than they would like to. Study the market and do not let it trick you.
FAQ
What is a spike in trading?
A spike is a sharp price move that reverses almost at once. In the spike candlestick pattern, an impulse candle shoots up or down, and the next candle returns the price to where the impulse began. It often signals that the trend is about to reverse.
What does a spike candle mean?
A spike candle shows that one side of the market pushed the price hard and could not hold it. When the following candle takes the whole move back, the traders who chased the impulse are caught on the wrong side, and their exits often fuel a move in the opposite direction.
Is a spike pattern bullish or bearish?
It can be either. A spike at the top of an uptrend is bearish and gives a signal to sell. A spike at the bottom of a downtrend is bullish and gives a signal to buy.
Which timeframe is best for spike patterns?
The daily chart and higher. On large timeframes a spike usually covers a hundred points or more, and the signal is clearer. On minute charts, sharp moves that reverse at once happen often and carry far less meaning.
Why do spikes happen in forex?
Most spikes follow unexpected news or an economic release that the market first overreacts to. They can also appear when a very large order hits the market. Volatile crosses and exotic currency pairs produce them most often.
Any information provided in articles on this website is based solely on the personal opinions of the authors. These articles should not be construed as trading recommendations or a call to action. The authors and RoboForex accept no responsibility for the results of any trades made on the basis of these recommendations and reviews. Past performance is not indicative of future results. Trading stocks and CFDs involves a high risk of capital loss.