How to Use Ichimoku Kinko Hyo: Settings, Lines and Signals

The Ichimoku indicator, in full Ichimoku Kinko Hyo and often called the Ichimoku cloud, is a trend indicator of five lines that shows direction, momentum and support and resistance on one chart. With the default 9, 26 and 52 settings, a price above the cloud points to an uptrend, a price below it to a downtrend, and a price inside it to a sideways market.
TL;DR
- Check where the price is against the cloud to read the trend: above, below or inside.
- Take Tenkan-sen and Kijun-sen crosses only in the direction of that trend.
- Treat a breakout from the cloud as the strongest signal, and keep the default 9, 26, 52 until you have tested other settings.
Principle of Ichimoku Kinko Hyo
Ichimoku Kinko Hyo is a technical analysis method developed before the Second World War by Goichi Hosoda, better known under the pen-name Sanjin Ichimoku. In Japanese Ichimoku Kinko Hyo roughly means "instant representation" or "one glance cloud chart". The indicator was designed in addition to candlestick charts on the commodity market, and the author used it successfully for rice trading. Later it was elaborated and published in 1969, since then being one of the traditional instruments of Japanese traders.
Our modern world of trading takes interest in the indicator as well, because it provides information about the direction and the potential of trends. The indicator shows the support and resistance lines and gives signals of market entry and exit. Ichimoku Kinko Hyo can be used on Forex, too, especially on daily and weekly charts. It works best in combination with candlestick charts. Setting the parameters right allows using the Ichimoku on smaller timeframes, such as H4 and H1.
Trade on the Go With RoboForex MobileTrader
A portable trading workstation on your phone, on Android and iOS.
The Ichimoku Kinko Hyo Setup
Tenkan-sen shows the average price counted as the sum of the maximum and minimum price divided by 2, during a certain period (9 candlesticks by default). Tenkan-sen is the quickest line of the Ichimoku chart, its incline indicating the direction of the trend. If the line goes up, the trend is ascending; if it goes down, the trend is declining.
Kijun-sen is the average value between the maximum and minimum during a certain period (26 candlesticks by default).
Senkou B shows the average between the maximum and minimum during a certain period, but the line is shifted forward for the value of Kijun-sen (default period is 52 candlesticks and the shift is 26 candlesticks).
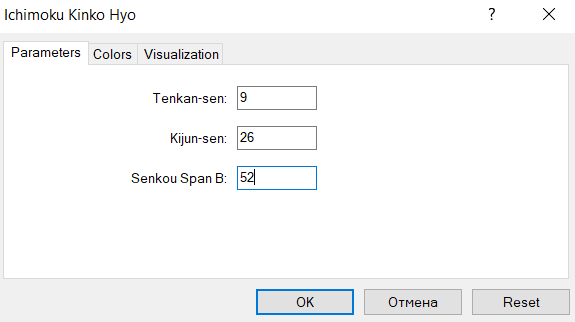
Different sources give different explanations to the numbers above. One says that the number 52 used in the Senkou B parameter stands for 52 weeks, i.e. 1 year, while 26 from Kijun-sen stands for half a year. At the same time traders who has been using the instrument for a long time claim that Goichi Hosoda put a totally different meaning into the parameters. 52 means 2 standard work months (Saturday used to be a workday in Japan), 26 is the length of 1 month, and 9 is 1.5 workweeks. Today the length of a workweek is 5 days, so it might be reasonable to refresh the parameters.
If we reduce the basic values too much, the indicator will react upon the changes on the market too quickly, which will yield lots of opening signals but their quality will be too poor, i.e. there will be many false signals. If we increase the values significantly, the indicator will form the signals too slowly, which means we may miss the opportunity to enter the market at a good price. However, it is worth mentioning that the initial parameters were meant for the Japanese index Nikkei 225 for timeframes longer than the daily one. In order to use the indicator efficiently in trading currency pairs, it should be customized in accordance with the pairs’ particularities.
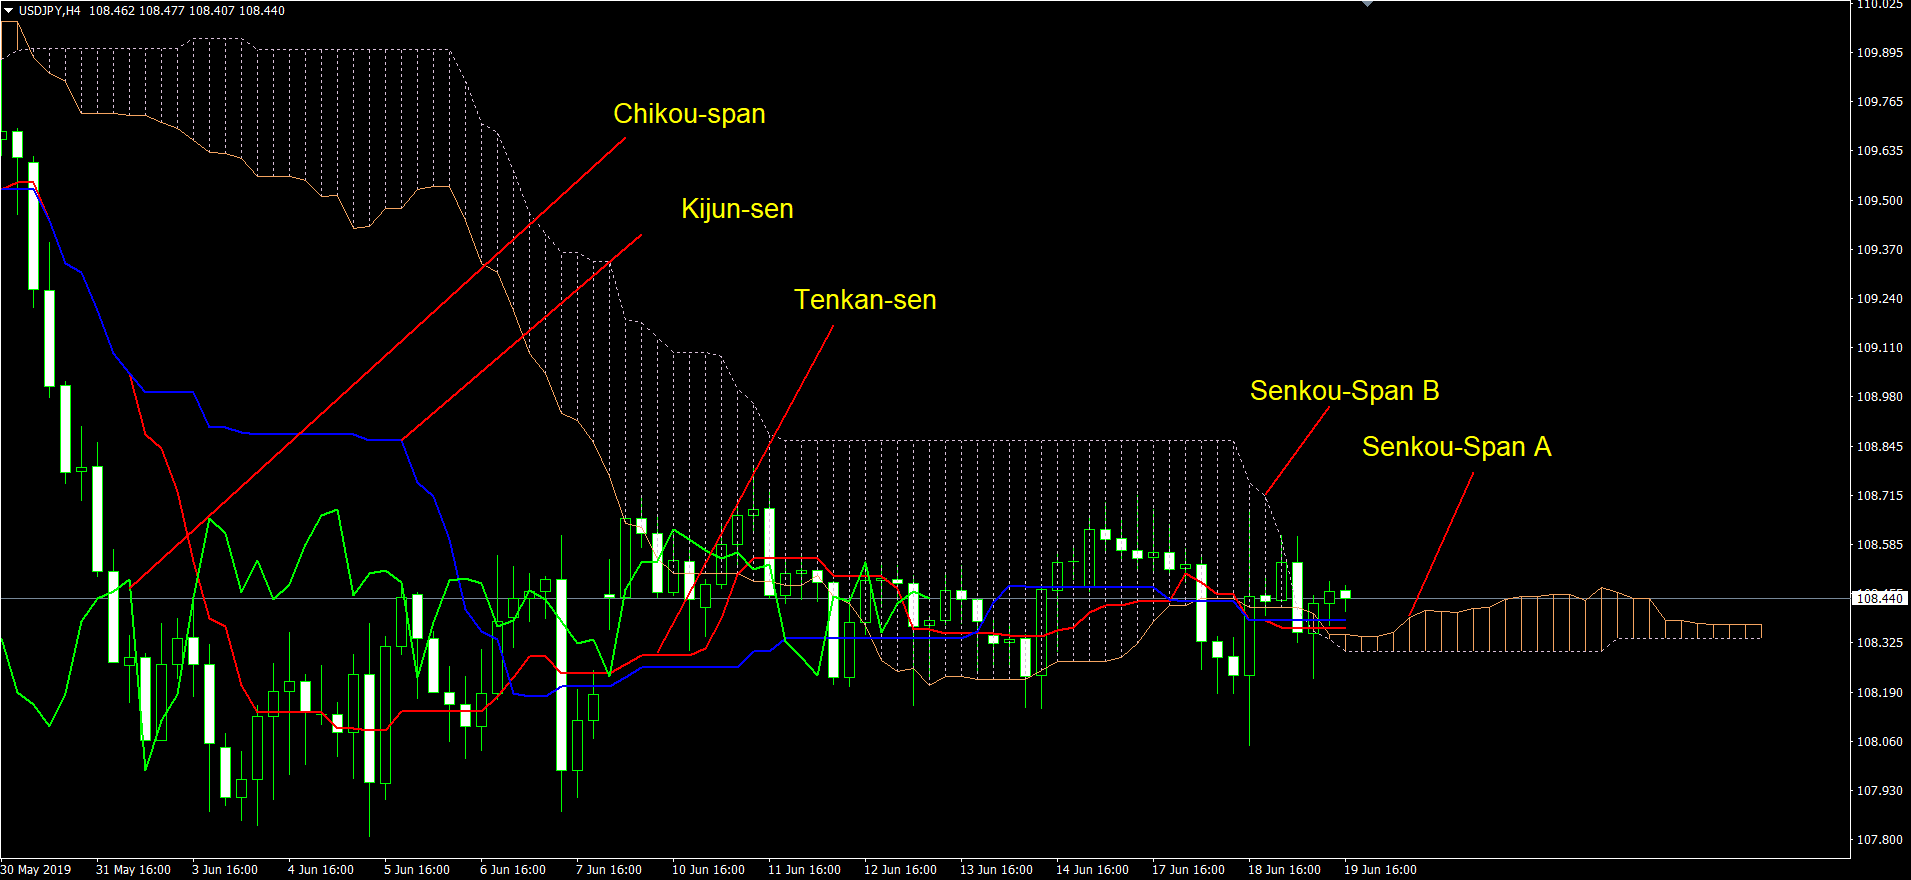
In the indicator itself only the basic parameters change, though on the chart there are much more lines. Let us discuss their meaning.
- The Tenkan-sen line (red) is the quickest of all lines of Ichimoku Kinko Hyo. Its incline shows the direction of the trend. If it goes up, the trend is ascending; if it goes down, the trend is descending.
- The Kijun-sen line (blue) reflects the current trend. If the price is above the line, it is highly probable that it will keep growing, and vice versa.
- The Chikou Span line (green) shows the price of the instrument shifted back for the value of the Kijun-sen. It is used when forming entry signals.
- The Senkou Span A line (orange) is the average of the Tenkan-sen and Kijun-sen lines shifted forward for the value of the Kijun-sen.
- The Senkou Span B is a white dotted line representing the average of the maximum and minimum during the last 52 candlesticks, shifted forward for the value of the Kijun-sen. The hatched area between the Senkou Span A and Senkou Span B forms the Ichimoku cloud.
Ichimoku Kinko Hyo Indicator Formula
The indicator consisting of five lines, each of them is calculated by its own formula. Some of them are Moving Average lines in essence, so they are calculated accordingly.
For calculating the Kijun-sen line the arithmetic average of the minimum and maximum candlesticks during a certain period (26 candlesticks by default):
Kijun-sen = (Max(High, M) + Min(Low, M)) / 2
Where:
- Max(High, M) is the highest maximum during the period
- Min(Low, M) is the lowest minimum during the period
- M is the period
The Tenkan-sen line is calculated the same way but for a shorter period (9 candlesticks by default):
Tenkan-sen = (Max(High, N) + Min(Low, N)) / 2
Where:
- Max(High, N) is the highest maximum during the period
- Min(Low, N) is the lowest minimum during the period
- N is the period
Chikou Span is calculated as the current Close moved backwards for the value of a certain period (26 by default).
Senkou Span A is the arithmetic average of Tenkan-sen and Kijun-sen moved forward for a desired number of periods (26 by default):
Senkou Span A = (Tenkan-sen + Kijun-sen) / 2
Senkou Span B is the arithmetic average of each candlestick of the chosen interval (52 by default), moved forward for 26 periods:
Senkou Span B = (Max(Z) + Min(Z)) / 2
Where:
- Max(Z) - maximum during the period.
- Min(Z) - minimum during the period.
- Z is the length of the intervals.
The values of the periods by default were suggested by the author of the indicator on the basis of his own trading experience. When working with Ichimoku Kinko Hyo the default settings can be customized according to the actual market situation and the trader’s preferences.
The table sums up the five lines of the Ichimoku indicator with their default settings.
| Line | Formula | Default period | What it shows | Signal |
|---|---|---|---|---|
| Tenkan-sen | (Highest high + lowest low) / 2 | 9 | Short-term trend and momentum | Crossing Kijun-sen upward is bullish (Golden Cross), downward is bearish (Death Cross) |
| Kijun-sen | (Highest high + lowest low) / 2 | 26 | Medium-term trend, support or resistance | Price above it favours buying, price below it favours selling |
| Senkou Span A | (Tenkan-sen + Kijun-sen) / 2, shifted 26 periods forward | 9 and 26, shift 26 | The faster edge of the cloud | Above Senkou Span B, the cloud is bullish |
| Senkou Span B | (Highest high + lowest low) / 2, shifted 26 periods forward | 52, shift 26 | The slower edge of the cloud | A breakout through it points to a strong long-term trend |
| Chikou Span | Current close, shifted 26 periods back | 26 | The current price against the price 26 periods ago | Crossing the price upward is bullish, downward is bearish; a weak signal on its own |
Ichimoku Settings for Different Timeframes
The default Ichimoku settings, 9, 26 and 52, are what most traders watch, so the levels they draw tend to matter most on the chart. Changes are worth testing only when your market trades a different number of days a week or you need faster signals. The variants below are popular conventions, not official settings.
| Market and timeframe | Ichimoku settings | Why |
|---|---|---|
| Forex and indices, D1 and W1 | 9, 26, 52 | The original values, built for daily charts and watched by the most traders |
| Forex, H1 and H4 | 9, 26, 52 | The default still works; most traders keep it on intraday charts |
| Forex, faster signals | 7, 22, 44 | Adjusts the periods to a five-day trading week, following the logic in the setup section above; more signals and more false ones |
| Crypto, markets open 7 days a week | 10, 30, 60 or 20, 60, 120 | Stretches the periods for weekends, when crypto keeps trading |
To try a setting, open the EUR/USD chart in MetaTrader 4, choose Insert, Indicators, Trend, Ichimoku Kinko Hyo, and enter the three periods on the Parameters tab. Compare the signals over the last few months with the default before you trade with the new values.
Trading by the Ichimoku Indicator
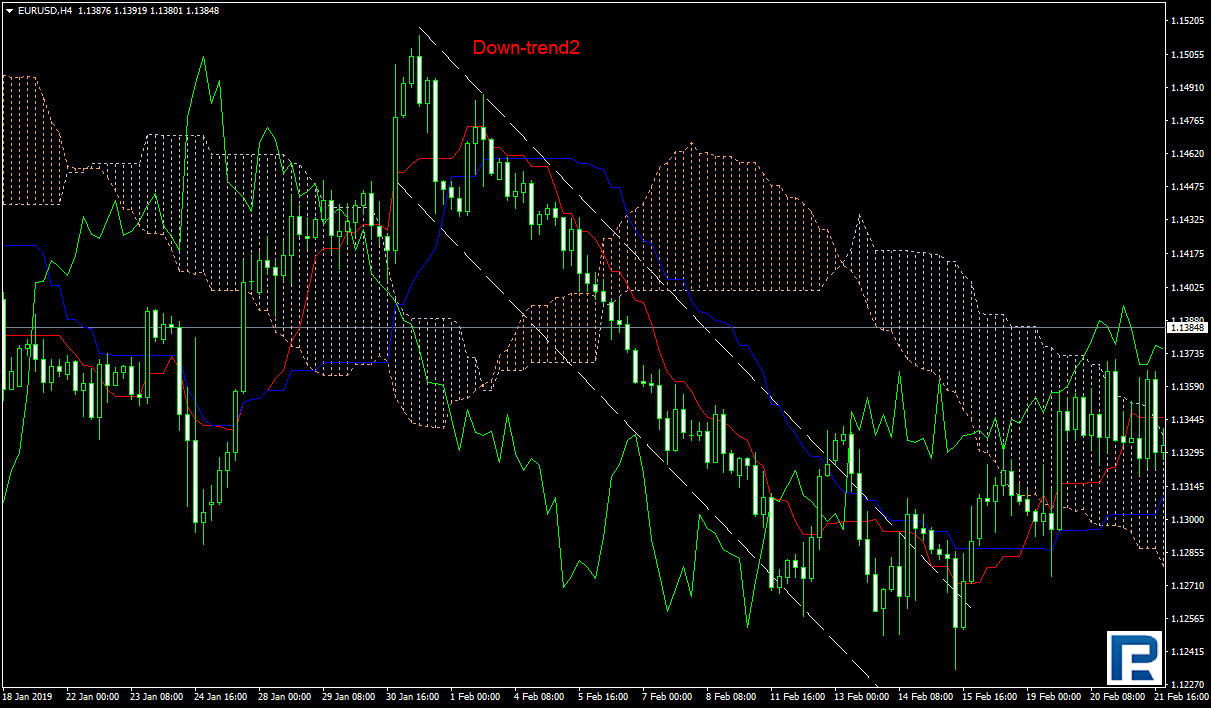
The position of the lines shows the direction and the strength of the trend. If the Tenkan-sen and Kijun-sen lines are above the price (the short Tenkan-sen closer to the latter), it represents a stable descending trend.
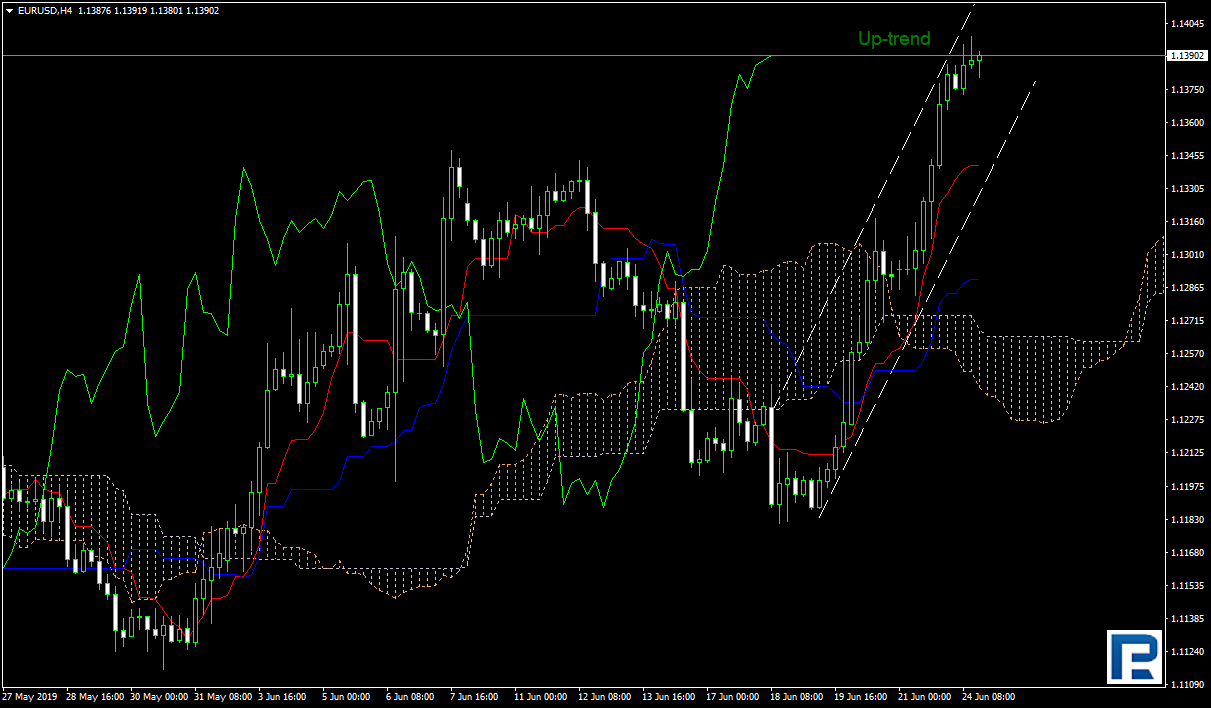
And vice versa, if the lines go below the price (Tenkan-sen being closer to it), the market must be experiencing a strong ascending trend. This signal is considered rather strong.
Ichimoku Crosses
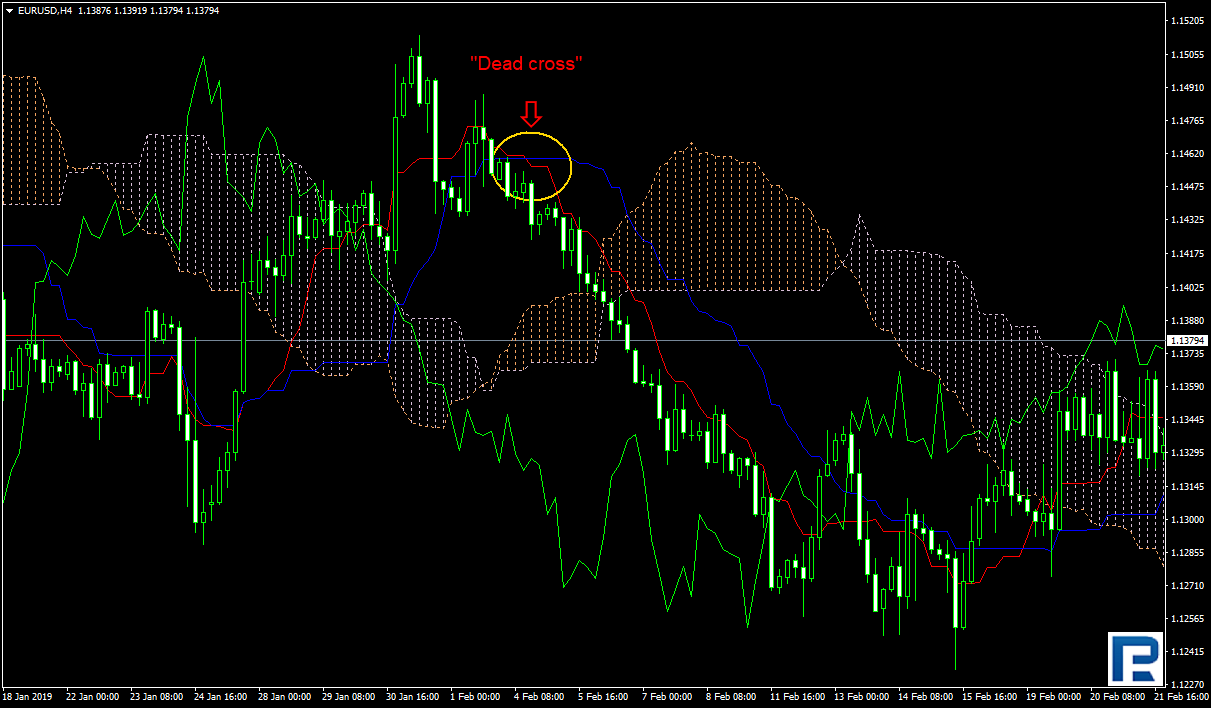
A cross is a crossing of Tenkan-sen and Kijun-sen. In the Death Cross a short Tenkan-sen crosses a long Kijun-sen downward. The crossing occurs above the price. This figure may signal a reversal of the price to the downside.
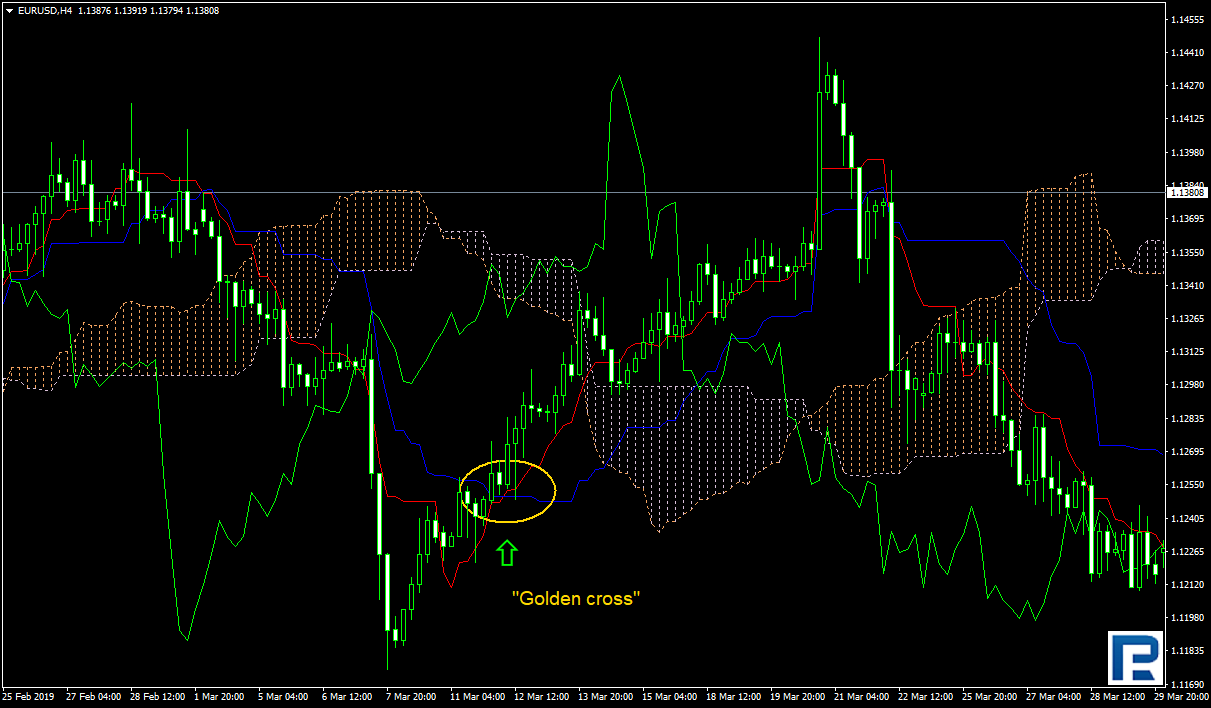
Conversely, the Golden Cross is comprised of a short Tenkan-sen crossing a long Kijun-sen upward under the price. This situation may mean an upcoming reversal of the trend to the upside. The signals might come a bit late, so it is hardly advisable to use them as the only source of information.
Senkou Span A and B
Senkou Span A and B are leading lines forming the Ichimoku Cloud, which can be hatched any colour of the client’s choice. The first pattern is when Senkou A goes above Senkou B (the Cloud is brown); the second pattern features Senkou B above Senkou A (violet hatching). These signals give excellent results when used together with Fibo levels (especially in large time frames).
The signals appear when:
- The price is moving inside the Cloud.
Getting inside the Cloud, the price signals a safe trading channel, A and B lines normally acting as the support and resistance lines. - The lines cross one another.
When they do so, it may signal a reversal of the trend. - The price breaks through Line B.
It is one of the most important signals of the indicator, because Senkou Span B represents the average price of the preceding periods. In this case the breakthrough forecasts a strong long-term trend. Such signals are considered to be among the most reliable in trading but require caution as well as other do: the prognosis will be more accurate if the signals confirm a previously formed trend.
The Chikou Span Line
Even experienced traders seldom use this line as its signals may be hard to analyze. It is a lagging line shifted 26 periods back from the last closing price on the chart. The number of periods can be changed if you need to receive signals more or less often. What signals do we get from this line? If Chikou Span has broken through the price upward, it may predict a reversal of the trend to the upside. And vice versa, a top to bottom breakthrough may signal a reversal to the downside. The signal is quite weak, so it would be unwise to make decisions just on its base.
Start Trading Now
Forex, stocks, indices and gold on MetaTrader 4 and MetaTrader 5, from a free demo account to a live one.
How to Read the Kumo Cloud
The Kumo, the Ichimoku cloud, is the area between Senkou Span A and Senkou Span B. It is the part of the indicator most traders read first, because it answers three questions at a glance.
- Where is the trend? When the price is above the Ichimoku cloud, the trend is up and the cloud acts as support. When the price is below it, the trend is down and the cloud acts as resistance. When the price is inside the cloud, the market is moving sideways, and the indicator's signals are at their weakest.
- How strong is the support or resistance? A thick cloud, with a wide gap between the two Senkou lines, is hard for the price to break. A thin cloud is weak, and the price passes through it easily.
- Is the trend about to change? When Senkou Span A and Senkou Span B cross, the cloud changes colour. This is the Kumo twist. Because the cloud is drawn 26 periods ahead, a twist on the right edge of the chart shows where the balance may shift in the future.
Read the three together. A price above a thick bullish cloud, with no twist ahead, describes a strong uptrend. A price entering a thin cloud just before a twist describes a trend that is losing strength.
Ichimoku Kinko Hyo Indicator Signals
All signals of the indicator can be divided into weak, neutral and reliable.
Weak Signals
One example would be crossing of the Cloud border by the price. If the price enters the Cloud abruptly, a serious suppression follows (as a rule). Watch the charts for several periods before acting boldly.
Neutral Signals
For example, Tenkan-sen crosses Kijun-sen when the price is already inside the Cloud. While the price is inside, the signal will not be strong enough. The probability of a reversal will grow only if the price nears the borders of the Cloud.
Reliable Signals
Among these, there is one of the most serious signals which is the price escaping the Cloud. As a rule, a strong impulse follows, and if the trader forecasts it well, they can enter a long-term trend. Many traders open new positions at the breakthrough of the Cloud.
Get MetaTrader 5 From RoboForex
A free, professional platform with every indicator and chart tool from this article.
Ichimoku Kinko Hyo Indicator Pros and Cons
Any trading system has its own particularities, its own pros and cons. Trading with the Ichimoku Kinko Hyo indicator is a good way to learn trading in the direction of the dominant trend and to hold your positions for as long as possible. The author himself pointed out how to define trends efficiently: if the price is inside the Cloud, the trend is sideways; if the price is above or below it, there is a strong trend.
Unfortunately, in most cases beginners are not ready to follow the market and do not like it. They prefer reversing the market, which is hardly efficient in the long term and may even lead to serious losses. In this case the indicator advises the trader against selling on the growing market; instead, it would be better to enter the market in the direction of the trend and hold the positions until the exit signal is received.
In addition, Ichimoku Kinko Hyo can generate signals in the direction of the current trend by itself. For example, the Moving averages can determine the trend well, but they will hardly give additional signals in the direction of the trend. That is why another oscillator is often used to confirm the signals. In this case Ichimoku alone will be enough for trading in the direction of the trend and getting different signals.
Another peculiarity of this technical analysis instrument is that it gives the trader strict rules of entry and exit. This virtually excludes the appearance of spontaneously opened positions which usually have no perspectives and lead to losses. Here one has nothing to do but to watch the market and wait patiently for a signal to sell or to buy, and after the transaction, to look for an exit point.
The Cloud clearly shows the support line when the price goes above the cloud. When the price is below it, the borders of the Cloud represent the resistance lines. This rids traders of searching some important information on the chart.
Serious disadvantages of the indicator appear when one uses it during periods of low volatility, when the trend is not yet formed and the price trades in a narrow range. The price would keep breaking through the Cloud upward and downward, demonstrating no stable trend, and the signal lines would keep generating signals to buy or to sell alternately. In such circumstances positions with close Stops will close unreasonably often. However, situation like this are uncommon; what is important here is to abstain from overrating the lot; it would be best to wait until reliable signals return.
Summary
Ichimoku Kinko Hyo is a unique instrument that let traders carry out a full technical analysis of the market without additional indicators. It helps define the trend on the market and find the closest support and resistance lines. Working with the indicator, traders have to follow serious rules that exclude intuitive positions. The main advantage is receiving signals in the direction of the current trend. However, no matter how good a trading system might be, the basics of trading, which is money management, is never to forget.
FAQ
How do you read the Ichimoku cloud?
Start with the price against the cloud: above it means an uptrend, below it a downtrend, inside it a sideways market. Then look at the thickness of the cloud, which shows how strong the support or resistance is, and at the Kumo twist ahead, where the cloud changes colour and the trend may turn.
What does it mean when the price is above the Ichimoku cloud?
The market is in an uptrend, and the cloud below the price works as support. Buy signals, such as a Golden Cross of Tenkan-sen and Kijun-sen, are stronger in this position, and sell signals are weaker.
Does Ichimoku work in forex?
Yes. It was built for the Japanese stock and commodity markets, and traders apply it to currency pairs on daily and weekly charts, and on H4 and H1 with the right settings. It works best in trending markets and gives many false signals in a flat.
What are the best Ichimoku settings for beginners?
The default 9, 26 and 52. They are what most traders watch, so the lines they draw matter most on the chart. Change them only after testing the alternative on history, for example 7, 22, 44 for faster signals or 20, 60, 120 for crypto.
Can you trade with Ichimoku alone?
Ichimoku is a complete system: it shows the trend, the levels and the entry and exit signals on one chart. Many traders still confirm its signals with price action or a key level, and every trade needs a stop loss and a position size that fits the deposit.
Any information provided in articles on this website is based solely on the personal opinions of the authors. These articles should not be construed as trading recommendations or a call to action. The authors and RoboForex accept no responsibility for the results of any trades made on the basis of these recommendations and reviews. Past performance is not indicative of future results. Trading stocks and CFDs involves a high risk of capital loss.