How to Use Elder's Triple Screen Trading System

The triple screen trading system by Alexander Elder checks every trade on three timeframes of the same instrument. The first screen, the longest, shows the main trend with EMA 13 and the MACD histogram. The second screen looks for a pullback against it with an oscillator such as Stochastic. The third screen times the entry with a Buy Stop or Sell Stop that follows the price. You trade only in the direction of the first screen.
TL;DR
- Pick your working timeframe for the second screen, then take one step longer for the first screen and one step shorter for the third.
- On the first screen, trade only in the direction of EMA 13 and the MACD histogram.
- On the second screen, wait for the oscillator to reach oversold in an uptrend or overbought in a downtrend, then enter with a trailing Buy Stop or Sell Stop and a stop behind the two-day low or high.
In this review, we will discuss a trading system called Triple Screen, designed by a popular trader and author Alexander Elder. This is one of the most famous strategies suitable for all financial markets.
How Does the Triple Screen Trading System Work
Elder’s Triple Screen system consists of searching for and picking trades by three criteria: three screens of the strategy. Each screen is the price chart of one and the same instrument on a certain timeframe, with additional indicator signals. The screens are analyzed from the longer timeframe to the shorter.
Each screen corresponds to a trend of certain length:
- The long-term trend corresponds to the first screen; in its direction, we will look for an entry point. The timeframe is a month long or shorter depending on your trading preferences.
- The mid-term trend corresponds to the second screen; it is one step shorter than the long-term one. This is your main working timeframe where we will search for an entry signal.
- The short-term trend is reflected on the third screen; the timeframe is one step smaller than the mid-term one. Helps find a suitable entry moment.
You need to choose a timeframe you prefer: this will be your mid-term trend (second screen). The long-term trend will be one step longer, the short-term one step shorter.
If your trades normally last for several days or weeks, a daily timeframe will suit your second screen. Then, for the first screen, you can take a weekly timeframe, and for the third screen, an hourly one will be ok. Intraday players can do likewise, using smaller timeframes. For example, if the mid-term trend is H1 or H4, the long-term will be D1, while the short-term one is M15 or M5.
In essence, the Triple Screen system is a filter for picking out trades along with the main trend after a correction, the classics of tech analysis. We find a long-term trend on the first screen, then the mid-term trend after a correction, and then find an entry point on the third screen (the shortest timeframe). Below, we will discuss analyzing each screen in more detail.
The table sums up the three screens for a trader whose working timeframe is D1.
| Screen | Timeframe | Tool | What it defines | Signal |
|---|---|---|---|---|
| First | W1 | EMA 13, MACD histogram (12, 26, 9) | The long-term trend, the main stream | EMA and histogram rising: look only for buys; falling: only for sells |
| Second | D1 | Stochastic (5, 3, 3), RSI, Williams %R or Force Index | The pullback against the trend, the wave | Oversold in an uptrend: prepare a buy; overbought in a downtrend: prepare a sell |
| Third | H1 or the price of D1 itself | Trailing Buy Stop or Sell Stop | The entry moment, the swell | Order one point beyond the high or low of the signal period; stop behind the two-day low or high |
Trade on the Go With RoboForex MobileTrader
A portable trading workstation on your phone, on Android and iOS.
First Screen
On this screen, we take the longest timeframe of all three and define the long-term trend, in which direction we will make a trade. For investors, a weekly or monthly chart will be the best choice; for traders, a smaller scale, such as W1, D1 or H4 will be better. Elder compares the long-term trend to the main stream, along with which we need to make a trade.
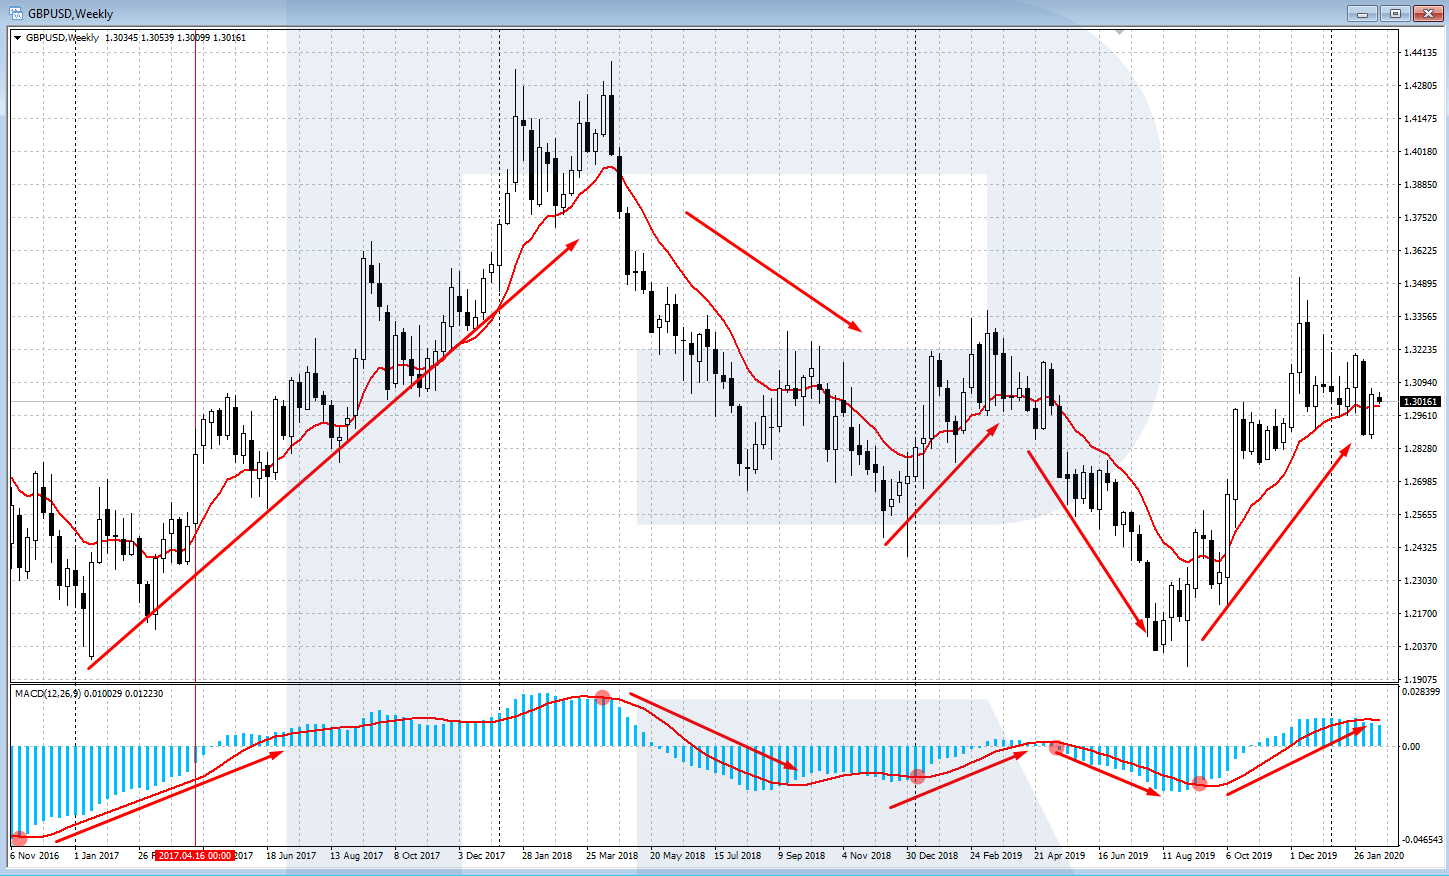
We define the trend by the methods of classical tech analysis and additional signals of trend indicators. Elder recommends EMA (Exponential Moving Average) with period 13 and the standard MACD (12,26,9) for defining the direction of the trend. A movement up- or downwards of the MACD histogram shows the direction of the current trend.
If the MACD histogram has reversed and is moving upwards from the area below 0, then we can speak about a long-term uptrend. If the MACD histogram has reversed and is moving downwards from the area above 0, then there is a long-term downtrend at the scene. Same with the EMA: if the EMA (13) is growing, the trend is ascending, if it is declining, then the trend is descending.
Second Screen
After we have defined the direction of the trend on the first screen, we switch to the second one. On this screen, we will have a chart with a smaller timeframe, on which we will search for a trend counter the long-term one, and wait for its reversal. Elder compared the mid-term trend with a wave rolling against the main stream.
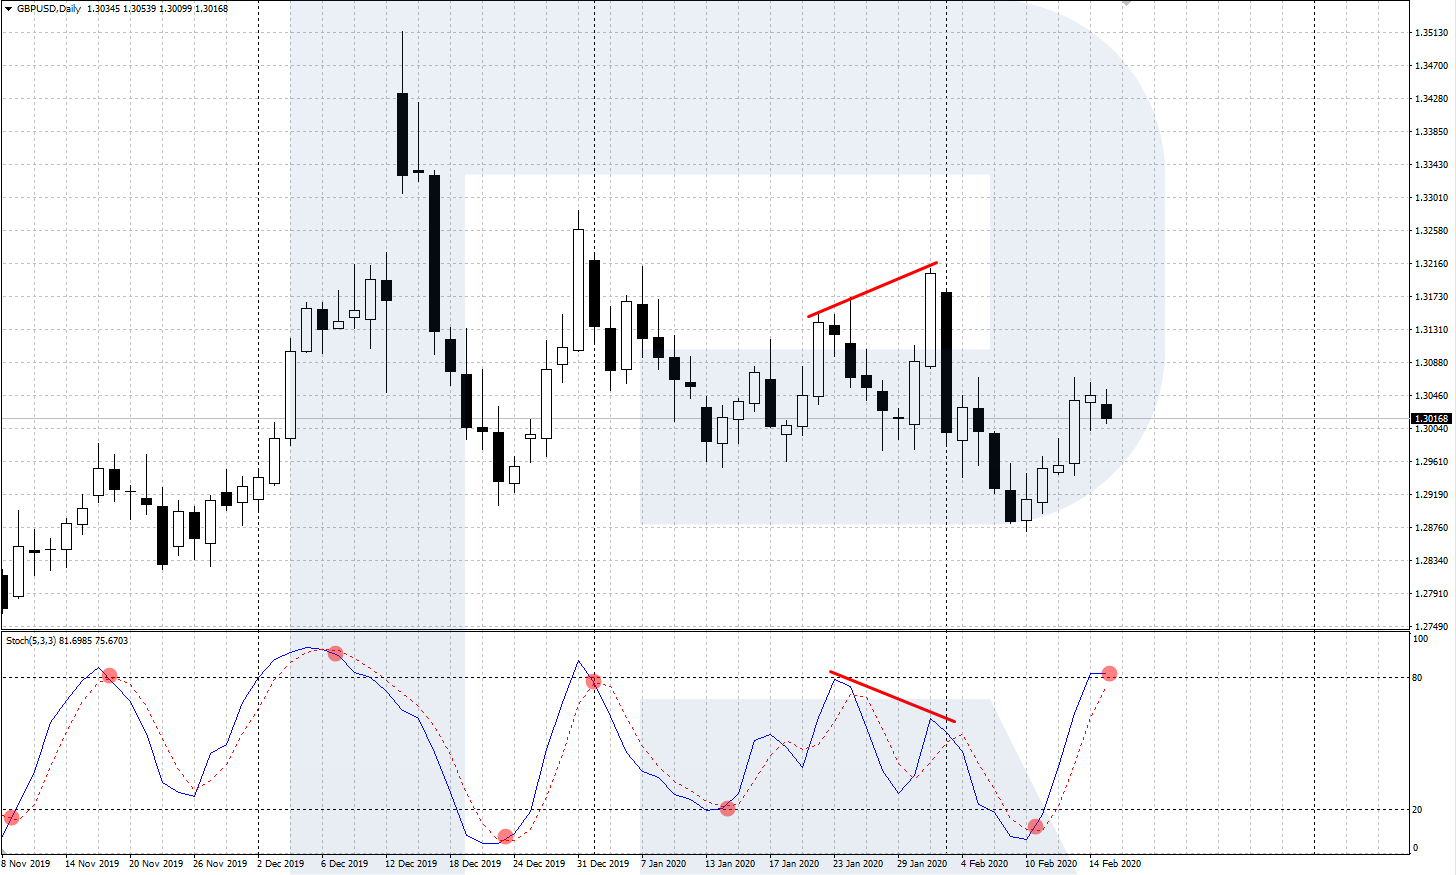
To define the point of the reversal of the mid-term trend in the direction of the long-term one, Elder recommends classic oscillators: Stochastic, RSI (Relative Strength Index), and Williams %R. When the oscillator enters the overbought/oversold area, an entry signal in the direction of the long-term trend will emerge. A divergence of the oscillator and the price chart can also be used.
As an example, let us take a popular oscillator Stochastic (5, 3, 3). If the mid-term trend is going down, we can expect the Stochastic to give a signal to buy, when the indicator lines %K and %D will cross in the oversold area (0% to 20%). And vice versa, if the mid-term trend is moving upwards, we wait for a signal from the Stochastic to sell, when %K and %D cross in the overbought area (80% to 100%).
Start Trading Now
Forex, stocks, indices and gold on MetaTrader 4 and MetaTrader 5, from a free demo account to a live one.
Third Screen
The third screen is additional; it helps choose the moment for opening a position. Elder compares it to the swell along the main stream. According to the author, the third screen does not require a separate chart analysis or indicator signals. This is the method of entering the trade with a Trailing Stop order.
If there is an uptrend on the first screen and a downtrend on the second one, the Trailing Stop will be catching a buy at a reversal upwards. The Buy Stop order is placed one point above the high of the previous period, in which we received the signal to buy from the oscillator. If the price is still going down, the order also moves down, one point above the high, until a buy opens or the main trend reverses, and then the trade is canceled. If the order was triggered, the SL is put behind the two-day low.
And vice versa: if the long-term trend is descending and the mid-term one is ascending, the Trailing Stop orders will be catching sales at the price movement downwards. The Sell Stop order is placed one point below the low of the previous period, in which the oscillator gave the signal to sell. If the price goes upwards then, the order is also to be moved after it one point below the low and go on like this until a sale opens or the long-term trend reverses, canceling the signal. If the trade is open, the SL is put behind the two-day high.
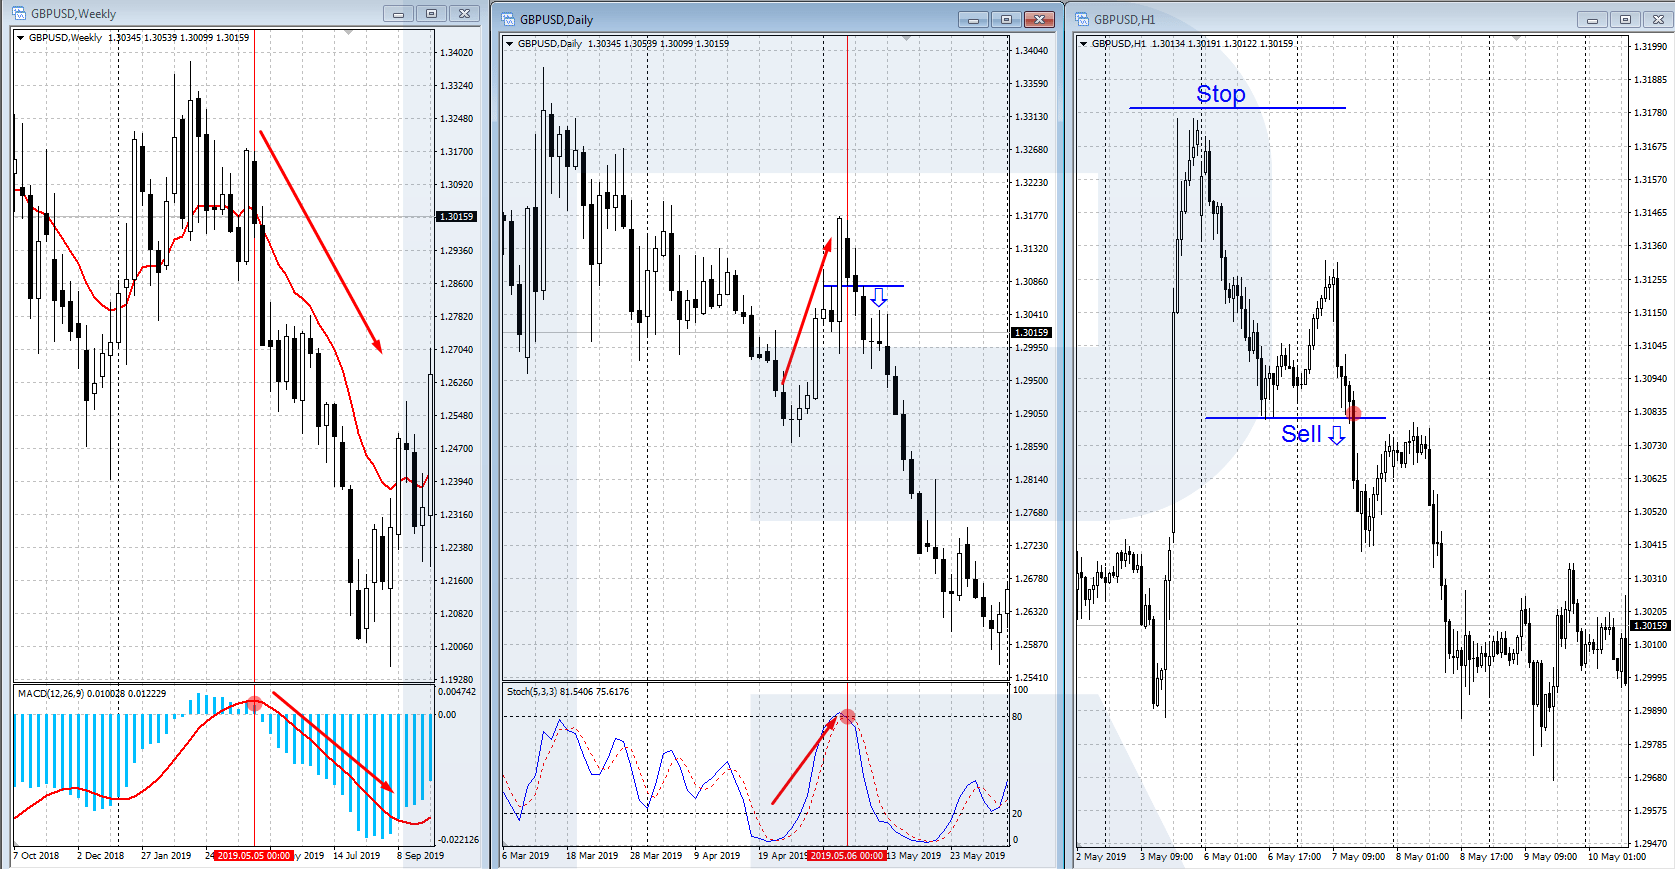
In my opinion, to make the success more probable, we should look for additional entry factors on the third screen, confirming the oscillator signal. Such factors may be: a bounce off a strong level, a false breakout of a level, tech analysis patterns, and candlestick or Price Action patterns.
Triple Screen Example on GBP/USD
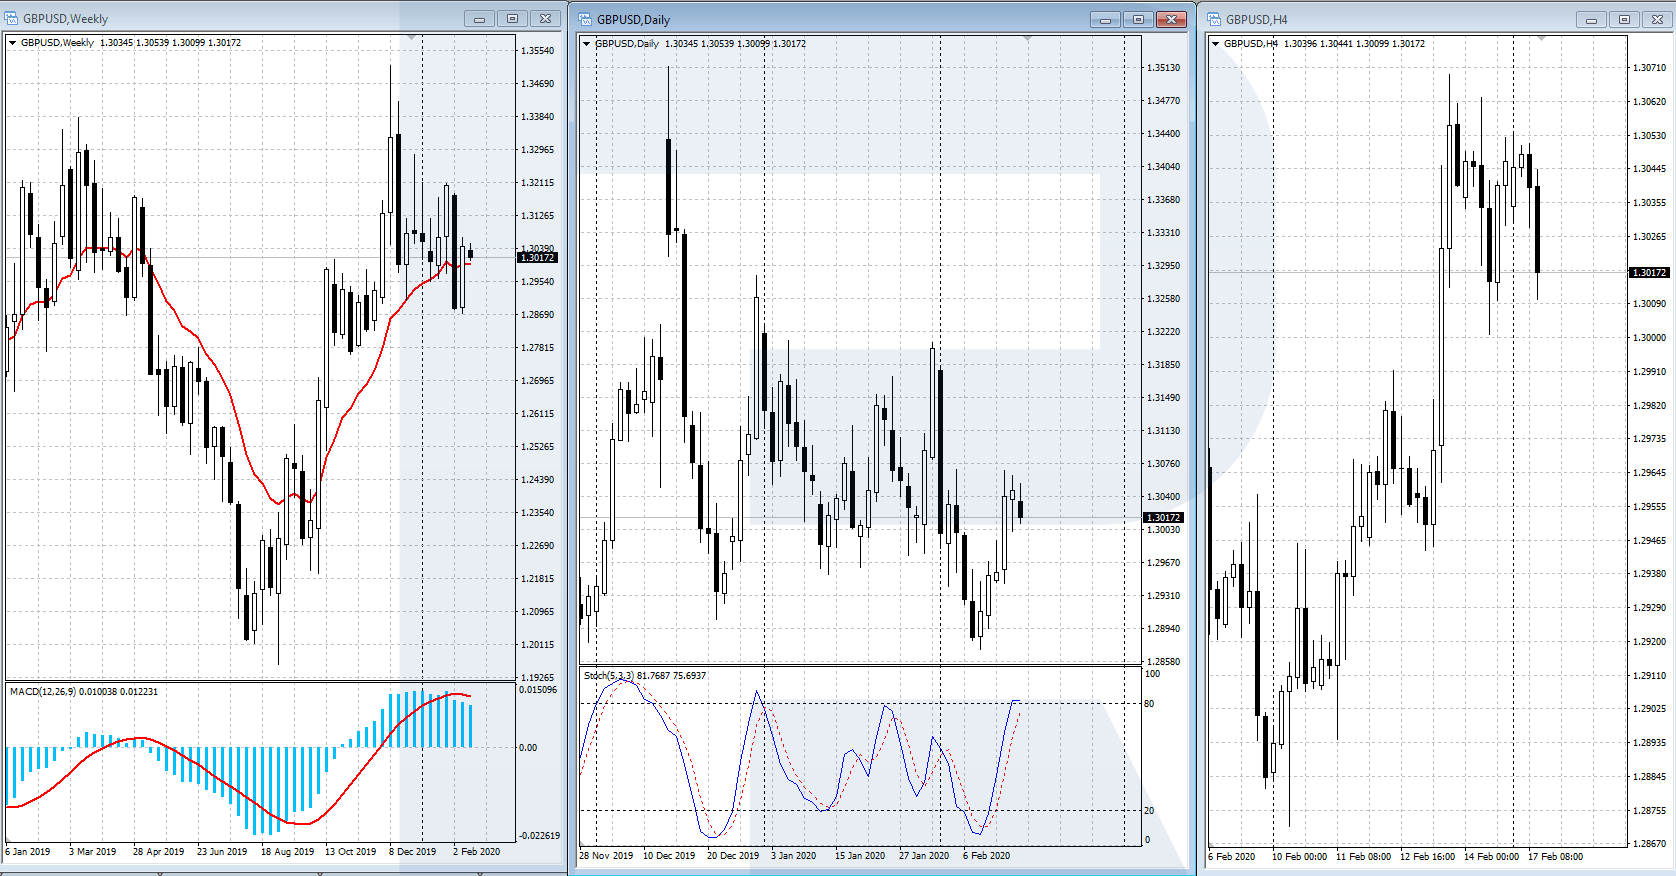
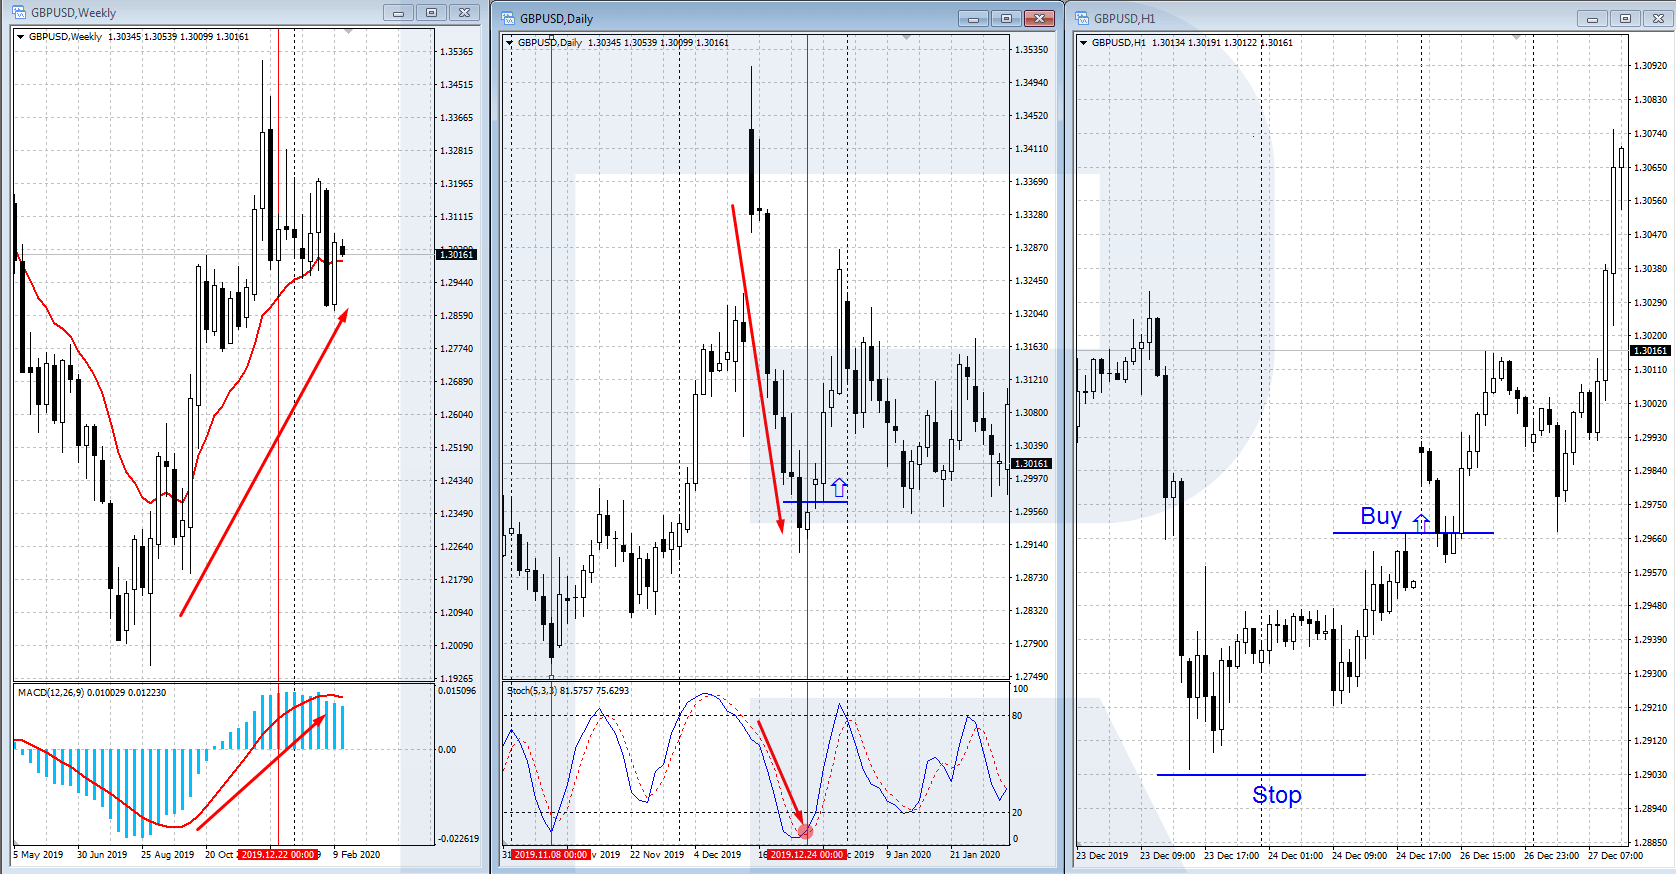
The chart below puts the three screens of the Elder triple screen together on one buy trade in GBP/USD, with W1 as the first screen, D1 as the second and H1 for the entry.
- W1, the trend. From September 2019 the weekly EMA 13 turns up and the MACD histogram rises from below zero. The long-term trend is up, so only buys are allowed.
- D1, the pullback. In December 2019 the pair falls sharply against the weekly trend. On 24 December Stochastic (5, 3, 3) drops into the oversold area below 20: the wave against the main stream is ending.
- H1, the entry. A Buy Stop goes one point above the high of the signal day and is moved down after the price while it keeps falling. When the price turns up, the order triggers and opens the buy.
- The stop. The Stop Loss goes behind the two-day low. The trade stays open while the weekly trend points up.
The same steps work on any instrument and timeframe set. To practise, open the EUR/USD chart on W1, D1 and H1, or D1, H4 and M15 for intraday trading, and look for the moment when the screens agree.
Indicator Settings for Each Screen
The Elder triple screen needs only a few standard indicators, all available in MetaTrader 4:
- First screen: EMA 13 and MACD histogram (12, 26, 9). Elder reads the slope of the histogram over the last two bars: a higher bar means bulls are in control, a lower one means bears are. Note that the standard MACD in MetaTrader 4 draws the MACD line itself as bars. Elder’s histogram is the difference between the MACD line and its signal line, which MetaTrader 4 shows as the OsMA indicator with the same 12, 26, 9 settings.
- Second screen: Stochastic (5, 3, 3) or Force Index. For Stochastic, the levels are 20 and 80. Force Index multiplies the price change by volume; Elder smooths it with a 2-period EMA. In an uptrend, a dip of Force Index below zero marks a buying opportunity; in a downtrend, a rise above zero marks a selling one. RSI and Williams %R work in the same way through their overbought and oversold zones.
- Third screen: no indicator. The entry comes from the trailing Buy Stop or Sell Stop, placed one point beyond the high or low of the previous bar.
Keep the settings the same on every instrument, from currency pairs to the other forex assets, so that the signals stay comparable and your trading record stays meaningful.
Closing Thoughts
Alexander Elder’s Triple Screen trading system has become widely popular because it is universal and suitable for different financial markets. This method provides an overall look at an instrument, letting the trader assess the behavior of the instrument on different timeframes and find an entry along with the main trend.
However, I would like to note that the signal from just an oscillator seems not enough; it would be wiser to add tech analysis signals: support and resistance levels, price and Price Action patterns. In his works, Elder pays a lot of attention to the psychology and money management. In more detail, his approach can be studied by the book “Trading for a Living”.
FAQ
What is the Elder triple screen trading system?
A method by Alexander Elder that checks every trade on three timeframes of one instrument. The longest shows the trend, the middle one a pullback against it, and the shortest the moment to enter in the direction of the trend.
Which timeframes should I use for the triple screen?
Start from your working timeframe for the second screen. Take one step longer for the first screen and one step shorter for the third: W1, D1 and H1 for swing trading, or D1, H4 and M15 for intraday trading.
Which indicators does the Elder triple screen use?
EMA 13 and the MACD histogram (12, 26, 9) on the first screen, an oscillator such as Stochastic (5, 3, 3), RSI, Williams %R or Force Index on the second, and a trailing Buy Stop or Sell Stop on the third.
Where do I place the stop loss in the triple screen?
Behind the two-day low for a buy and behind the two-day high for a sell, once the trailing Buy Stop or Sell Stop has triggered.
Does the triple screen trading system work on forex?
Yes. Elder designed it as a universal method, and it works on currency pairs, stocks and commodities alike. It suits trend markets best, so add support and resistance levels or Price Action patterns to filter the signals.
Any information provided in articles on this website is based solely on the personal opinions of the authors. These articles should not be construed as trading recommendations or a call to action. The authors and RoboForex accept no responsibility for the results of any trades made on the basis of these recommendations and reviews. Past performance is not indicative of future results. Trading stocks and CFDs involves a high risk of capital loss.