How to Trade with ZigZag Indicator: Settings and Use

The ZigZag indicator draws a broken line through the significant highs and lows of the price chart and ignores the smaller moves between them. Its three settings, Depth, Deviation and Backstep, decide how large a move must be to count. Traders use it to see the trend and its waves, to mark swing points for levels and patterns, and to time entries after a new extreme is confirmed. The last line of the indicator can still change, so it is read only once the extreme is fixed.
TL;DR
- Add ZigZag in MT4 or MT5 with the default ZigZag settings 12, 5, 3, and raise Depth for fewer, larger swings.
- Treat the last line as provisional: it repaints until the price moves far enough away from the extreme.
- Trade in the direction of the trend: buy after a confirmed low in an uptrend, sell after a confirmed high in a downtrend, with the stop loss beyond the extreme.
In this review, we will discuss a popular forex indicator called ZigZag. This indicator makes it easier to interpret charts, showing important price changes, and helps to carry out tech analysis.
What Is ZigZag and Is It Helpful?
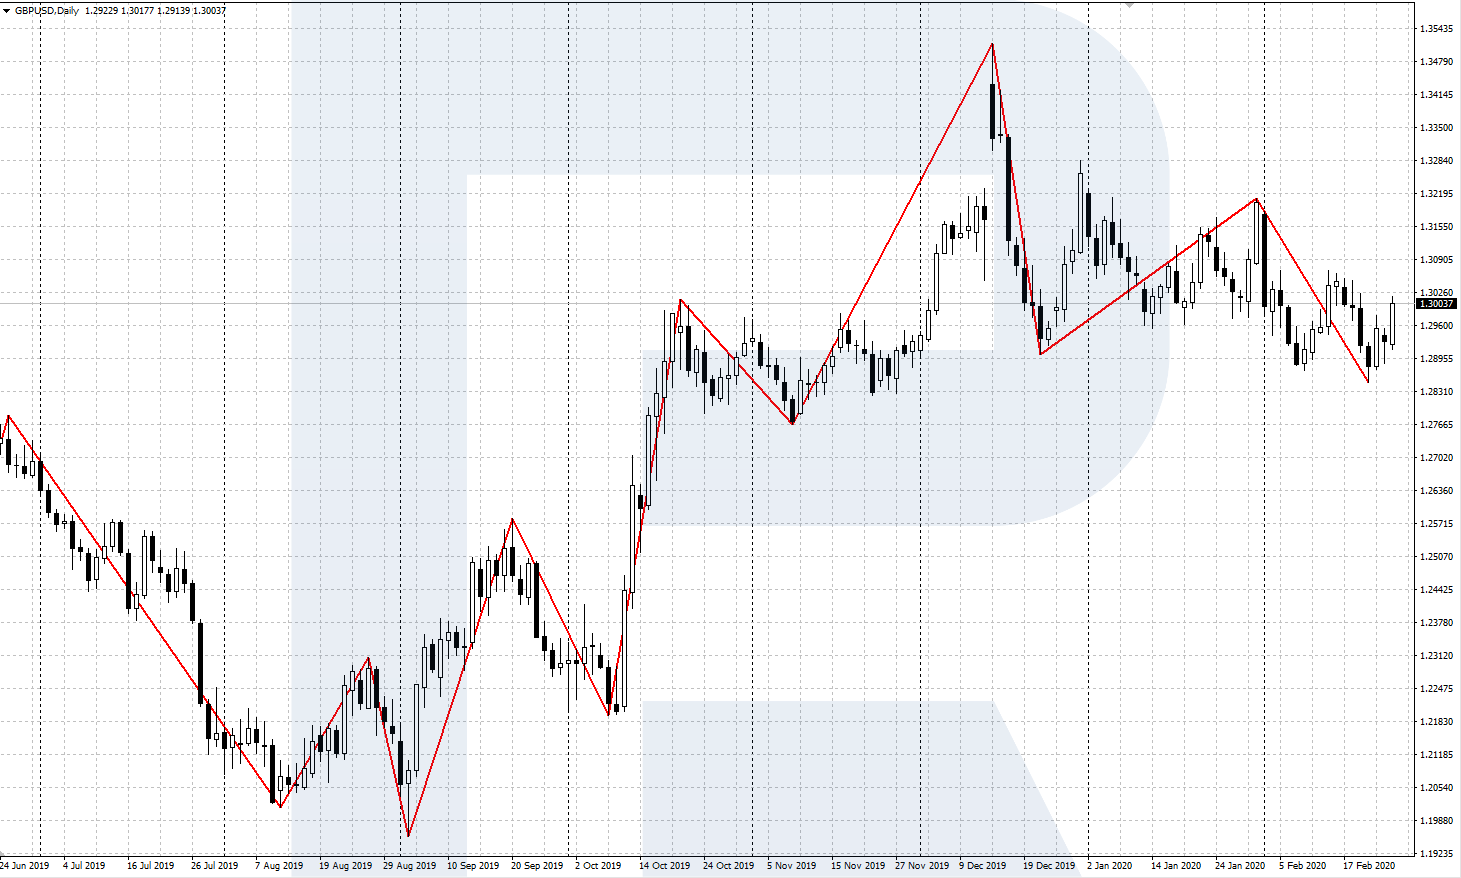
ZigZag is quite a popular indicator featured by many trading platforms, including MT4 and MT5. The indicator is a broken line linking lows and highs on the price chart. As long as ZigZag is drawn through the most important highs and lows, it is very easy to use for price chart analysis.
ZigZag links highs and lows on the chart in accordance with the settings. You must keep in mind that the last line of the indicator remains incomplete until the last high or low is formed.
ZigZag helps analyze the price movement on the chart. Traders who use Elliott waves in their strategy, often use ZigZag as well to identify waves. It helps to filter minor "noise" on the chart and to define current wave structure (motive or corrective).
Also, ZigZag will help define the actual trend and draw trendlines. With it, it is easier to find technical support and resistance levels, price and tech analysis patterns. As a rule, ZigZag supplements tech analysis or helps find trading signals along with other indicators.
Trade on the Go With RoboForex MobileTrader
A portable trading workstation on your phone, on Android and iOS.
Characteristics and Settings
On popular trading platforms MetaTrader 4 and MetaTrader 5, ZigZag applies on the chart of an instrument via the Main menu: Insert - Indicators - Custom - ZigZag.
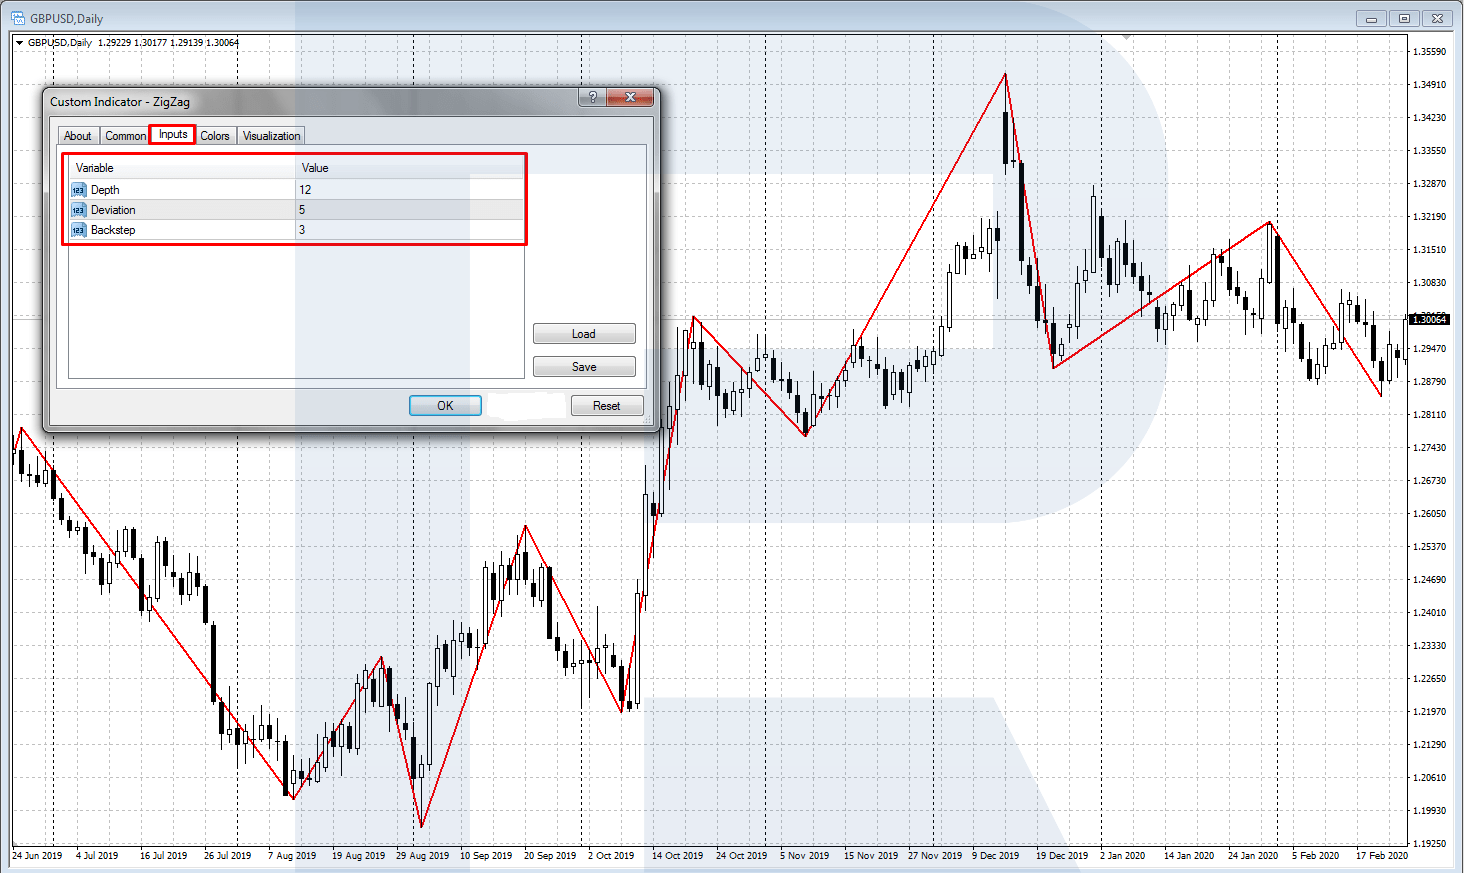
A standard ZigZag has three main settings:
- Deviation sets the minimal price change necessary for the indicator to form a high/low on the chart. It is measured in points, by default set as 5.
- Depth sets the minimal interval on which the indicator will draw a new extreme if the Deviation setting is complied with. It is measured in the number of candlesticks, the default setting is 12.
- Backstep is the minimal number of candlesticks that must divide two local extremes. At this interval, new highs/lows will not be drawn if they differ from the previous ones for the size of Deviation. The default setting is 3.
ZigZag is normally used with default settings. Of course, they can always be altered, evaluate the effect of the new settings historically and choose optimal parameters for your trading style.
The logic of the indicator line on the chart (with default settings) is as follows:
First, ZigZag chooses an extreme on an interval of 12 candlesticks. The number of candlesticks set by Depth in the indicator settings.
If the price was growing for some time and then started to decline, the indicator starts looking for a local high on the 12-candlestick interval.
The Deviation parameter (5 points) sets how far the price must move for the indicator to count a new extreme.
If the price does not reverse down and grows by more than 5 points above the previous high, the high will be transferred to a new peak.
When the price declines, a new low will be formed after ZigZag defines the local extreme by the same algorithm.
ZigZag Settings Explained
The default ZigZag settings 12, 5, 3 suit most charts, and changing them is a trade-off between detail and noise. Higher values make the indicator ignore smaller swings: the line becomes smoother, shows only the main waves and gives fewer signals. Lower values make it follow every small move: the line shows more detail, but also more noise and more false turns. The table shows what each setting changes.
| Setting | Default | What it controls | If you raise it | If you lower it |
|---|---|---|---|---|
| Depth | 12 | The number of candles in which a new extreme is searched for | Fewer, larger swings, suited to swing trading | More, smaller swings, suited to short-term trading |
| Deviation | 5 | The minimum price change needed to form a new extreme | Small pullbacks no longer count as turns | Almost every pullback becomes a new line |
| Backstep | 3 | The minimum number of candles between two extremes | Extremes close together merge into one | Extremes can form on neighbouring candles |
A practical way to choose the settings is to match them to your timeframe. On H1 and H4, the defaults usually mark the swings a trader would draw by hand. On M5 and M15, many traders raise Depth to 20 or more to cut the noise; on D1 and W1, the defaults already show the main waves. Whatever you choose, check it on the history of your instrument and keep the same values once your strategy is built on them.
Trading With ZigZag
You can use the indicator as an independent trading system, but most often it is used with other trading instruments to make trading more efficient. Let us discuss two trading methods.
Both methods rely on the same idea: the ZigZag indicator shows where the market has already turned, so a trade opens only after a new extreme is confirmed, never on the line that is still being drawn. In a trend, the indicator marks each pullback, and the trader joins the trend when the pullback ends. At a reversal, it marks the swing points of the 1-2-3 pattern, and the trader enters when the new direction breaks the last one. In both cases, ZigZag supplies the structure, while a separate tool defines the trend: classic tech analysis, a trendline or a trend indicator. The stop loss goes a few points beyond the extreme that ZigZag has confirmed, so the risk of each trade is known before it opens. The exit also comes from the indicator: the trade closes when ZigZag forms the next opposite extreme.
Trading the Trend With ZigZag
This method uses ZigZag signals to trade the main trend. To define the direction of the trend, we recommend using classic tech analysis or trend indicators.
Buying Along With the Trend
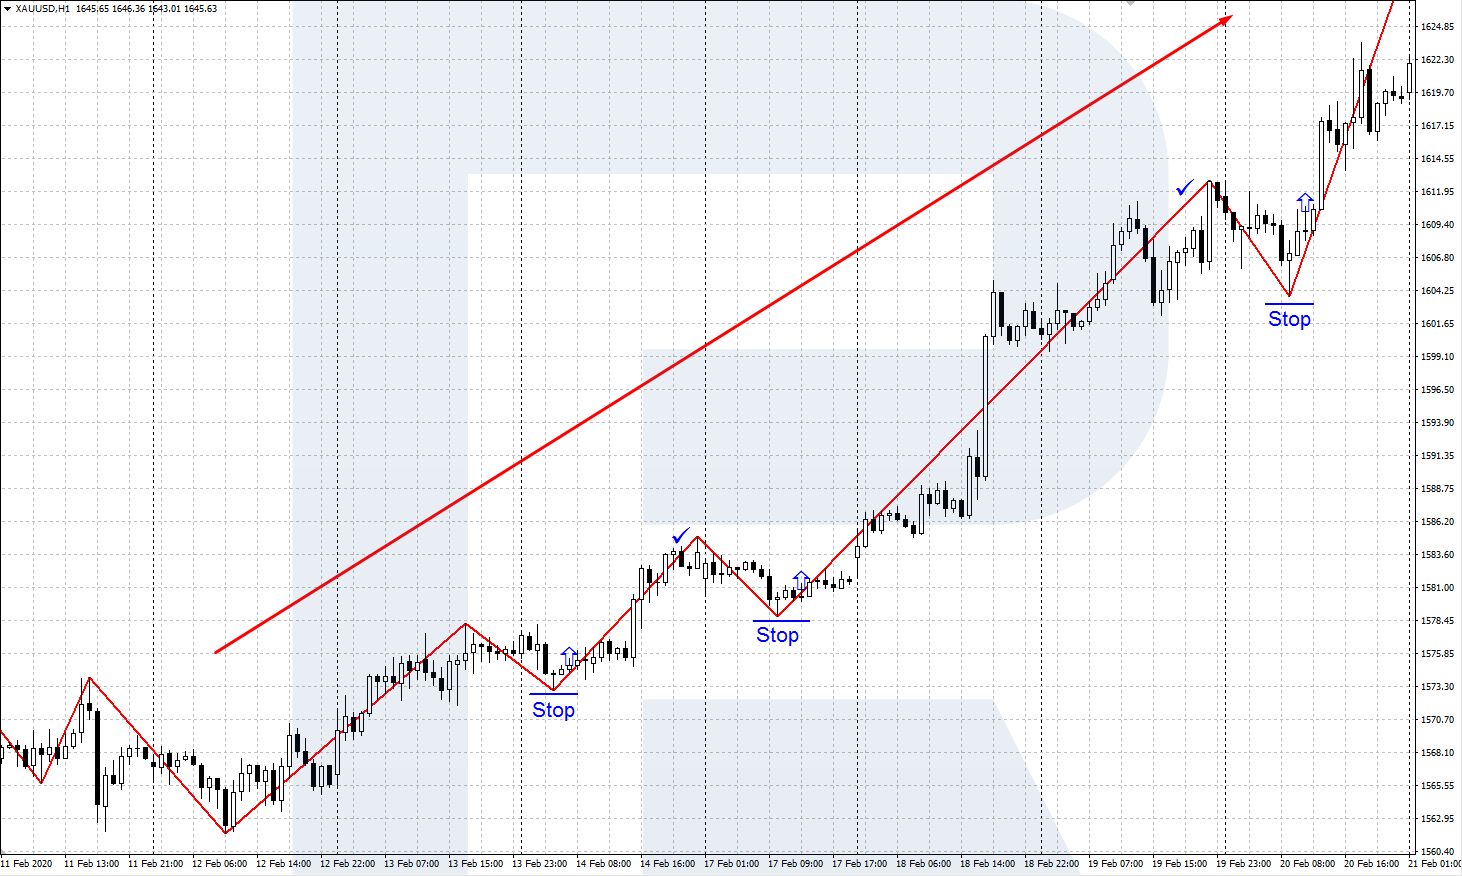
Define an uptrend on the market. Wait for ZigZag to form another low. After two candlesticks to the right from the low close, enter the market to buy. Place a Stop Loss 5 points below the low of the indicator. Do not place a Take Profit, close the buy right after ZigZag forms another high.
Selling Along With the Trend
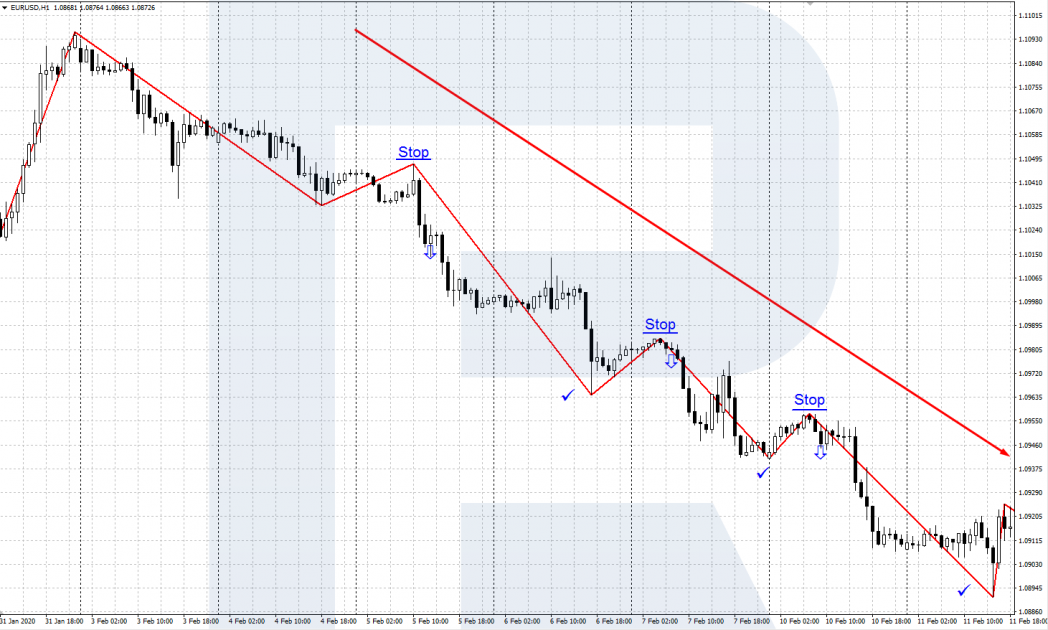
Define a downtrend on the market. Wait for ZigZag to form another high. After two candlesticks to the right from the high close, enter the market to sell. Place a Stop Loss 5 points above the high of the indicator. Do not place a Take Profit, close the trade right after ZigZag forms another low.
Start Trading Now
Forex, stocks, indices and gold on MetaTrader 4 and MetaTrader 5, from a free demo account to a live one.
ZigZag + 1-2-3 Reversal
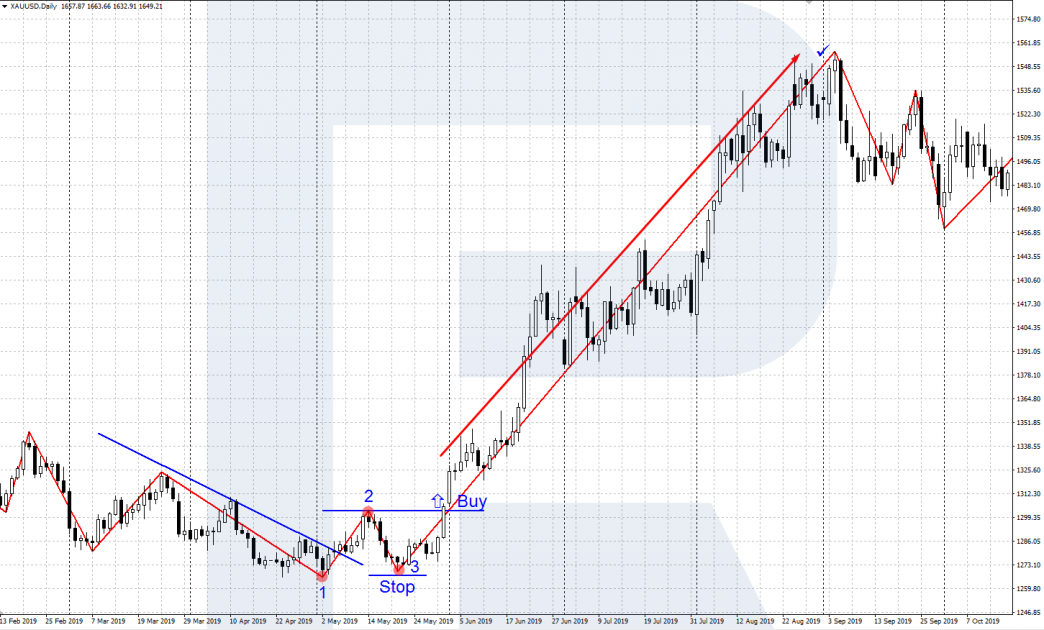
In this method, the indicator helps find and use Sperandeo’s 1-2-3 reversal pattern:
- Find the actual trend and draw a trendline by Sperandeo.
- The last and lowest low of the trend is marked as point 1.
- Wait for ZigZag to cross the trendline and form a new local high: this will be point 2.
- Then a correction must follow and a local low at ZigZag must form; it must not be lower than point 1. This local low will be called point 3 of the reversal pattern.
- After point three forms, in point 2, place a pending order Buy Stop; the Stop Loss is somewhat below point 3.
- After the position opens, track the price moving upwards and close the position after ZigZag forms a local high.
How ZigZag Repaints and How to Read It
The ZigZag indicator repaints: its last line keeps moving until the market confirms the extreme. While the price keeps rising, the indicator moves the high up to each new peak; only when the price has fallen back by the Deviation value and enough candles have passed does the high become fixed. On a live chart, a turn that looked complete can disappear an hour later.
That is why the ZigZag indicator looks perfect on history: every line there is final, with every high and low in exactly the right place, which was not visible at the time. Read it in three steps:
- Ignore the last line for entries. Use only the extremes that are already fixed.
- Wait for confirmation, as in the methods above: two candles after the low or high, or a break of the previous swing.
- Test fairly. A backtest or an Expert Advisor must read only confirmed points, or its results will be better than anything a trader could repeat.
Used this way, the ZigZag indicator is a map of the market's structure; its lag is the price of that clarity.
Closing Thoughts
The ZigZag indicator is quite popular among traders, though, in essence, it simply shows the price fluctuations in a simpler way. The indicator helps see the main price movement clearer, cutting off useless market “noise”. Also, ZigZag is a good helper in identifying Elliott waves.
To my mind, ZigZag is a comfortable and accessible (available on most platforms) instrument that enhances your tech analysis. It will supplement well almost any trading system. With ZigZag, you can automatize (creating an expert advisor) various trading strategies. The indicator is also a common first step to find harmonic patterns, which are built on its swing points.
FAQ
What does the ZigZag indicator show?
The significant highs and lows of the price, joined by straight lines. It filters out moves smaller than its settings, so the chart shows only the main swings of the trend.
What are the best ZigZag settings?
The defaults, Depth 12, Deviation 5 and Backstep 3, suit most charts from H1 to D1. On M5 and M15 many traders raise Depth to 20 or more for fewer, cleaner swings. Test any change on the history of your instrument.
Does the ZigZag indicator repaint?
Yes. Its last line keeps moving to each new high or low until the price moves far enough in the opposite direction. The earlier lines are fixed, so trade only on extremes that are already confirmed.
Can I trade with ZigZag alone?
It is possible, but most traders combine it with a trend tool, such as a trendline or a moving average, because ZigZag shows the structure of the market, while the trend tool gives the direction. The article shows a trend method and a 1-2-3 reversal method built this way.
Where is ZigZag in MT4?
Open Insert -> Indicators in the main menu and choose ZigZag from the list of indicators that come with the terminal. It is also available in the Navigator window, from where it can be dragged onto the chart.
Any information provided in articles on this website is based solely on the personal opinions of the authors. These articles should not be construed as trading recommendations or a call to action. The authors and RoboForex accept no responsibility for the results of any trades made on the basis of these recommendations and reviews. Past performance is not indicative of future results. Trading stocks and CFDs involves a high risk of capital loss.