MACD Indicator: Settings, Trading, Divergence

The MACD indicator (Moving Average Convergence/Divergence) shows the direction and strength of a trend through the gap between two exponential moving averages, with the standard settings 12, 26 and 9. When the MACD line is above zero and rising, buyers are in control; when it is below zero and falling, sellers are. Traders use it for three signals: crossings of the signal line, crossings of the zero line and MACD divergence with the price.
TL;DR
- Start with the standard MACD settings 12, 26, 9 on the timeframe you trade.
- Read the trend from the side of the zero line and enter on a crossing of the signal line in that direction.
- Look for MACD divergence with the price as a warning of a reversal, and trade it in the direction of the higher timeframe trend.
What Is the MACD Indicator
The MACD is one of the most popular technical indicators. It is included into most trading platforms for financial and commodity markets.

The indicator was created almost 40 years ago by Gerald Appel. It was first used in 1979. MACD is an abbreviation of the phrase Moving Average Convergence/Divergence.
The indicator is used in technical analysis. It helps determine the direction of the trend, its strength and duration; price range, reversal levels; it also gives trading signals.
This indicator is called a trend indicator because it is formed on the basis of two Moving Averages. They are not visible on the chart, only their values are used in calculations. The indications of the MACD are displayed in a separate window under the chart. Practically, we have a trend oscillator. A classical MACD chart is a histogram with vertical bars and an additional smoothing line. The histogram represents the space between the Moving Averages and the dynamics of their convergence or divergence. When the space between the Averages grows, the bars of the histogram also become longer. If the space becomes smaller, the bars shorten. When they line up above the zero line and grow longer, the price is considered to grow. When the bars of the histogram gather below zero and grow shorter, the price is expected to drop.
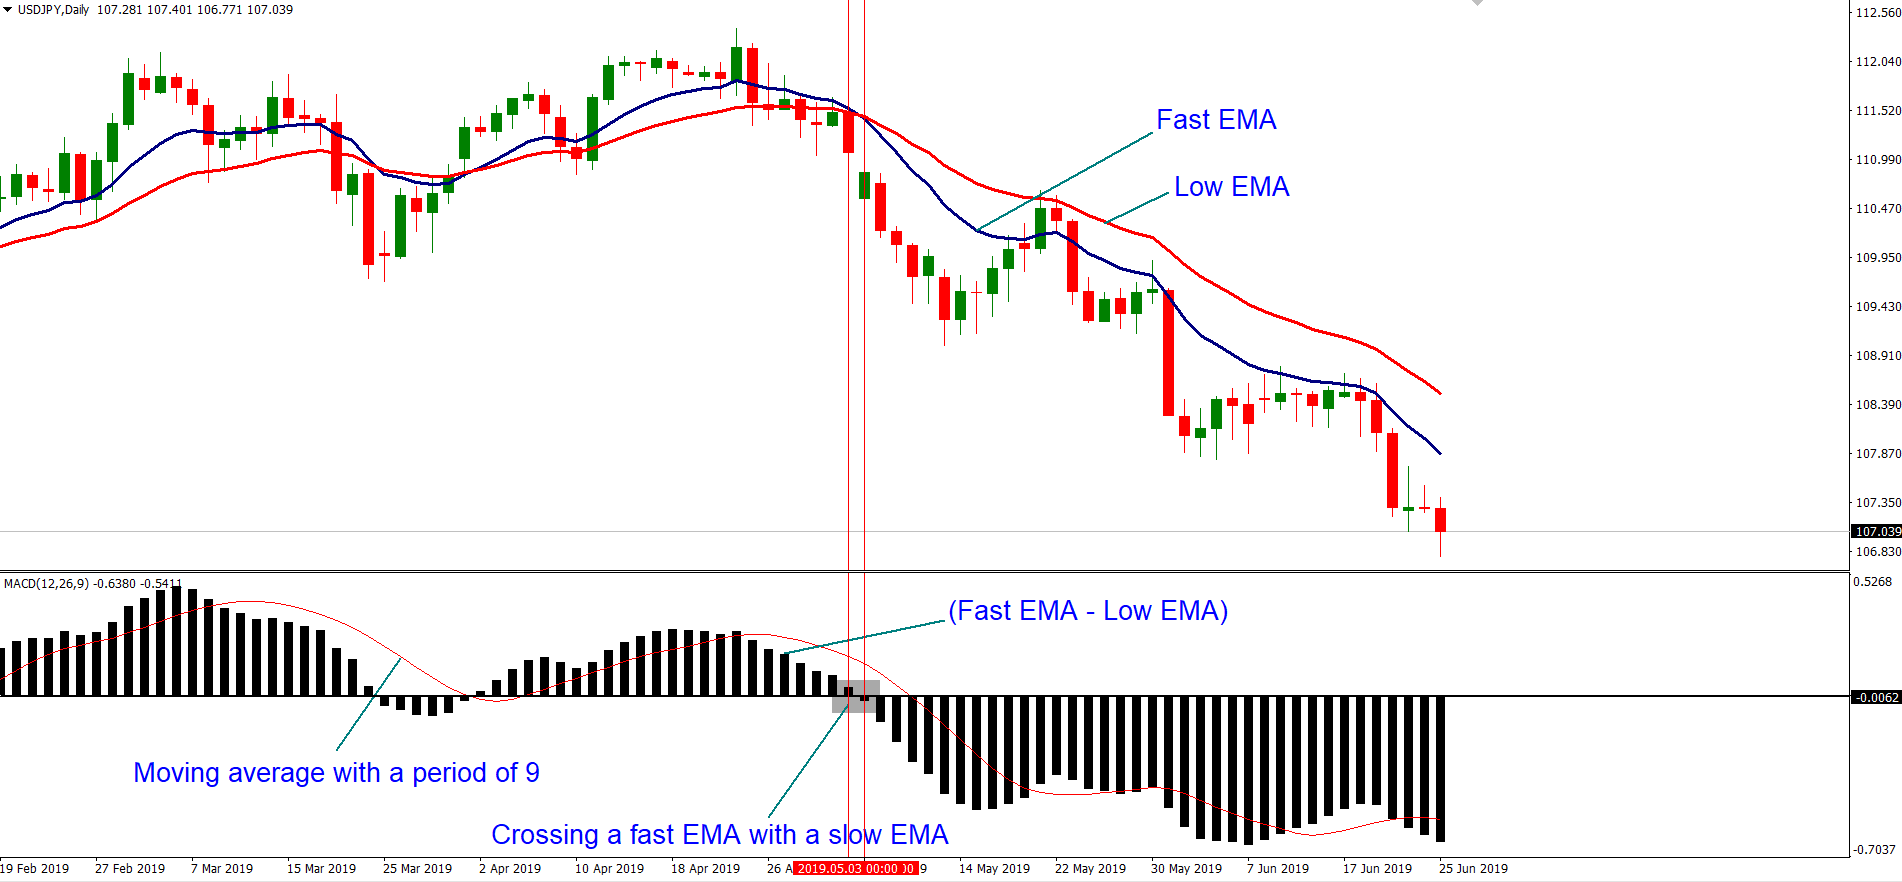
The MACD is a lagging indicator by its nature as it receives initial data from the quick (period 12) and slow (period 26) Exponential Moving Averages (EMA). The third component of the indicator is the Simple Moving Average (SMA) with the smoothing period 9. As long as the price is primary and the Averages are secondary, all of them are lagging behind the price. The SMA determines the trend by its position in relation to the central zero line. When the SMA is above the zero line, it signals an ascending trend; when it is below, the trend is descending. The SMA is also called a signal line and used for additional confirmation of trading signals.
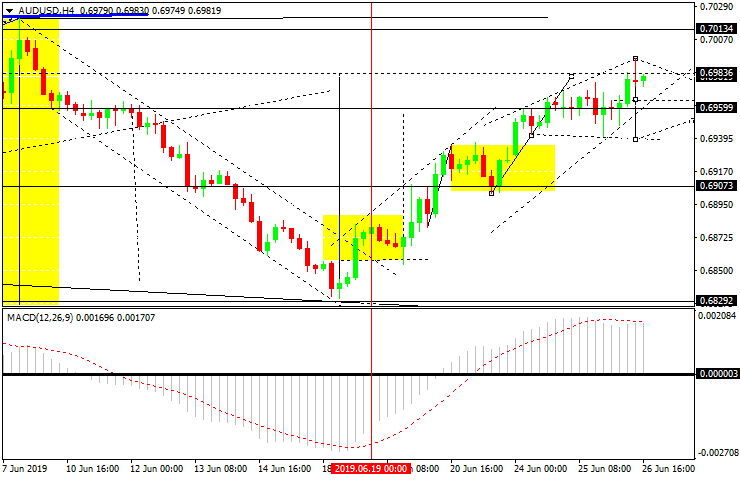
MACD fans have recently improved the indicator, so that nowadays lots of versions are available on the Internet, including colored ones.
Trade on the Go With RoboForex MobileTrader
A portable trading workstation on your phone, on Android and iOS.
MACD Formula and Calculation
The MACD indicator is built from three values, each calculated from the one before:
- MACD line = EMA 12 of the closing price minus EMA 26 of the closing price. It is above zero when the fast average is above the slow one.
- Signal line = a 9-period average of the MACD line. In the classic version it is an EMA; MetaTrader 4 uses an SMA, as described above.
- Histogram = MACD line minus signal line. It grows when the MACD line moves away from the signal line and shrinks when the two converge.
One detail matters when you compare charts from different platforms. In the classic MACD, the bars show the third value, the histogram. The built-in MACD indicator in MetaTrader 4 draws the MACD line itself as bars and the signal line as a curve; the classic histogram is available there as a separate indicator, OsMA. The logic of the signals is the same, but the bars cross zero at different moments.
MACD Settings
Fast EMA is calculated as the average price during a set period (12 candlesticks by default).
Slow EMA also represents an average price but during a longer period, which is reflected in its name.
The difference between the quick and slow EMAs is shown by histograms, each of them having a separate meaning; MACD SMA is calculated as the average value of the histograms during a set period of time (by default, the smoothing period is 9).
The setting "Apply to:" is used with the input data for the MACD. For example, the default value is "Close"; this means that the quick EMA will be calculated on the basis of the closing price of the candlesticks. If the setting is changed for "Open", the opening price will be used. The indicator features 7 basic parameters for calculating an average price:
- Close
- Open
- High
- Low
- Median Price, calculated as (High + Low) / 2
- Typical Price, calculated as (High + Low + Close) / 3
- Weighted Close, calculated as (High + Low + 2*Close) / 4
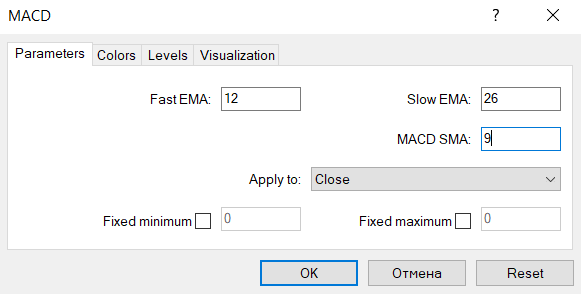
MACD results are based on quick and slow EMA settings. If the period is too short, the indicator becomes too sensitive to the price fluctuations and starts giving lots of false signals. If the period is too long, the indicator becomes slower, which makes the signals more accurate but more scarce. The standard MACD settings are most spread ones on the market (12/26/9).
MACD Parameters on the Chart
MACD Settings for Different Timeframes
The standard settings of the MACD indicator, 12, 26, 9, work on every timeframe, and most traders keep them because everyone else watches the same values. Changing them is a trade-off: shorter periods react faster and give more signals, most of them noise; longer periods react later and give fewer, cleaner signals. The table shows the combinations traders use most often. Whatever you choose, test it on the history of your instrument before trading it, for example on the EUR/USD chart.
| Timeframe | MACD settings | What changes |
|---|---|---|
| M5 to M15 | 8, 17, 9 | Faster reaction for intraday trading, more signals and more noise |
| H1 to H4 | 12, 26, 9 | The standard, a balance of speed and reliability |
| D1 | 12, 26, 9 | The standard, the values most traders watch |
| W1 | 19, 39, 9 | Slower, filters out short swings, few signals |
| Any, for divergences | 5, 35, 5 | A sharper histogram that shows momentum peaks clearly |
MACD Divergence and Convergence
As the name of MACD (Moving Average Convergence/Divergence) states, the function of the indicator is primarily detecting convergence and divergence on charts. They are important elements of technical analysis and rather strong signals of trend reversals. Convergence and divergence occur when price dynamics is not supported by increase of supply or demand, in other words, the trend weakens.
Divergence and convergence are derived from the Latin words "divergere" (deviation, discrepancy) and "convergo" (closing on). But what is diverging/converging and where? In our case we are looking at the difference between the price chart and the indicator (oscillator) chart.
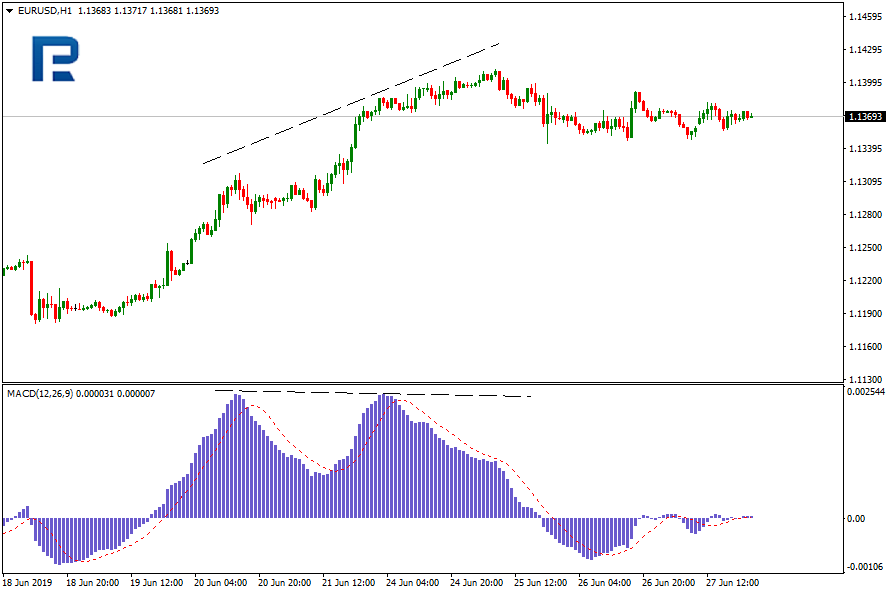
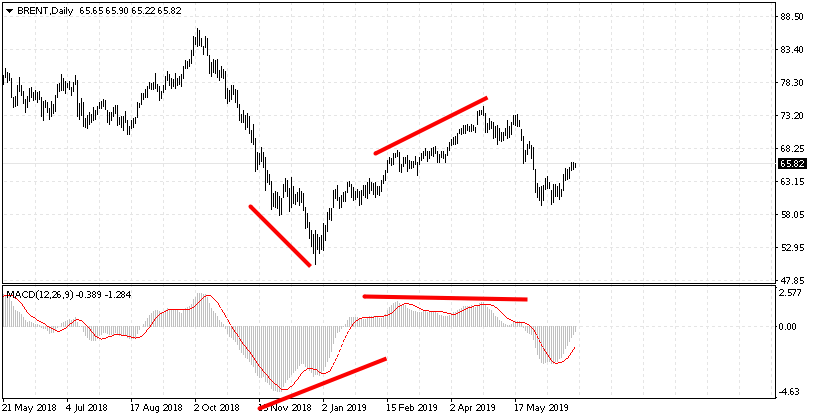
- Divergence is a bearish signal that appears in the presence of an ascending trend, when the price on the chart takes new highs while the MACD, conversely, shows lower peaks.
- Convergence is a bullish signal that appears in the presence of a descending trend when the price chart demonstrates new lows while minimal values on the indicator stay the same or grow.
The article on divergence and convergence in trading covers these signals on other oscillators as well.
Start Trading Now
Forex, stocks, indices and gold on MetaTrader 4 and MetaTrader 5, from a free demo account to a live one.
Types of Convergence and Divergence
Divergences and convergences can be of two types: classic and hidden.
Classic divergences and convergences are the most popular instruments of technical analysis in the practice of trading. Usually, they look like this:
Classic Divergence
Classic Convergence
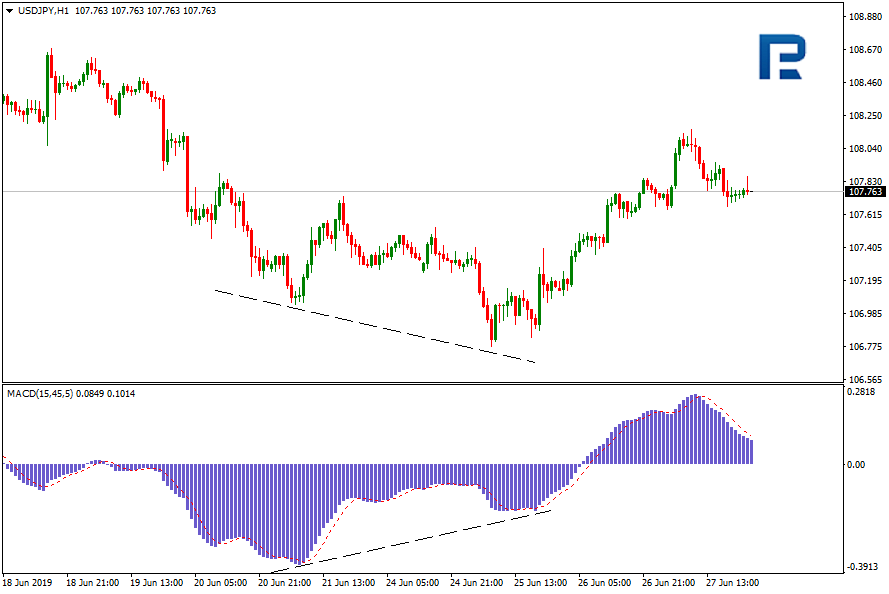
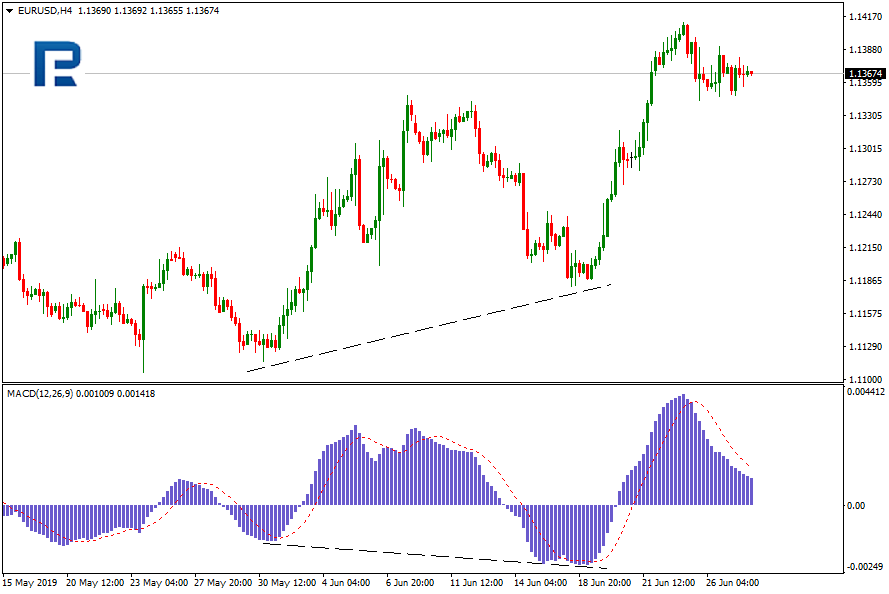
Apart from the classic ones, there are also hidden convergences/divergences. Hidden divergences and convergences also represent the difference between the price chart and the indicator values; the thing is, they are models of trend continuation.
Hidden Bearish Divergence
It appears when price maximums decline while oscillator maximums grow.
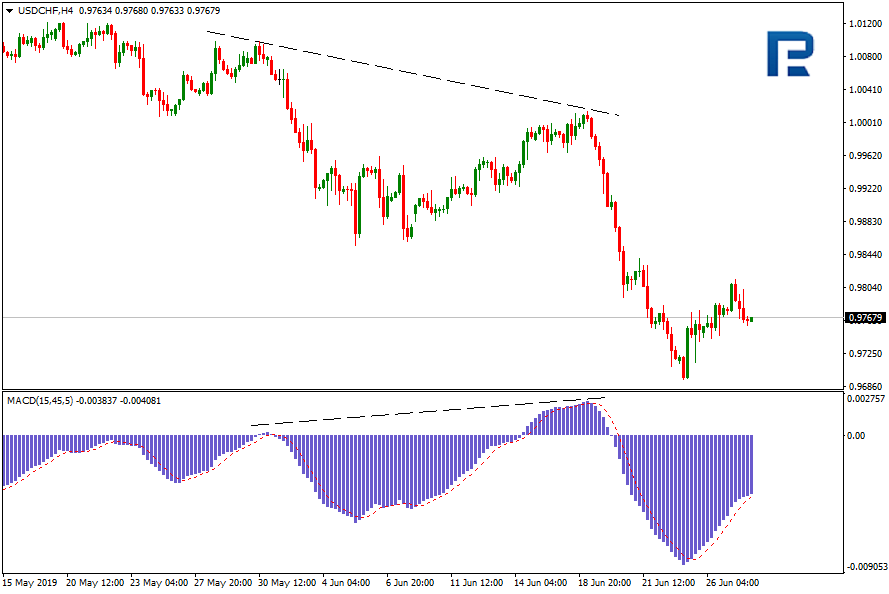
Hidden Bullish Convergence
It appears when price minimums grow while oscillator minimums decline.
Divergences and convergences are merely types of trading signals; however, they are signals of high quality that make trading potentially more successful. No one can be absolutely sure whether the correction will be short or deep and whether it will turn into a reversal; nevertheless, such signals as divergence and convergence make predictions more accurate.
The table sums up the four types of MACD divergence described above.
| Type | Price chart | MACD | Signal | Reliability |
|---|---|---|---|---|
| Classic divergence | Higher high | Lower high | Bearish, a possible reversal down | Good in a sideways market and at the end of a trend, weaker in a strong trend |
| Classic convergence | Lower low | Level or higher low | Bullish, a possible reversal up | Good in a sideways market and at the end of a trend, weaker in a strong trend |
| Hidden bearish divergence | Lower high | Higher high | The downtrend continues | Higher, because it goes with the trend |
| Hidden bullish convergence | Higher low | Lower low | The uptrend continues | Higher, because it goes with the trend |
Trading With the MACD
As any other indicator, the MACD has several ways of using it. On the one hand, the indicator is based on the Moving Averages, so it can show the direction of the market trend, which allows for trading accordingly. On the other hand, this indicator is an oscillator that can produce quality signals in the sideways trend. In most recommendations the difference between the price chart and the indicator values is singled out as the major signal. According to Alexander Elder, this signal is the strongest one in technical analysis. However, there are other ways of trading with the MACD, like searching for reversal models or creating trend lines. These ways are rare, and so are their signals; when they do appear, they normally work well.
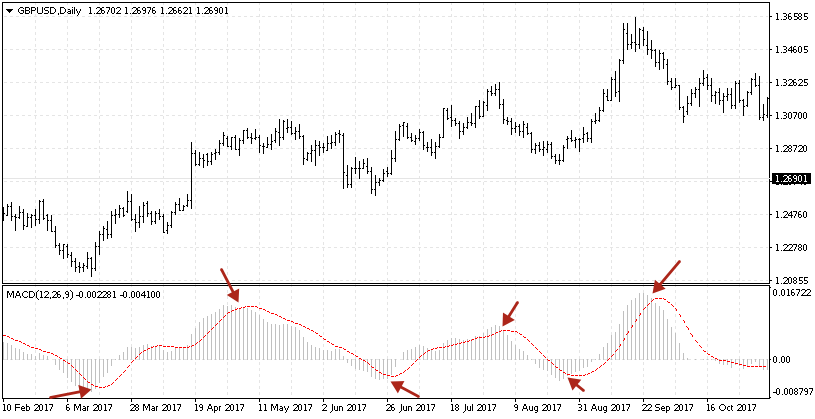
Crossing the Signal Line of the Histogram
Crossing of the two Averages is the moment when the histogram crosses the zero mark at the beginning of a new trend. If the difference between the two Averages enlarges alongside the values of the histogram, the current trend may be called strong. In this case the market should be entered at the moment when the signal line crosses the border of the histogram area. If the line escapes the histogram area above zero, it signals selling. If it escapes the area below zero, it signals buying.
Trading With Divergences
The divergence signal forms when the price takes a new minimum, but the indicator chart does not confirm this movement, and the minimum is not renewed. The MACD chart makes such divergences clearly visible, signaling the trader to buy. It is worth remembering that this signal works well during sideways movements. However, if the trend is really strong, the efficiency of such signals becomes significantly less.
There are several ways of trading with divergences: for example, many traders wait for the price to fall 30-50 points below the previous minimum and then buy hoping that the price will bounce back. The protective Stop Loss in such case is fixed around 30 to 50 points from the point of entering the market. The second way of trading with divergences consists of waiting for the signal line to escape the histogram area. Then the trader enters the market and exits it when the line returns inside the histogram area.
The Bollinger Bands and the MACD
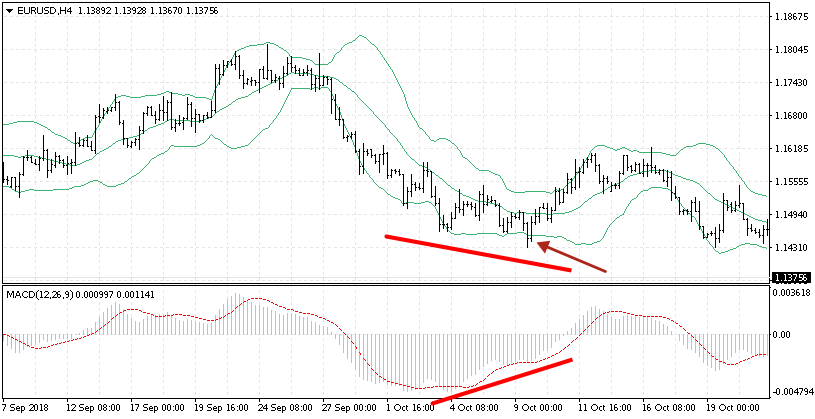
In order to use the divergences more efficiently, traders add the second indicator to the chart and receive additional signals. The Bollinger Bands indicator is one example of such supplementary instruments. The bands of the indicator demonstrate current borders of the maximum and minimum price; breaking through them is considered a strong fluctuation. If there forms a divergence at the same time as the price breaks through the border line, it is considered a strong signal for opening the position. Returning inside the borders, the price confirms that the impulse is over, and it is trying to move inside the divergences.
Divergence and Convergence Along the Trend
The most efficient way of trading according to divergences would be differentiating the signals that go in the direction of the trend and against it. The signal going in the direction of the trend is considered to be very strong and more likely to work well than the signal against the current trend. It is important to use the daily chart for figuring out the direction of the trend and H1 for finding divergences on the MACD.
On the daily chart traders usually add two Moving Averages with different periods in order to define the current trend more accurately. If the Average with a shorter period goes over the Average with a longer period, the trend is considered ascending. The trader is now to find divergences on the MACD H1. Conversely, if the Average with the shorter period goes below the one with the longer period, the trend is considered descending, and there are only convergences to be found on the MACD.
Trade With the MACD in MetaTrader 5
The MACD and dozens of other indicators, 21 timeframes and a Strategy Tester to check your settings on history.
Head and Shoulders on the MACD
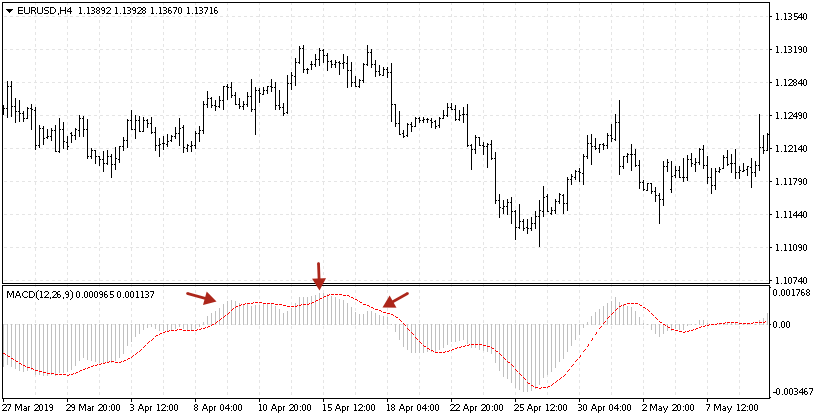
Looking for graphic models on the chart is quite uncommon among traders; however, this approach is rather efficient. Of all the models, only the Head and Shoulders one is worth searching for. What is more, the price chart itself may show no signs of a reversal, while on the MACD histogram a clear reversal model appears. The best moment for entering the market would be the right shoulder, same as when trading the classic way with a normal price chart. The point where the signal line escapes the histogram area may be another entrance point. To exit, one should wait for the signal line to enter the histogram area.
Creating a Trend Line
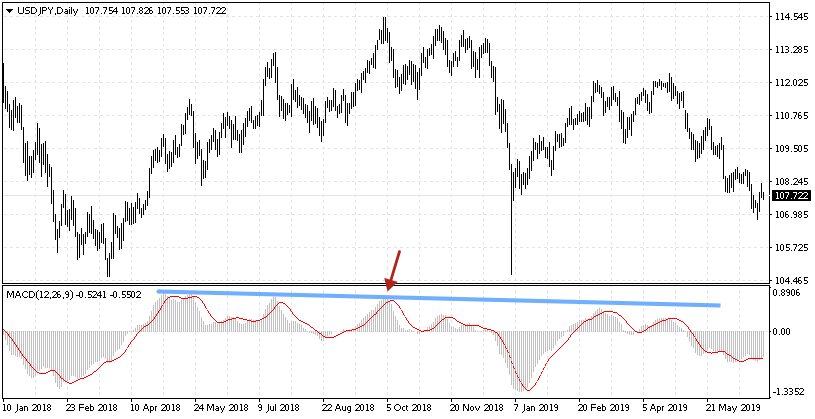
Another uncommon way of using the indicator is creating trend lines. This way is meant for experienced traders who have at least come across chart analysis. For creating trend lines daily charts and H4 suit best. If we work on smaller periods, there will be much more signals, that is why only the signals in the direction of the current trend should be taken into account. Creating a descending trend line along the maximums of the histogram, the trader will potentially get a resistance area that the price chart itself most often does not show. The moment of testing of this area may be used as a signal for opening a selling position. The point in which the signal line exits the histogram area will be the opening point.
Summary
Regardless of this indicator having been created almost 40 years ago, it is still highly popular. It has, of course, its advantages and drawbacks, as other indicators do. Some might say that it is outdated and requires upgrading. Others prefer it as it has been created and exists nowadays. This question is for each trader to answer independently. MACD settings are so flexible that they can be adapted for any instrument or timeframe.
Of course, signals should not be expected to turn out 100% true; no indicators, no matter what patterns they work along, give 100% accurate predictions. However, the MACD together with other indicators and various setting combinations can be useful on Forex (see the forex assets available for trading) and on the commodity market as well. The Holy Grail of trading on the finance market has not been discovered yet, and even if it exists, it is kept in such secret that it is not going to be presented to the public for a long time.
FAQ
What does the MACD indicator show?
The direction and strength of the trend. The MACD line is the gap between the 12- and 26-period EMAs: above zero and rising means buyers are in control, below zero and falling means sellers are. The signal line and the histogram show when that momentum speeds up or fades.
What are the best MACD settings?
The standard 12, 26, 9 suits most timeframes and is what most traders watch. Faster settings such as 8, 17, 9 give more signals on intraday charts, and slower ones such as 19, 39, 9 filter out noise on weekly charts. Test any change on history first.
What is MACD divergence in simple terms?
A disagreement between the price and the indicator. If the price makes a new high and the MACD makes a lower high, the rise is losing strength and a turn down becomes more likely. The mirror case at a low warns of a turn up.
Does the MACD work in a sideways market?
Its divergence signals work well in sideways movements, as this article notes. Crossings of the signal line and the zero line, by contrast, give many false signals in a range, because the two averages keep crossing back and forth.
MACD or RSI: which is better?
They answer different questions. The MACD indicator is built on moving averages and shows the trend and its momentum; the RSI measures how overbought or oversold the price is within a range. Many traders use the MACD for the direction and the RSI for the timing of the entry.
Any information provided in articles on this website is based solely on the personal opinions of the authors. These articles should not be construed as trading recommendations or a call to action. The authors and RoboForex accept no responsibility for the results of any trades made on the basis of these recommendations and reviews. Past performance is not indicative of future results. Trading stocks and CFDs involves a high risk of capital loss.