AI Stock Picks for Two Weeks: GPT-6 Sol Spreads 10,000 USD Beyond Big Tech

These AI stock picks are the third round of an experiment we run in public. The AI model GPT-6 Sol builds a portfolio for a 10,000 USD demo account in StocksTrader with a horizon of 10 trading days, using leverage of up to 1:2 on stocks and ETFs and up to 1:50 on currencies and crypto. All six positions opened on 26 October after the US market open, and they close no later than 6 November. The result goes up on this page next to a US 500 position of about the same size.
Previous AI portfolio
The second AI portfolio, 12 to 23 October, closed with a loss of 136.43 USD. A US 500 position opened next to it lost 391.65 USD, so the AI finished 255.22 USD ahead of the index and kept most of the capital. The new portfolio depends less on the largest technology companies and spreads the money more evenly across sectors, with healthcare and steady consumer demand in the defensive part.
Horizon
10 trading days, 26 October to 6 November 2026
Deposit
10,000 USD on a demo account in StocksTrader
Built by
GPT-6 Sol: instruments, sizes, Take Profit and Stop Loss
Benchmark
The US 500, 1.3 lots, about the same size as the portfolio
AI Portfolio Status
| Stage | Status |
|---|---|
| Portfolio built | 26 October 2026, before the US market opens |
| Positions opened | 26 October 2026 after the US open, all six |
| Positions closed | No later than 6 November 2026, after the US open |
| Result | Published on this page when the portfolio closes |
Open a RoboForex Account
Trade stocks, ETFs, currencies and indices from one account.
How the AI Portfolio Experiment Works
The portfolio was built with GPT-6 Sol, and the AI does the whole selection. It assesses the market, picks the instruments, splits the budget, and calculates the position size, Take Profit and Stop Loss for every trade. Our part is technical: we check the quotes in StocksTrader, open the positions on the demo account and record the result.
The request sent to the AI, translated from the original:
Prompt
Build a portfolio for 26 October to 6 November for a 10,000 USD deposit in StocksTrader. Limit leverage to 1:2 on stocks and ETFs and to 1:50 on currencies and crypto. Select a core, a defensive, a currency and a tactical block. Reduce the dependence on any single industry. Calculate the volumes, entry prices, Take Profit and Stop Loss. Keep part of the funds as a reserve.
The portfolio follows six rules:
- Fixed horizon. Positions open on Monday 26 October after the US market opens. Everything still open is closed on Friday 6 November after the US open, whatever the result.
- Early exit on profit. If the total net profit of the AI portfolio reaches 500 USD before 6 November, all remaining positions are closed at once.
- Early exit on loss. New in this cycle: if the total net loss reaches 350 USD, all remaining positions are closed as well. Both limits count closed trades, open positions, commissions, overnight fees and dividend adjustments. The US 500 position stays outside them.
- Levels follow the entry. Take Profit and Stop Loss are recalculated from the actual entry prices.
- No second attempt. A position closed at its Stop Loss is not reopened, and losing trades are not averaged down.
- Leverage. Up to 1:2 on stocks and ETFs, up to 1:50 on currencies and crypto.
Market Backdrop for the Next Two Weeks
- US stocks. The focus is on reports from Microsoft, Alphabet and Amazon. Investors will judge how far spending on AI turns into profit and cash flow. This portfolio relies on a wider group of companies and depends less on the technology giants. If their reports are strong and their shares recover quickly, the portfolio can trail the US 500.
- Fed rate and bonds. The Fed rate stands at 3.75% to 4.00%, and the yield on 10-year US government bonds was near 4.99% at the end of last week. The Fed decision on 28 October and the PCE inflation data on 29 October can move the market noticeably. A firm tone from the Fed can weigh on stocks, defensive sectors included. The US jobs report on 6 November comes out before the planned close.
- US dollar. EUR/USD was sold at 1.11817. The trade counts on a stronger dollar, which a firm Fed and lower demand for risk can support. The ECB decision on 29 October can lift the euro if the European regulator sounds firmer. The currency trade protects the portfolio only in part and can lose money at the same time as the stocks.
- Gold and oil. A small position in XLE keeps the bet that high oil prices support energy companies. The main risk is a drop in oil after news of easing geopolitical tension. ExxonMobil and Chevron report on 30 October, which also moves the fund. XAU/USD stays out of the portfolio: high bond yields limit its appeal, even with demand for safe assets.
- Crypto. BTC and other cryptocurrencies stay out. With central bank decisions, large company reports and the US elections on 3 November, extra volatility would make risk harder to manage. The free funds stay in reserve.
How the AI Split the Budget
How GPT-6 Sol split 9,891.44 USD of trades across four blocks
9,891 USD
6 trades
Core block
3,950.20 USD · 39.9% of the portfolio
- RSP2,608.08 USD
- JPM1,342.12 USD
The broad US market with equal weights, plus a large bank.
Currency block
2,236.34 USD · 22.6% of the portfolio
- EUR/USD, sell2,236.34 USD
Can make money if a firm Fed and lower demand for risk lift the dollar.
Defensive block
3,011.10 USD · 30.4% of the portfolio
- XLV1,804.30 USD
- WMT1,206.80 USD
Healthcare and everyday consumer spending, to lean less on technology.
Tactical block
693.80 USD · 7.0% of the portfolio
- XLE693.80 USD
A small bet that oil stays expensive.
Hover over a block, or tap it, to see what is inside.
- Core block: RSP and JPM. RSP holds the same large US companies as the US 500, each with an equal weight, so the biggest technology names move it less than they move the index. It is a bet that gains spread across a wide range of stocks. JPM adds the business of a large bank. The block comes to about 3,950 USD.
- Defensive block: XLV and WMT. XLV spreads its money across healthcare companies, and Walmart adds a business built on regular consumer purchases. The block takes about 3,011 USD.
- Currency block: sell EUR/USD. The trade sells 2,000 EUR at 1.11817, a position of about 2,236 USD. The size is smaller than in the previous portfolio.
- Tactical block: XLE. A small bet that oil stays expensive, about 694 USD. The size is limited because oil prices have already risen noticeably, and diplomatic news can trigger a pullback.
The rest of the deposit stays free as a reserve.
The portfolio counts on investors moving money from the largest technology companies into other sectors. RSP takes part in a broad rise, JPM adds the banking sector, XLV and WMT reduce the dependence on technology, XLE can gain from expensive oil, and the EUR/USD sell can gain from a stronger dollar. The main risks for this setup are a firm Fed, a fall in oil prices and sharp swings around the US elections. If the technology sector recovers quickly, the portfolio can trail the US 500.
AI Portfolio Positions
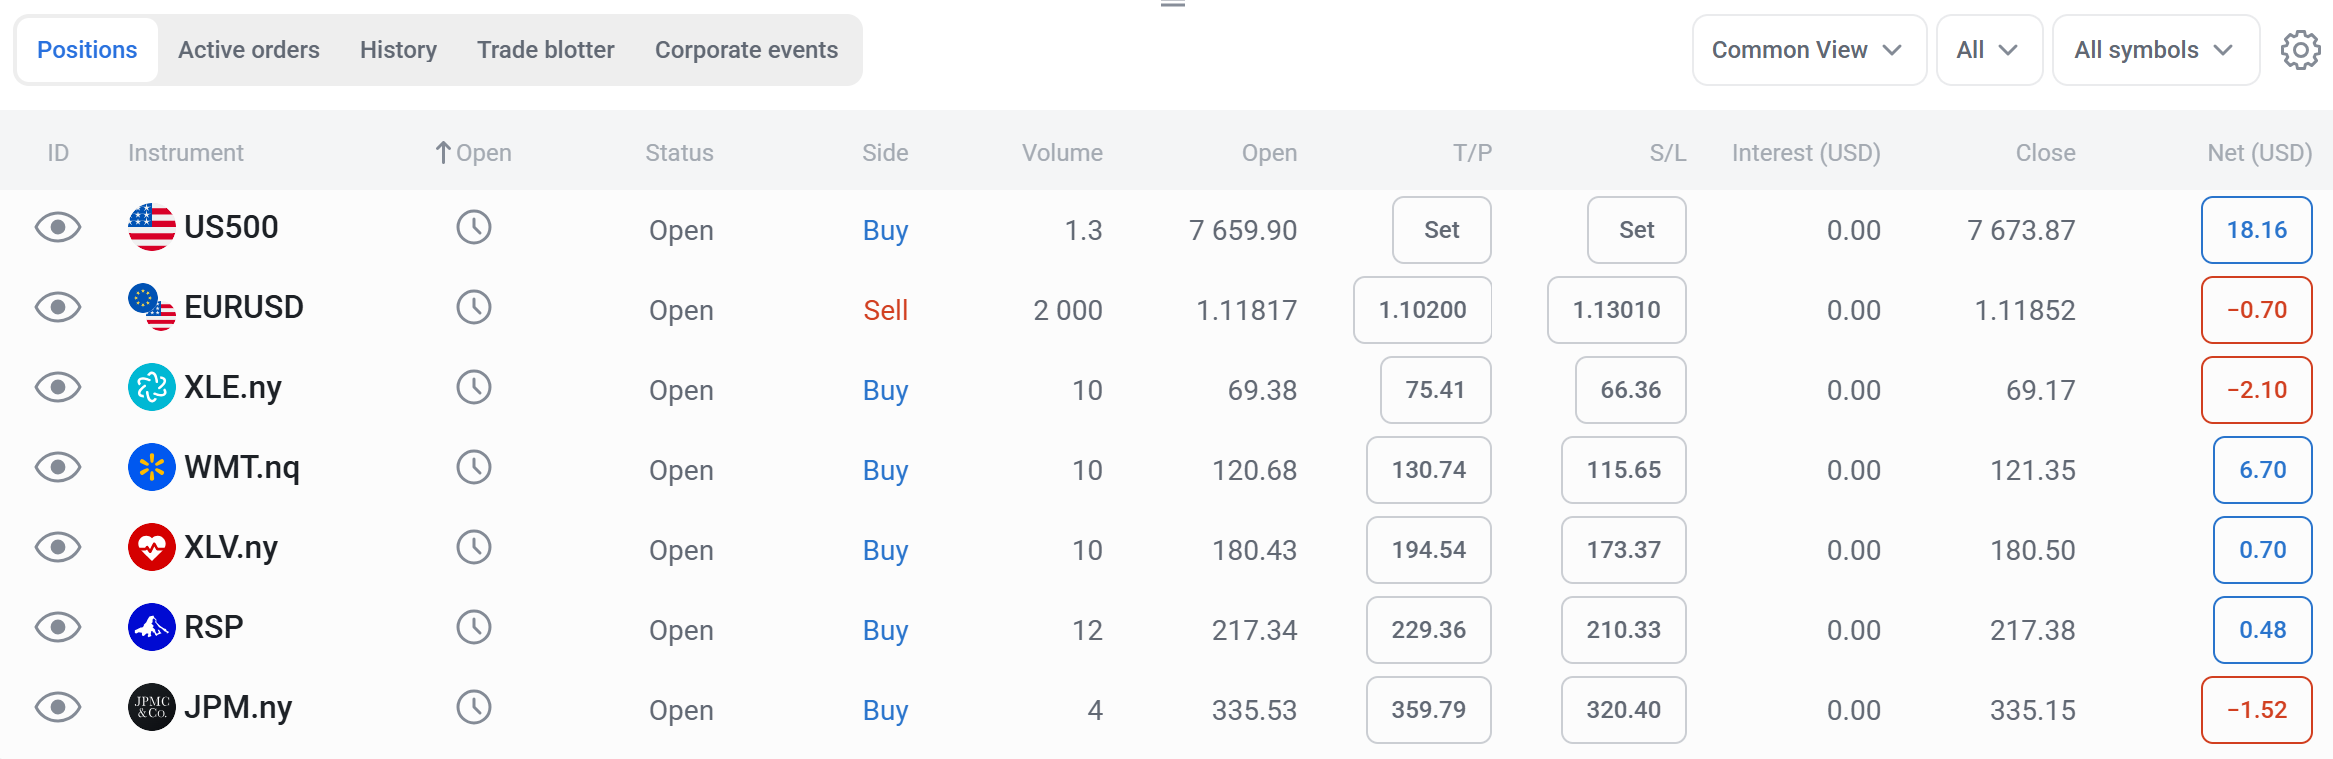
Entry prices below are the actual prices on the demo account. Take Profit and Stop Loss are the levels the AI set from these entries, with their distance in percent. Charts for every stock and fund are on the RoboForex stock charts page, and the currency pair is on the EURUSD live chart.
| Instrument | Trade | Entry | Take Profit | Stop Loss | Volume | Size, USD | Why |
|---|---|---|---|---|---|---|---|
| RSP | ↑ Buy | 217.34 | 229.36 (+5.53%) | 210.33 (-3.23%) | 12 shares | 2,608.08 | The broad market with less weight on the technology giants |
| JPM | ↑ Buy | 335.53 | 359.79 (+7.23%) | 320.40 (-4.51%) | 4 shares | 1,342.12 | The bank's business after its quarterly report |
| XLV | ↑ Buy | 180.43 | 194.54 (+7.82%) | 173.37 (-3.91%) | 10 shares | 1,804.30 | Money spread across healthcare companies |
| WMT | ↑ Buy | 120.68 | 130.74 (+8.34%) | 115.65 (-4.17%) | 10 shares | 1,206.80 | Regular consumer demand and growing online sales |
| XLE | ↑ Buy | 69.38 | 75.41 (+8.69%) | 66.36 (-4.35%) | 10 shares | 693.80 | Expensive oil supports energy companies |
| EUR/USD | ↓ Sell | 1.11817 | 1.10200 (-1.45%) | 1.13010 (+1.07%) | 2,000 EUR | 2,236.34 | A small bet on a stronger dollar |
Build Your Own Portfolio in StocksTrader
Stocks, ETFs and currencies from this portfolio, all on one platform.
Portfolio Targets and Stop Levels
The total size of the six trades is 9,891.44 USD. Stocks and ETFs account for about 7,655 USD of it, well within the 20,000 USD the account can hold at the maximum leverage of 1:2.
If all six Take Profit levels are reached and the portfolio is not closed early, the profit comes to about 576 USD, or 5.8% of the deposit, before trading costs. In practice the early exit at 500 USD would close the portfolio first. If all six Stop Loss levels are hit exactly at their prices, the loss comes to about 320 USD, or 3.2%. After company reports and major news the price can jump past a stop, so the actual loss can be larger.
Closing rule
If the total net result of the AI portfolio reaches a profit of 500 USD or a loss of 350 USD before 6 November, all remaining positions are closed. Otherwise they are closed on Friday 6 November after the US market opens, whatever the result. The limits count costs and open positions, and the final figure can differ from the limit because of price moves and slippage.
Six dates shape the cycle. Most of the risk sits in the first week, when the Fed, the ECB and the largest US companies all speak within three days. Every release is on the economic calendar.
AI portfolio cycle 3: from the first order to the result
- 26 OctoberNowPortfolio openedAll six positions after the US open, together with the US 500 benchmark.
- 28 OctoberFed, Microsoft, AlphabetThe Fed rate decision and two of the largest technology reports.
- 29 OctoberGDP, PCE, ECB, AmazonFirst estimate of US growth in Q3, PCE inflation, the ECB decision and the Amazon report.
- 30 OctoberExxonMobil and ChevronTwo energy reports that matter for the XLE position.
- 3 NovemberUS midterm electionsA source of sharp swings across stocks and the dollar.
- 6 NovemberJobs report and closeUS jobs data comes out before the open, then all remaining positions close and the result goes up here.
Three Trades With the Best Target-to-Stop Ratio
The ratio compares the distance to the target with the distance to the stop. Three trades share the lead at about 2 to 1:
- XLV, about 2 to 1. The target is 14.11 USD per share away and the stop 7.06 USD. For ten shares that is about 141 USD of potential profit against about 71 USD of risk. The trade counts on interest in healthcare holding up while investors stay cautious on technology.
- WMT, about 2 to 1. The target is 10.06 USD per share away and the stop 5.03 USD. For ten shares that is about 101 USD of potential profit against about 50 USD of risk. Regular consumer demand and growing online sales support the idea.
- XLE, about 2 to 1. The target is 6.03 USD per share away and the stop 3.02 USD. For ten shares that is about 60 USD of potential profit against about 30 USD of risk. The ExxonMobil and Chevron reports on 30 October are the first test for the fund.
AI Portfolio vs the US 500
To check how well the AI built the portfolio, we compare it with a simple alternative: about the same total size in the US 500, 1.3 lots bought at 7,659.90 at the same moment as the portfolio. That is about 9,958 USD against 9,891 USD in the AI portfolio's trades. The US 500 position closes together with the portfolio. If the AI portfolio closes early at one of its limits, the US 500 result is taken at the same moment, when both are open for trading.
Dividends count on both sides: dividend adjustments on the US 500 and any dividends on the stocks and funds in the portfolio.
AI Portfolio Result After 10 Trading Days
The result is published on this page when the portfolio closes, on 6 November 2026 or earlier if the closing rule is triggered, together with a screenshot of the account history and the outcome of every position.
AI portfolio vs the US 500, 26 October to 6 November 2026
AI portfolio
Published on 6 November
US 500, 1.3 lots
Published on 6 November
The difference between the two, in percentage points, goes here when the portfolio closes.
What This AI Portfolio Tests
The third AI portfolio is the widest so far. It holds the broad US market through an equal-weight fund, adds a bank, healthcare, a large retailer and a small energy position, and sells EUR/USD on the dollar. For the first time it also has a loss limit. The main tests come in the first week: the Fed, the ECB, PCE inflation and the reports of Microsoft, Alphabet and Amazon.
On 6 November this page will show whether a portfolio spread across sectors keeps the AI ahead of the US 500, and the running score after three rounds.
FAQ
What is the AI portfolio experiment?
The AI model GPT-6 Sol builds a portfolio for a 10,000 USD demo account in StocksTrader with a horizon of 10 trading days. The AI chooses the instruments, the position sizes and the Take Profit and Stop Loss levels. We open the positions, close them on schedule and publish the result next to a US 500 position of about the same size.
How did the previous AI portfolio do?
The second AI portfolio, 12 to 23 October 2026, closed with a loss of 136.43 USD. A US 500 position opened next to it lost 391.65 USD, so the AI finished 255.22 USD ahead of the index.
What did the AI put in this portfolio?
Six positions in four blocks. RSP and JPM form the core, XLV and WMT are defensive, a sell of EUR/USD is the currency block, and a small XLE position is the tactical block. Part of the deposit stays free as a reserve.
How much can the AI portfolio gain or lose?
All six Take Profit levels would bring about 576 USD, or 5.8% of the deposit, before costs, though the early exit at 500 USD would close the portfolio first. All six Stop Loss levels would cost about 320 USD, or 3.2%, and a price jump after a report can make the loss larger. The portfolio also closes early at a total net loss of 350 USD.
When will the results be published?
On 6 November 2026, after the positions are closed at the US market open. If the portfolio reaches a total net profit of 500 USD or a loss of 350 USD earlier, it closes early and the result is published then.
Any forecasts contained herein are based on the author's independent analysis and reflect their personal opinion. These articles should not be construed as trading recommendations or a call to action. The authors and RoboForex accept no responsibility for the results of any trades made on the basis of these recommendations and reviews. Past performance is not indicative of future results. Trading stocks and CFDs involves a high risk of capital loss.