Why Is Bitcoin Down Before the Fed Minutes: Market Week Ahead (November 16 – 20)

Why is bitcoin down? BTC/USD has lost about 25% since its September high of 87,388 USD and closed the week near 65,500 USD. Demand for the dollar jumped and investors cut risk across markets after two Federal Reserve (Fed) policymakers voted for a rate hike in October. Higher rate expectations drain liquidity from speculative assets such as crypto.
The next test comes on Wednesday, November 18, when the Fed publishes the minutes of its October 27 to 28 meeting. They will show how much support a hike has inside the Federal Open Market Committee (FOMC).
Before the minutes, markets get Japan's GDP on Monday and US retail sales on Tuesday, and UK inflation comes out on Wednesday morning. Fed Chair Kevin Warsh speaks early in the week, and Japan's inflation and UK retail sales close it on Friday. This issue covers USD/JPY, US 500, GBP/USD, EUR/USD and BTC/USD.
Where the Market Stands Going Into the Week
Last week ended with a rush into the dollar and a sell-off in risk assets. EUR/USD fell to about 1.1020, GBP/USD to about 1.3210, and USD/JPY climbed to 159.70, close to the 160 mark. Bitcoin dropped to about 65,500 USD from near 75,800 USD a week earlier. US 500 trades well below its October highs, though it recovered to about 7,550 after a dip toward 7,350 and still holds its long-term rising trendline.
The Fed links all five setups. On October 27 to 28 it kept the federal funds rate at 3.75% to 4.00%, but the vote was 10 to 2, with two members in favour of a 25 basis point hike. The statement noted solid economic activity and inflation that remains elevated. That is why bitcoin is down along with the euro and the pound: investors are pricing a chance that the next move in rates is up. The minutes will show how widely that view is shared.
Several markets go into the week at extremes. The stochastic on EUR/USD, GBP/USD and BTC/USD is in deep oversold territory, while USD/JPY is overbought right under resistance. Data that confirms the Fed's concern about inflation would extend the dollar's run. Softer data or a calmer tone in the minutes could trigger sharp rebounds from these stretched levels. All five charts below are daily.
Key Events of the Week
| Date | Event | Instruments | Importance |
|---|---|---|---|
| Mon, Nov 16 | Japan GDP, preliminary (Q3) | USD/JPY | ●● Medium |
| Tue, Nov 17 | US retail sales (October) | US 500, US dollar | ●●● High |
| Wed, Nov 18 | UK consumer price index (October) | GBP/USD | ●●● High |
| Wed, Nov 18 | FOMC meeting minutes (October 27 to 28) | EUR/USD, BTC/USD | ●●● High |
| Fri, Nov 20 | Japan consumer price index (October) | USD/JPY | ●● Medium |
| Fri, Nov 20 | UK retail sales (October) | GBP/USD | ●● Medium |
Instant Access to Global Markets with RoboForex MobileTrader
16
Nov
GDP Q3, Quarter on Quarter, Forecast
0.1%
Previous
0.4%
CPI (October), Year on Year, Forecast, Friday
2.0%
Previous
2.1%
Why It Matters
Japan's economy is expected to have slowed sharply in the third quarter: growth of just 0.1% quarter on quarter after 0.4%, in line with the consensus. The figure tests how well the economy copes with tighter financial conditions, and it feeds the debate about the Bank of Japan's next steps. Friday adds a second reference point, when October inflation is expected to ease to 2.0% a year from 2.1%. Weak growth and slower inflation together would reduce the pressure on the Bank of Japan to raise rates further.
Market Reaction
USD/JPY: growth above 0.1% would back the case for a resilient economy and could lift the yen, while flat or negative growth would cut expectations of further tightening and push the pair above 160.00. Nikkei 225 and Japanese government bond yields: both react to any change in the rate outlook. If Friday's inflation also comes in below 2.0%, the pressure on the yen could grow.
USD/JPY Market Sentiment
USD/JPY is bullish but stretched. After weeks inside a 157 to 159 range, the pair broke higher and closed near 159.70, a few pips under resistance at 160.18, the level that capped the rally in August. The price rides the upper Bollinger Band. The MACD has turned up in positive territory, with the main line at 0.4427 above the signal line at 0.1991, so buyers have the initiative. The stochastic at 89.37 and 87.73 is deep in overbought territory, which makes the 160.00 to 160.20 zone the deciding point: a breakout or a pullback. The scenario is a hold above 160.18 and a move to 160.90. A strong GDP print and a return below 158.55 would cancel it and put 157.75 in play.
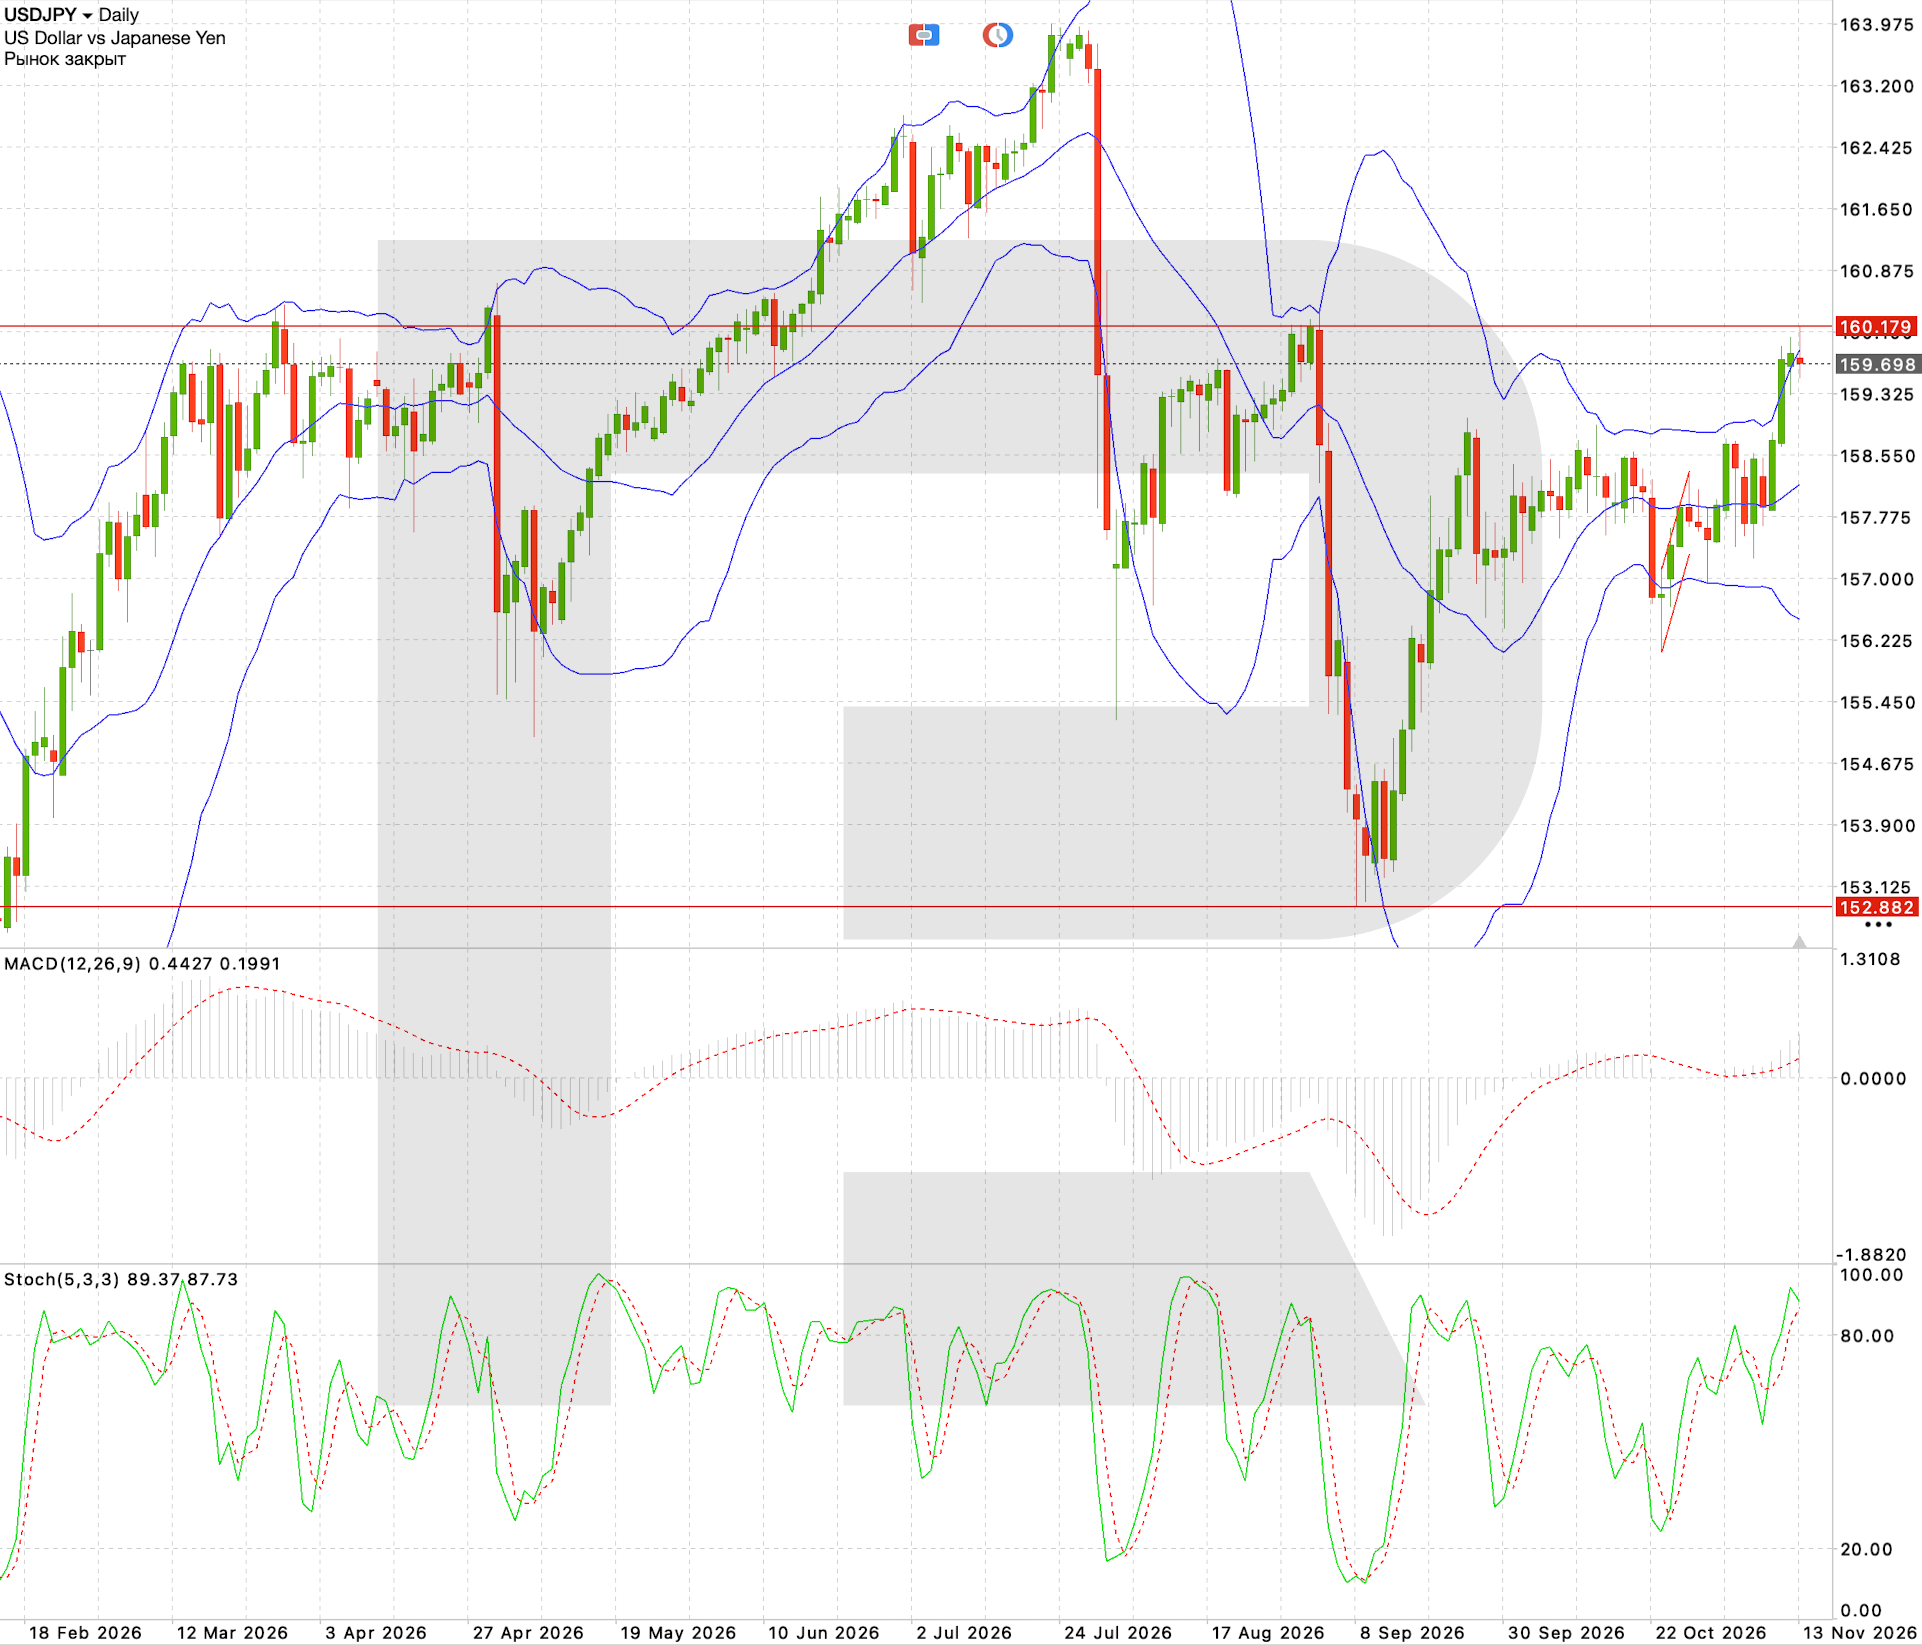
Key Levels — USD/JPY
| Level | Value |
|---|---|
| Resistance | 160.18 / 160.90 |
| Support | 158.55 / 157.75 |
| Target | 160.90 |
17
Nov
Retail Sales (October), Month on Month, Forecast
0.6%
Previous
0.8%
Why It Matters
Retail sales come out on Tuesday at 8:30 a.m. Eastern Time (13:30 GMT) and show whether US consumers kept spending after a strong 0.8% rise in September. The forecast calls for a slowdown to 0.6%, while the market consensus is far more cautious and sees no growth at all, 0.0%. That gap makes the release harder to read than usual. The timing matters too: the Fed already describes activity as solid and inflation as elevated. Steady consumer demand would keep price pressure alive and give more arguments to the members who want higher rates.
Market Reaction
US dollar and Treasury yields: sales near or above 0.6% would lift both. US 500: the same result would weigh on stocks through expectations of a tighter Fed. A weak reading near the zero consensus could cool rate expectations and help the index at first, but falling sales would also raise doubts about the health of the US consumer.
US 500 Market Sentiment
US 500 has recovered part of its losses. After a sharp correction from the October highs and a dip toward 7,350, buyers returned fast and the index climbed back to about 7,549, still above the long-term rising trendline that now passes near 7,330. The bounce started at the lower Bollinger Band, and the stochastic has climbed to 75.26 and 69.04, the fast line above the slow one. The MACD is the reason for caution: it is still below zero at -43.29, though it has just crossed above its signal line at -45.88. To confirm the reversal, the index needs to hold above 7,640, and the scenario then points to 7,750. Below 7,430, that scenario is off and 7,330 comes back into view. A break of that level would be a more serious signal against the medium-term uptrend.
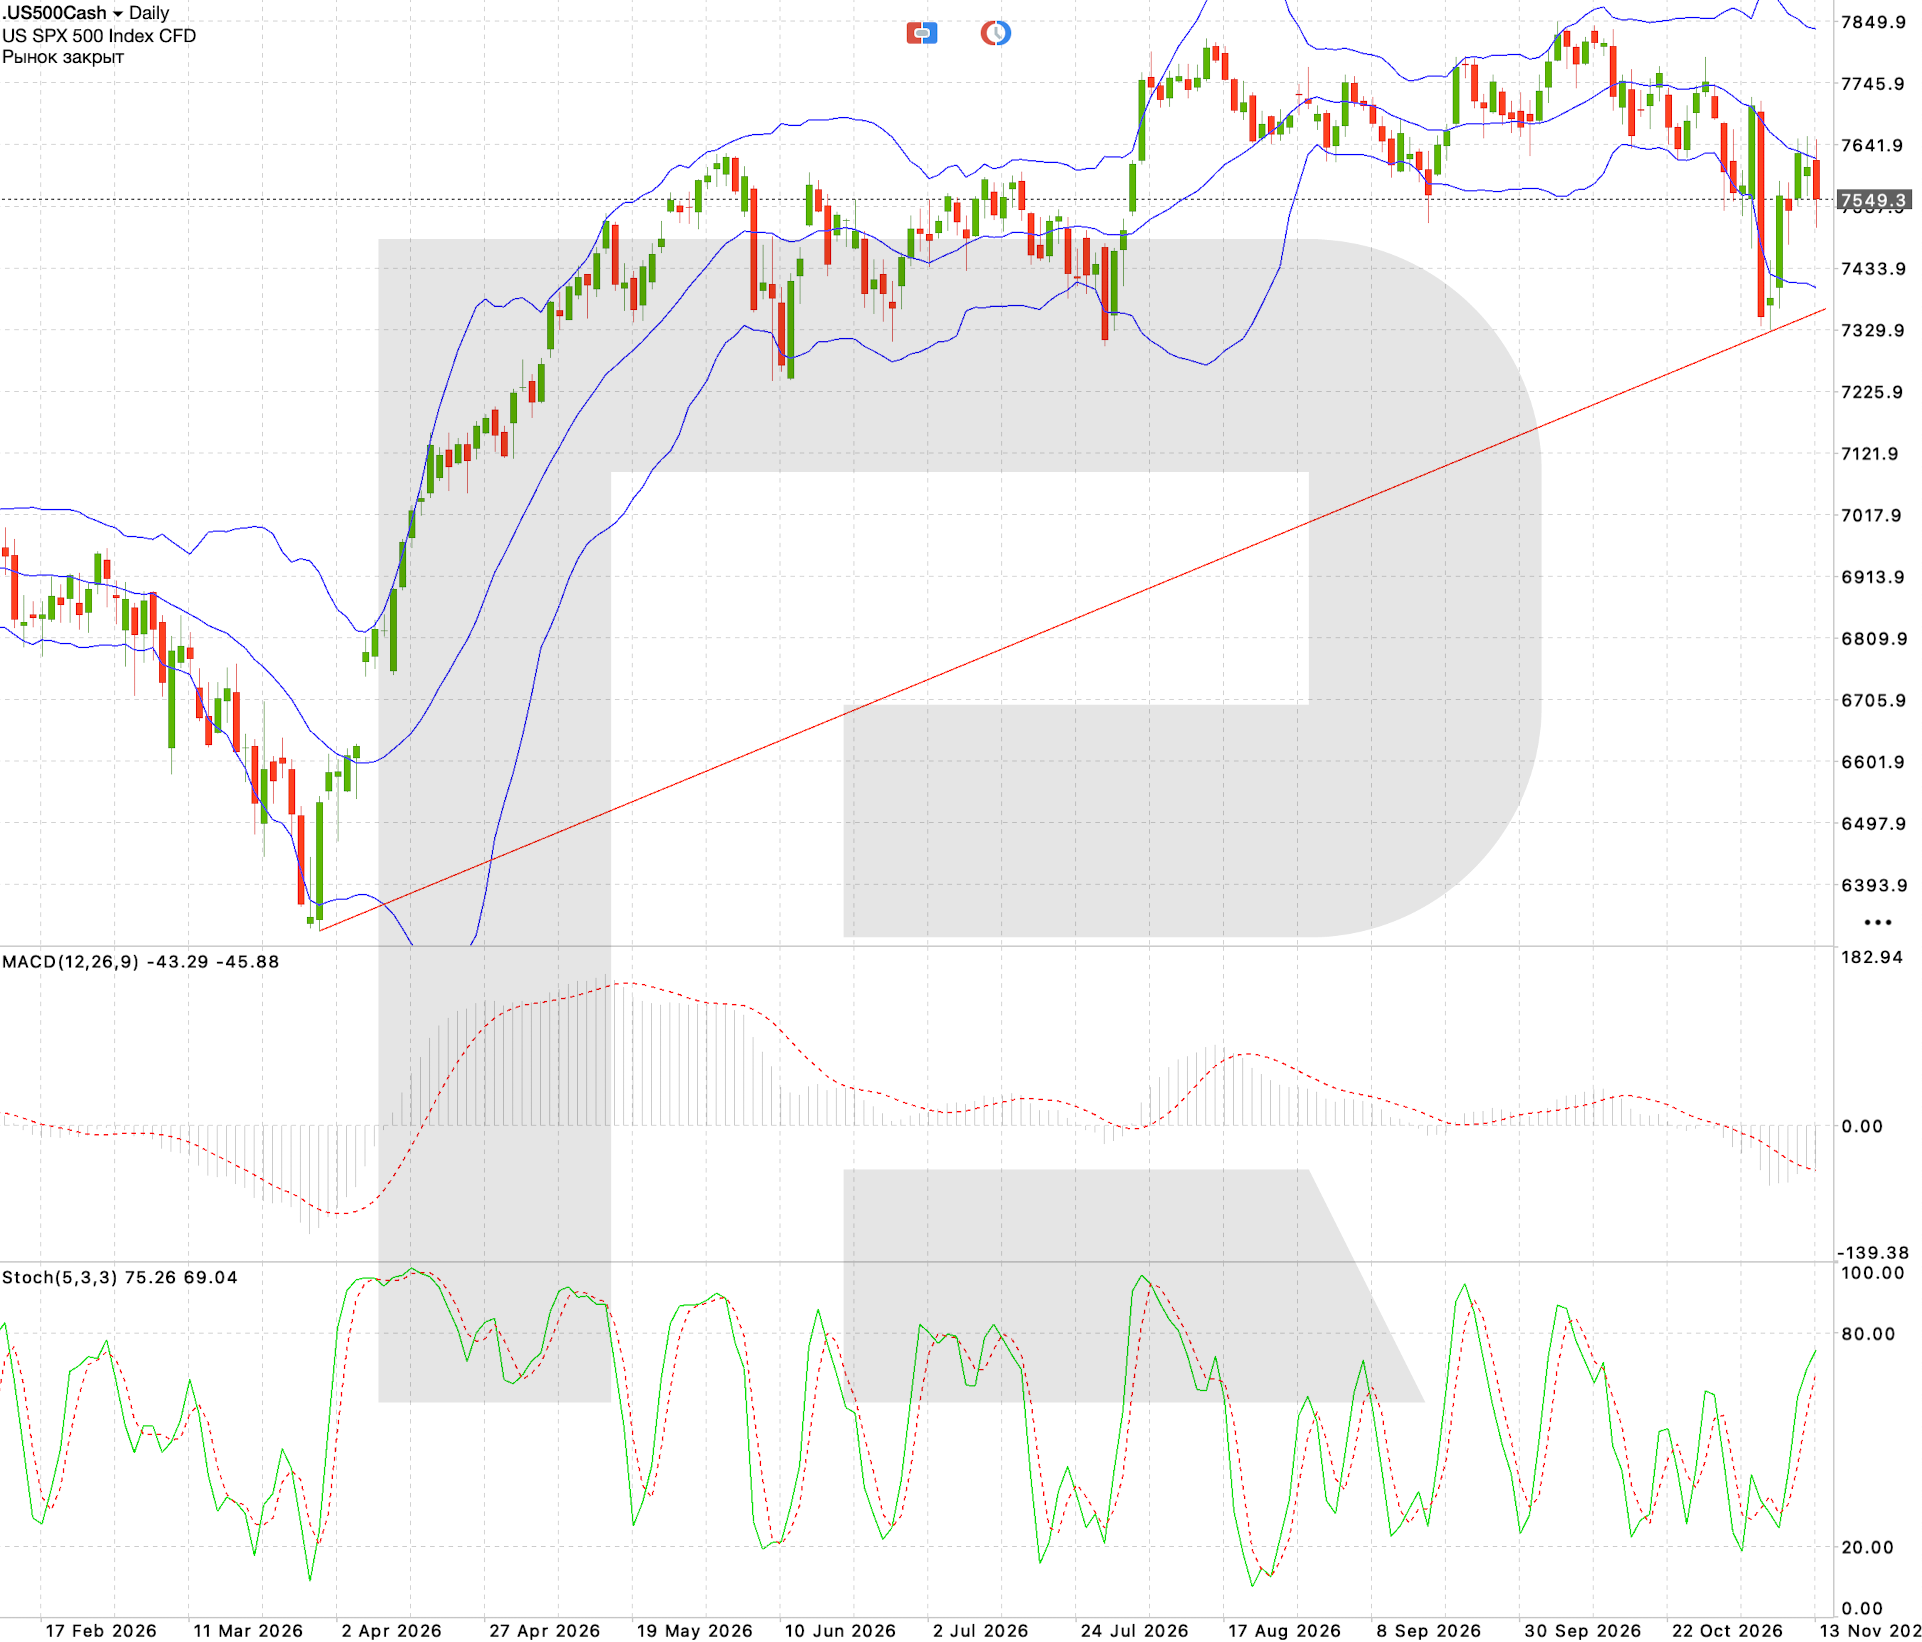
Key Levels — US 500
| Level | Value |
|---|---|
| Resistance | 7640 / 7750 |
| Support | 7430 / 7330 |
| Target | 7750 |
18
Nov
CPI (October), Year on Year, Forecast
3.5%
Previous
3.5%
Retail Sales (October), Month on Month, Forecast, Friday
0.1%
Previous
-0.4%
Why It Matters
Inflation is still the main constraint on the Bank of England. The forecast has October CPI unchanged at 3.5% a year, while the market consensus expects a small rise to 3.6%. A higher figure would strengthen the case for a cautious approach to rate cuts. On Friday, retail sales complete the picture: after a 0.4% drop in September, the forecast is a 0.1% rise in October and the consensus is no change. Within one week, the market gets a read on both price pressure and the British consumer. Read how CPI works and how it moves currency prices.
Market Reaction
GBP/USD: inflation above 3.5% to 3.6% would firm up expectations of tighter Bank of England policy and help the pound recover. A soft CPI followed by weak retail sales on Friday would give more arguments for easier policy and push the pair lower again. FTSE 100 and gilt yields: both move with the rate outlook.
GBP/USD Market Sentiment
GBP/USD is under heavy selling pressure. The pair turned down from the 1.3490 area at the end of October, a level that has stopped rallies several times this year, and slid to about 1.3211. It now moves along the lower Bollinger Band, with support at 1.3136 about 75 pips below. The stochastic has collapsed to 3.78 and 12.04, an extreme oversold reading that makes a local bounce more likely. The MACD still points down: the main line has dropped below zero to -0.001138 and sits under its signal line at 0.001556, so the downturn is still gaining pace. The scenario is a move to 1.3136, and a break there points to 1.3050. A return above 1.3270 cancels it, and above that the next resistance is 1.3350.
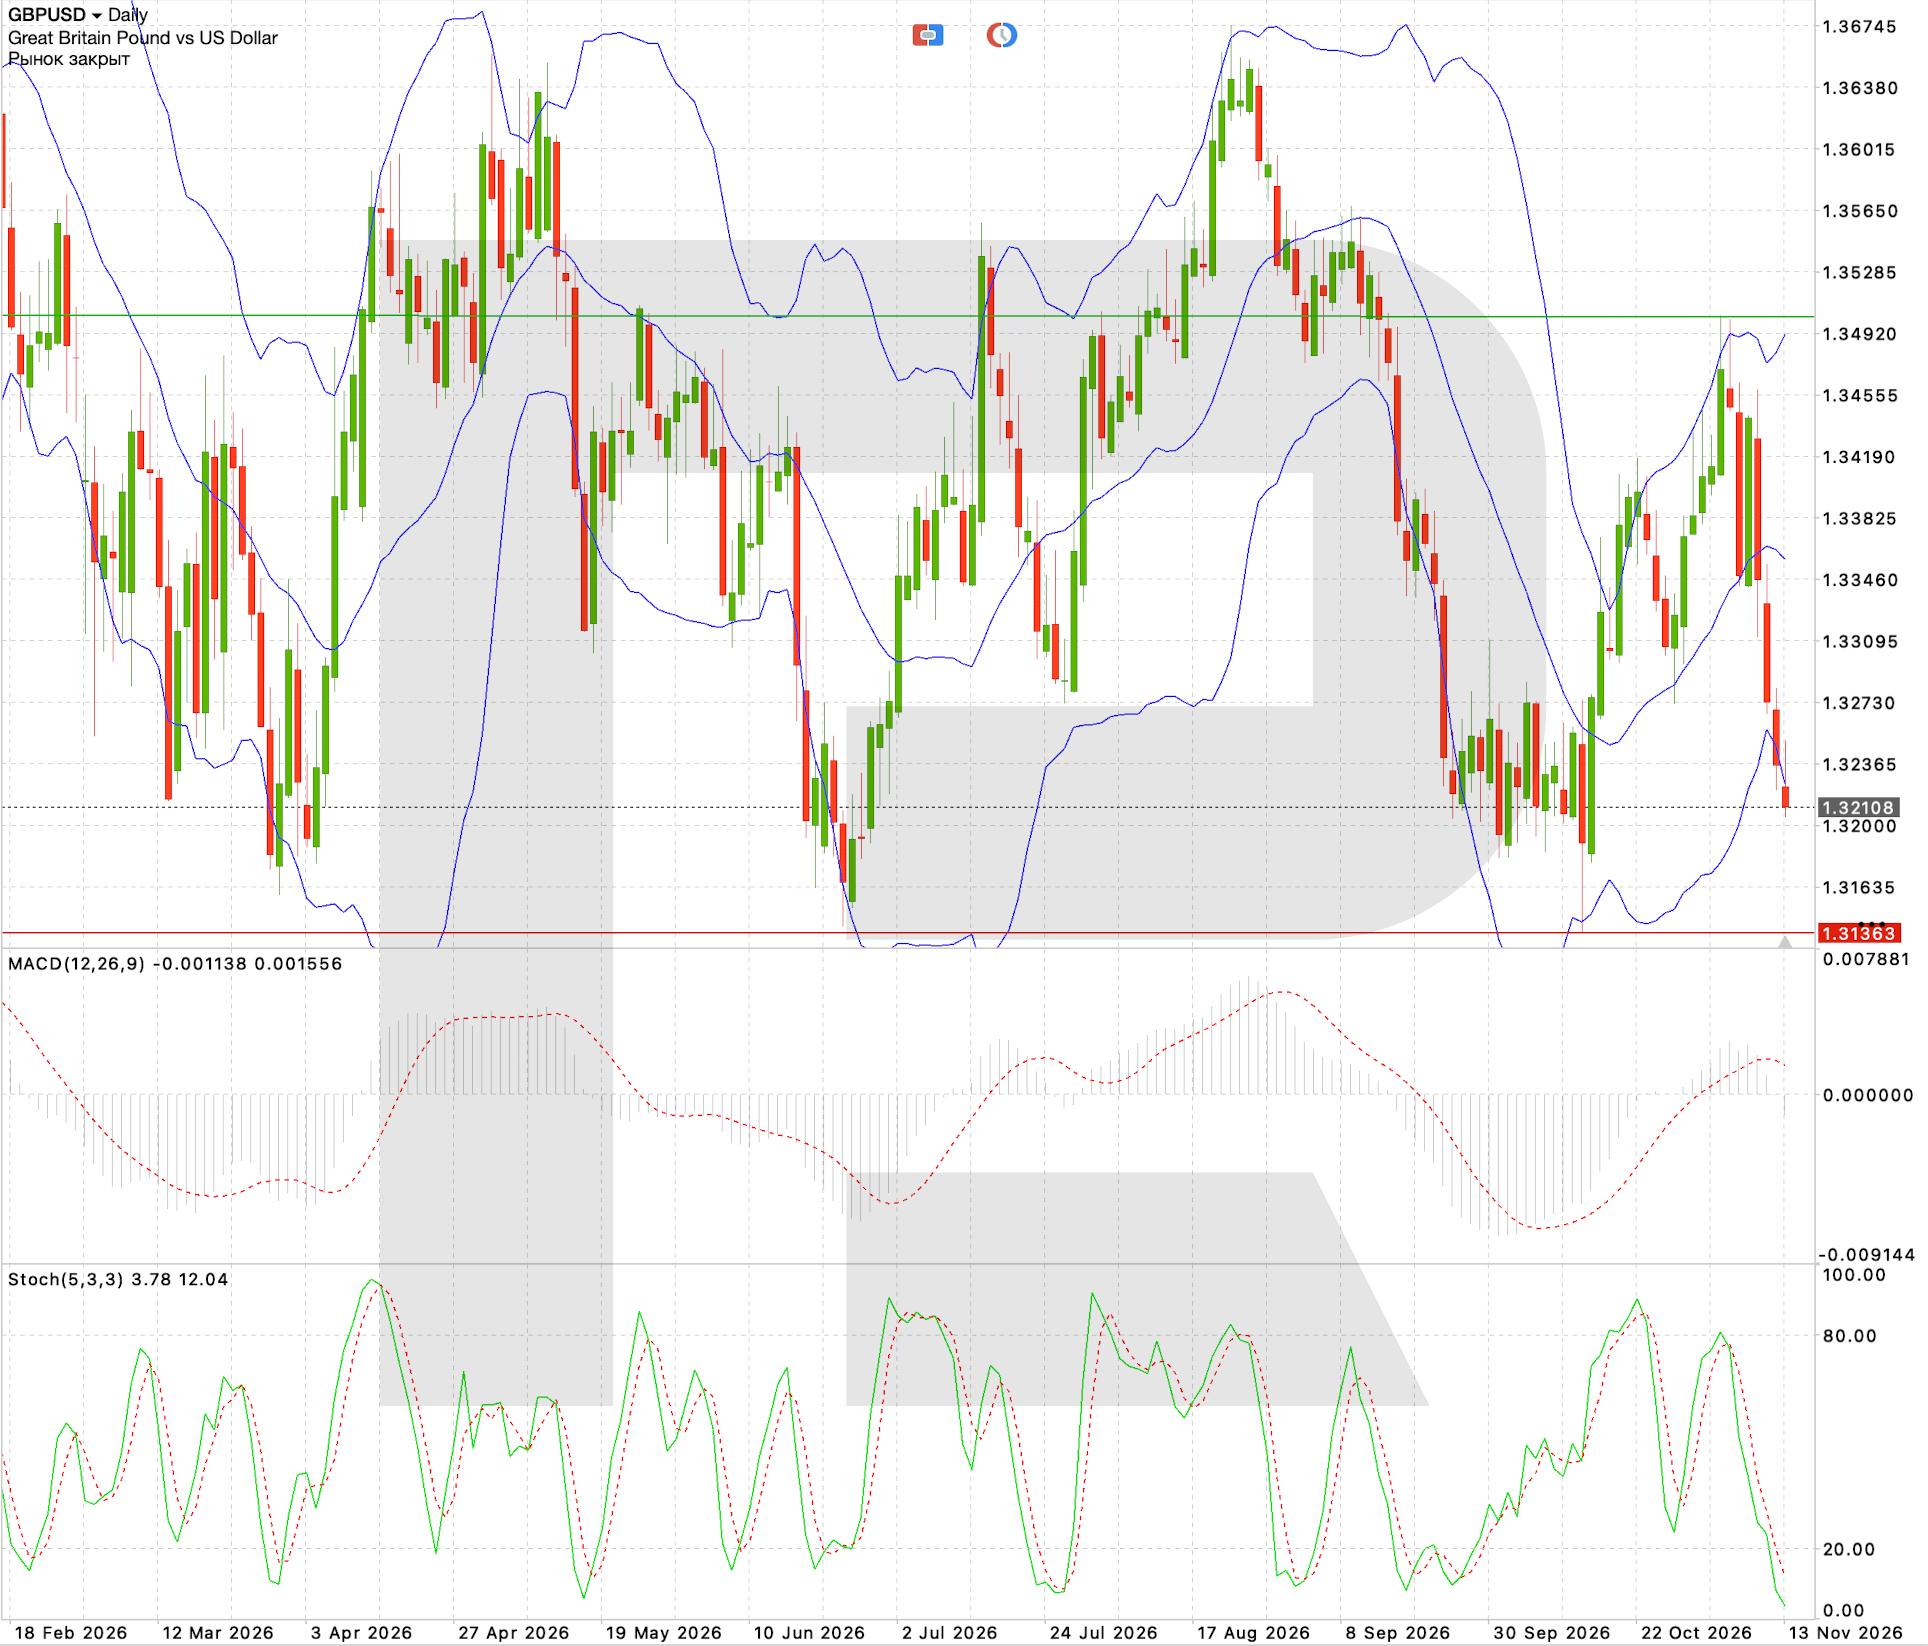
Key Levels — GBP/USD
| Level | Value |
|---|---|
| Resistance | 1.3270 / 1.3350 |
| Support | 1.3136 / 1.3050 |
| Target | 1.3136 |
18
Nov
Fed Funds Rate, Held on October 28
3.75% to 4.00%
Vote
10 to 2, two for a hike
Why It Matters
The minutes of the October 27 to 28 meeting, due on Wednesday at 2:00 p.m. Eastern Time (19:00 GMT), are the main event of the week for global markets. The Fed kept the rate at 3.75% to 4.00%, but two FOMC members voted for a 25 basis point hike. Investors will look for an answer to one question in the document: how far concern about sticky inflation, and support for more tightening, has spread inside the committee. By then, the market will already have the October retail sales. Strong spending combined with a firm tone in the minutes would point the committee toward keeping rates high. Signs that the majority of the FOMC stays cautious could ease the pressure on risk assets.
Market Reaction
US dollar and Treasury yields: minutes that stress inflation risks and keep a hike on the table would push both higher. EUR/USD and Bitcoin: the same outcome would extend their decline. A more balanced debate inside the FOMC would ease fears of a new hike and allow a corrective recovery in the euro, stock indices and crypto.
What a Surprise Means
Firmer minutes: several members open to a hike, focus on inflation
US dollar: stronger, with Treasury yields moving up.
EUR/USD: a break of 1.1019 and a move toward 1.0950.
BTC/USD: pressure stays on, with 61,800 USD as the next test.
Calmer minutes: the majority sees no need to tighten
Treasury yields: lower.
EUR/USD: room for a rebound toward 1.1120.
BTC/USD and US 500: support for a technical recovery.
EUR/USD Market Sentiment
EUR/USD is in one of its sharpest declines in months. The pair broke out of the September to October range below 1.1120 and dropped to about 1.1019, right on support. The candle bodies have pushed through the lower Bollinger Band. The MACD at -0.005284 is below its signal line at -0.004129 and well under zero, and the stochastic has fallen to 2.85 and 13.44, close to the floor of the scale. The market is extremely oversold, but no reversal has formed yet. A break of 1.1019 points to 1.0950. Sellers keep the advantage while the price stays below 1.1120; above it, 1.1272 is the next resistance.
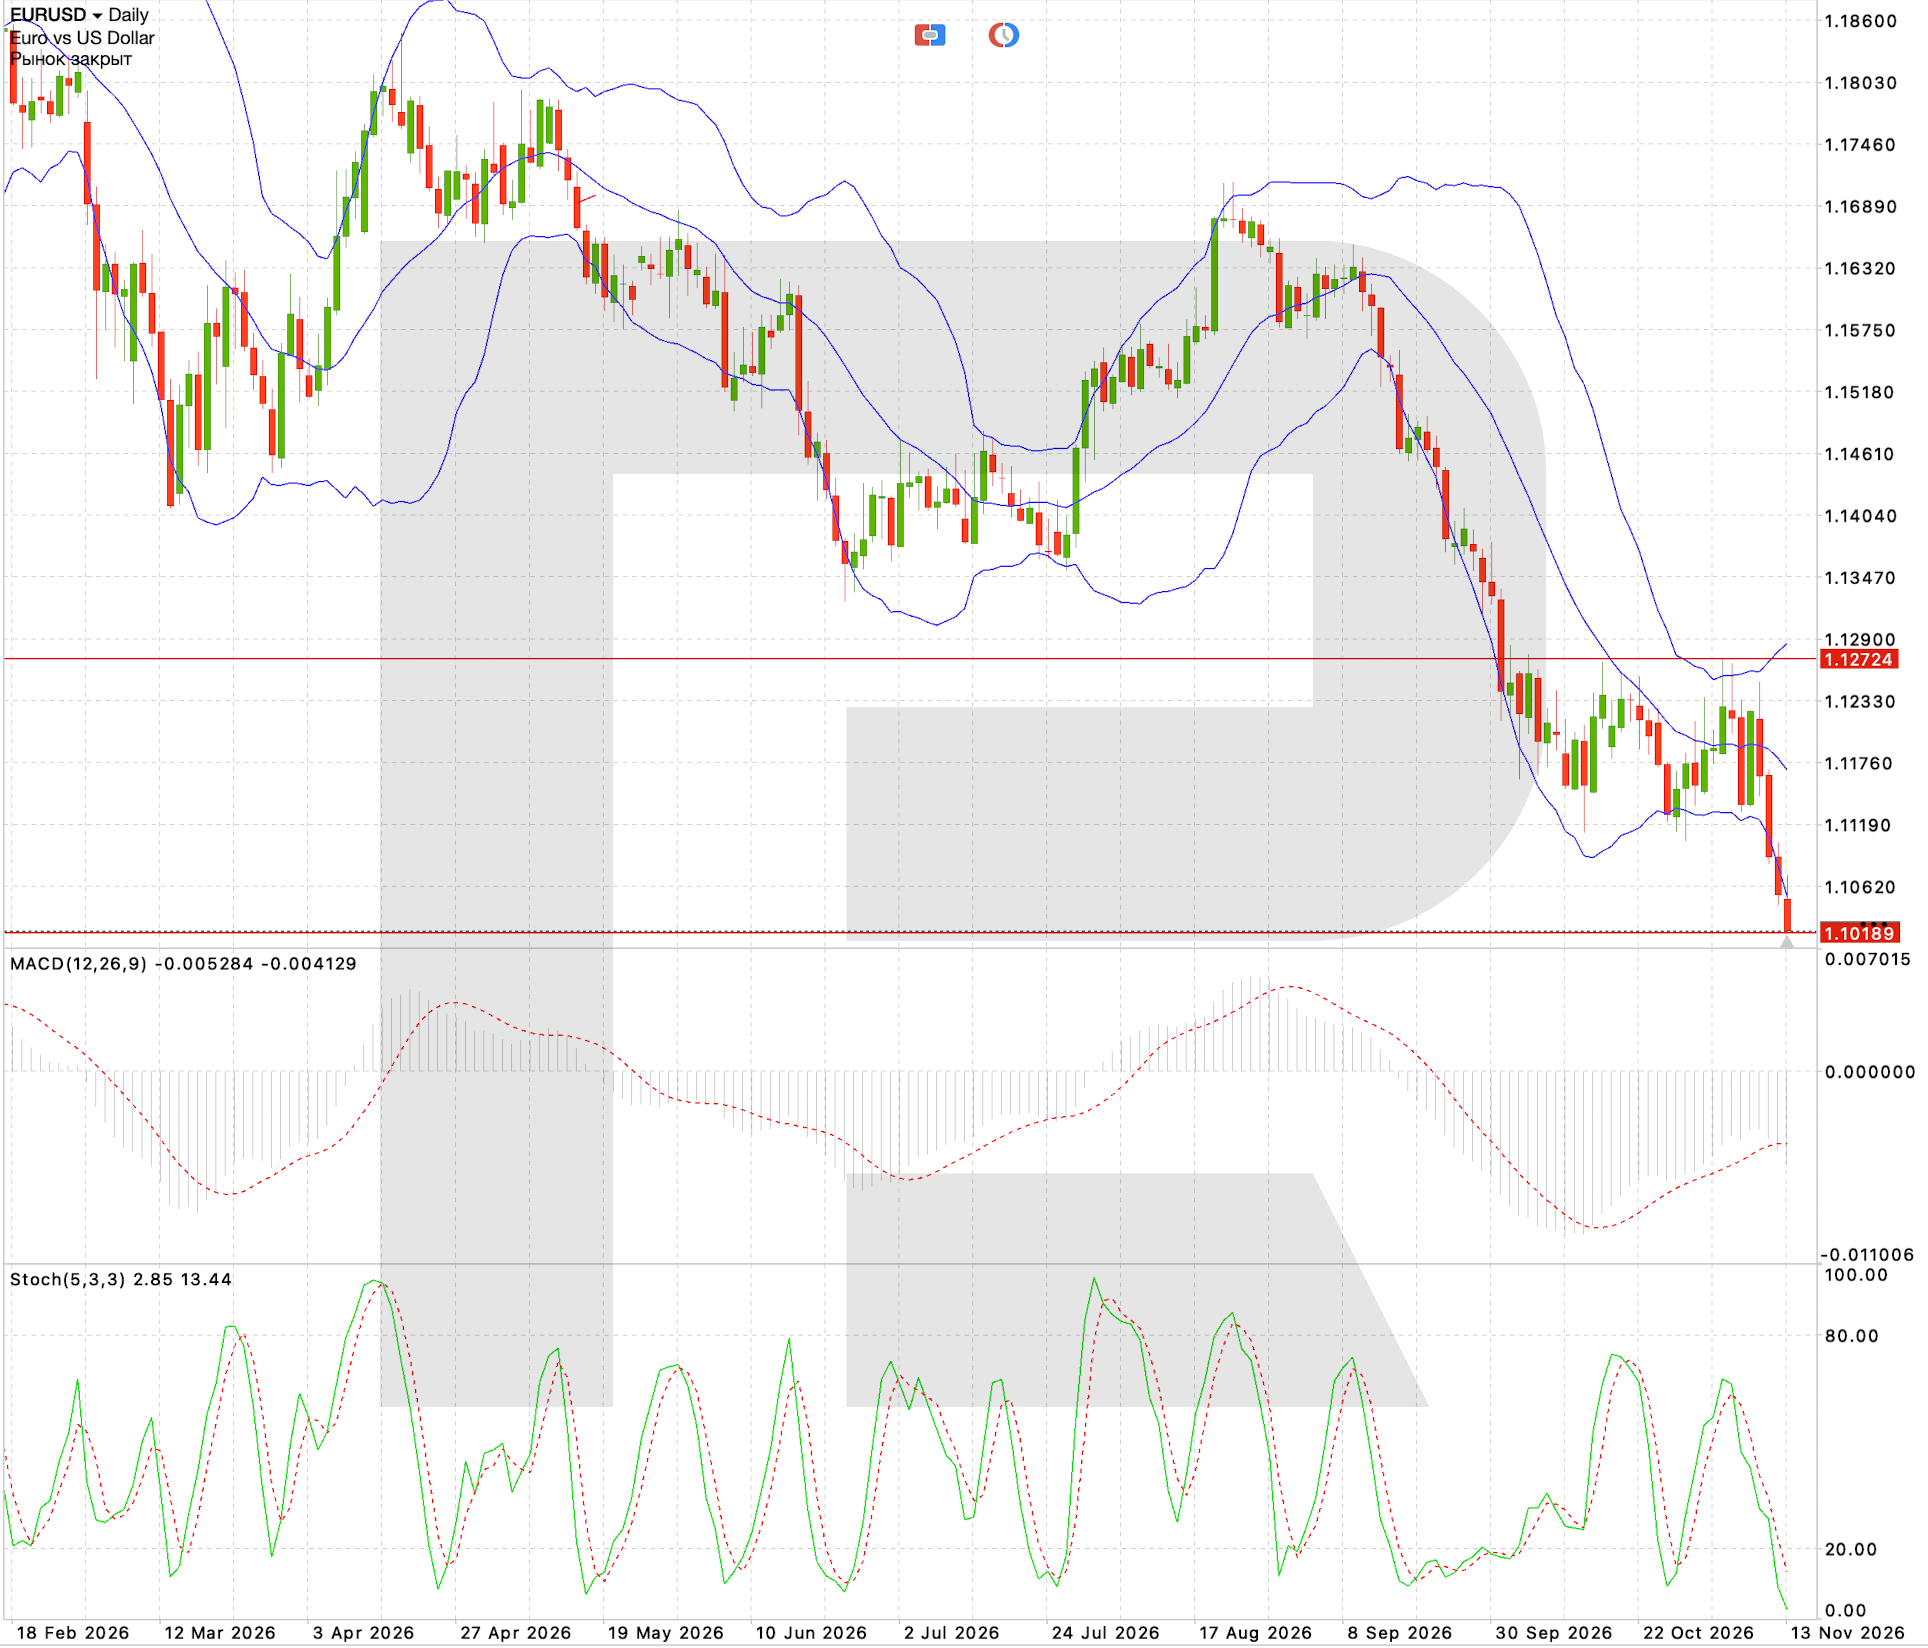
Key Levels — EUR/USD
| Level | Value |
|---|---|
| Resistance | 1.1120 / 1.1272 |
| Support | 1.1019 / 1.0950 |
| Target | 1.0950 |
18
Nov
BTC/USD, Last Close
65,474 USD
September High
87,388 USD
Why It Matters
Bitcoin is down by more than 20,000 USD since September because of a broad retreat from risk: the dollar is in demand, and two Fed members already voted for a hike in October. Last week alone, the price fell from near 75,800 USD to about 65,500 USD. Crypto reacts strongly to any change in rate expectations because higher rates drain liquidity from speculative assets. That makes the tone of the Fed minutes an important trigger for BTC/USD this week. A firm stance from the Fed would keep the pressure on, while easing concern about rates would make a technical rebound more likely.
Market Reaction
Firm minutes and higher yields would send the price back toward 61,800 USD, the support that stopped the decline in June. Calmer minutes and lower yields would give buyers a chance to take the price back to 69,300 USD, where the first resistance sits.
BTC/USD Market Sentiment
The daily BTC/USD chart is sharply bearish. The price broke through the lower Bollinger Band in a run of large red candles and dipped close to 61,800 USD, a level that held the market in June. The last candle closed higher, near 65,474 USD, so buyers defended the area on the first test. The MACD is still accelerating down, with the main line at -3,503.80 well below the signal line at -2,236.55. The stochastic is oversold at 15.49 and 13.26, and the fast line has just crossed above the slow one, the first hint of a pause in the sell-off. While BTC stays below 69,300 to 71,300 USD, the risk points to a retest of 61,800 USD. A hold above 69,300 USD cancels that scenario and opens room for a recovery toward 71,300 USD.
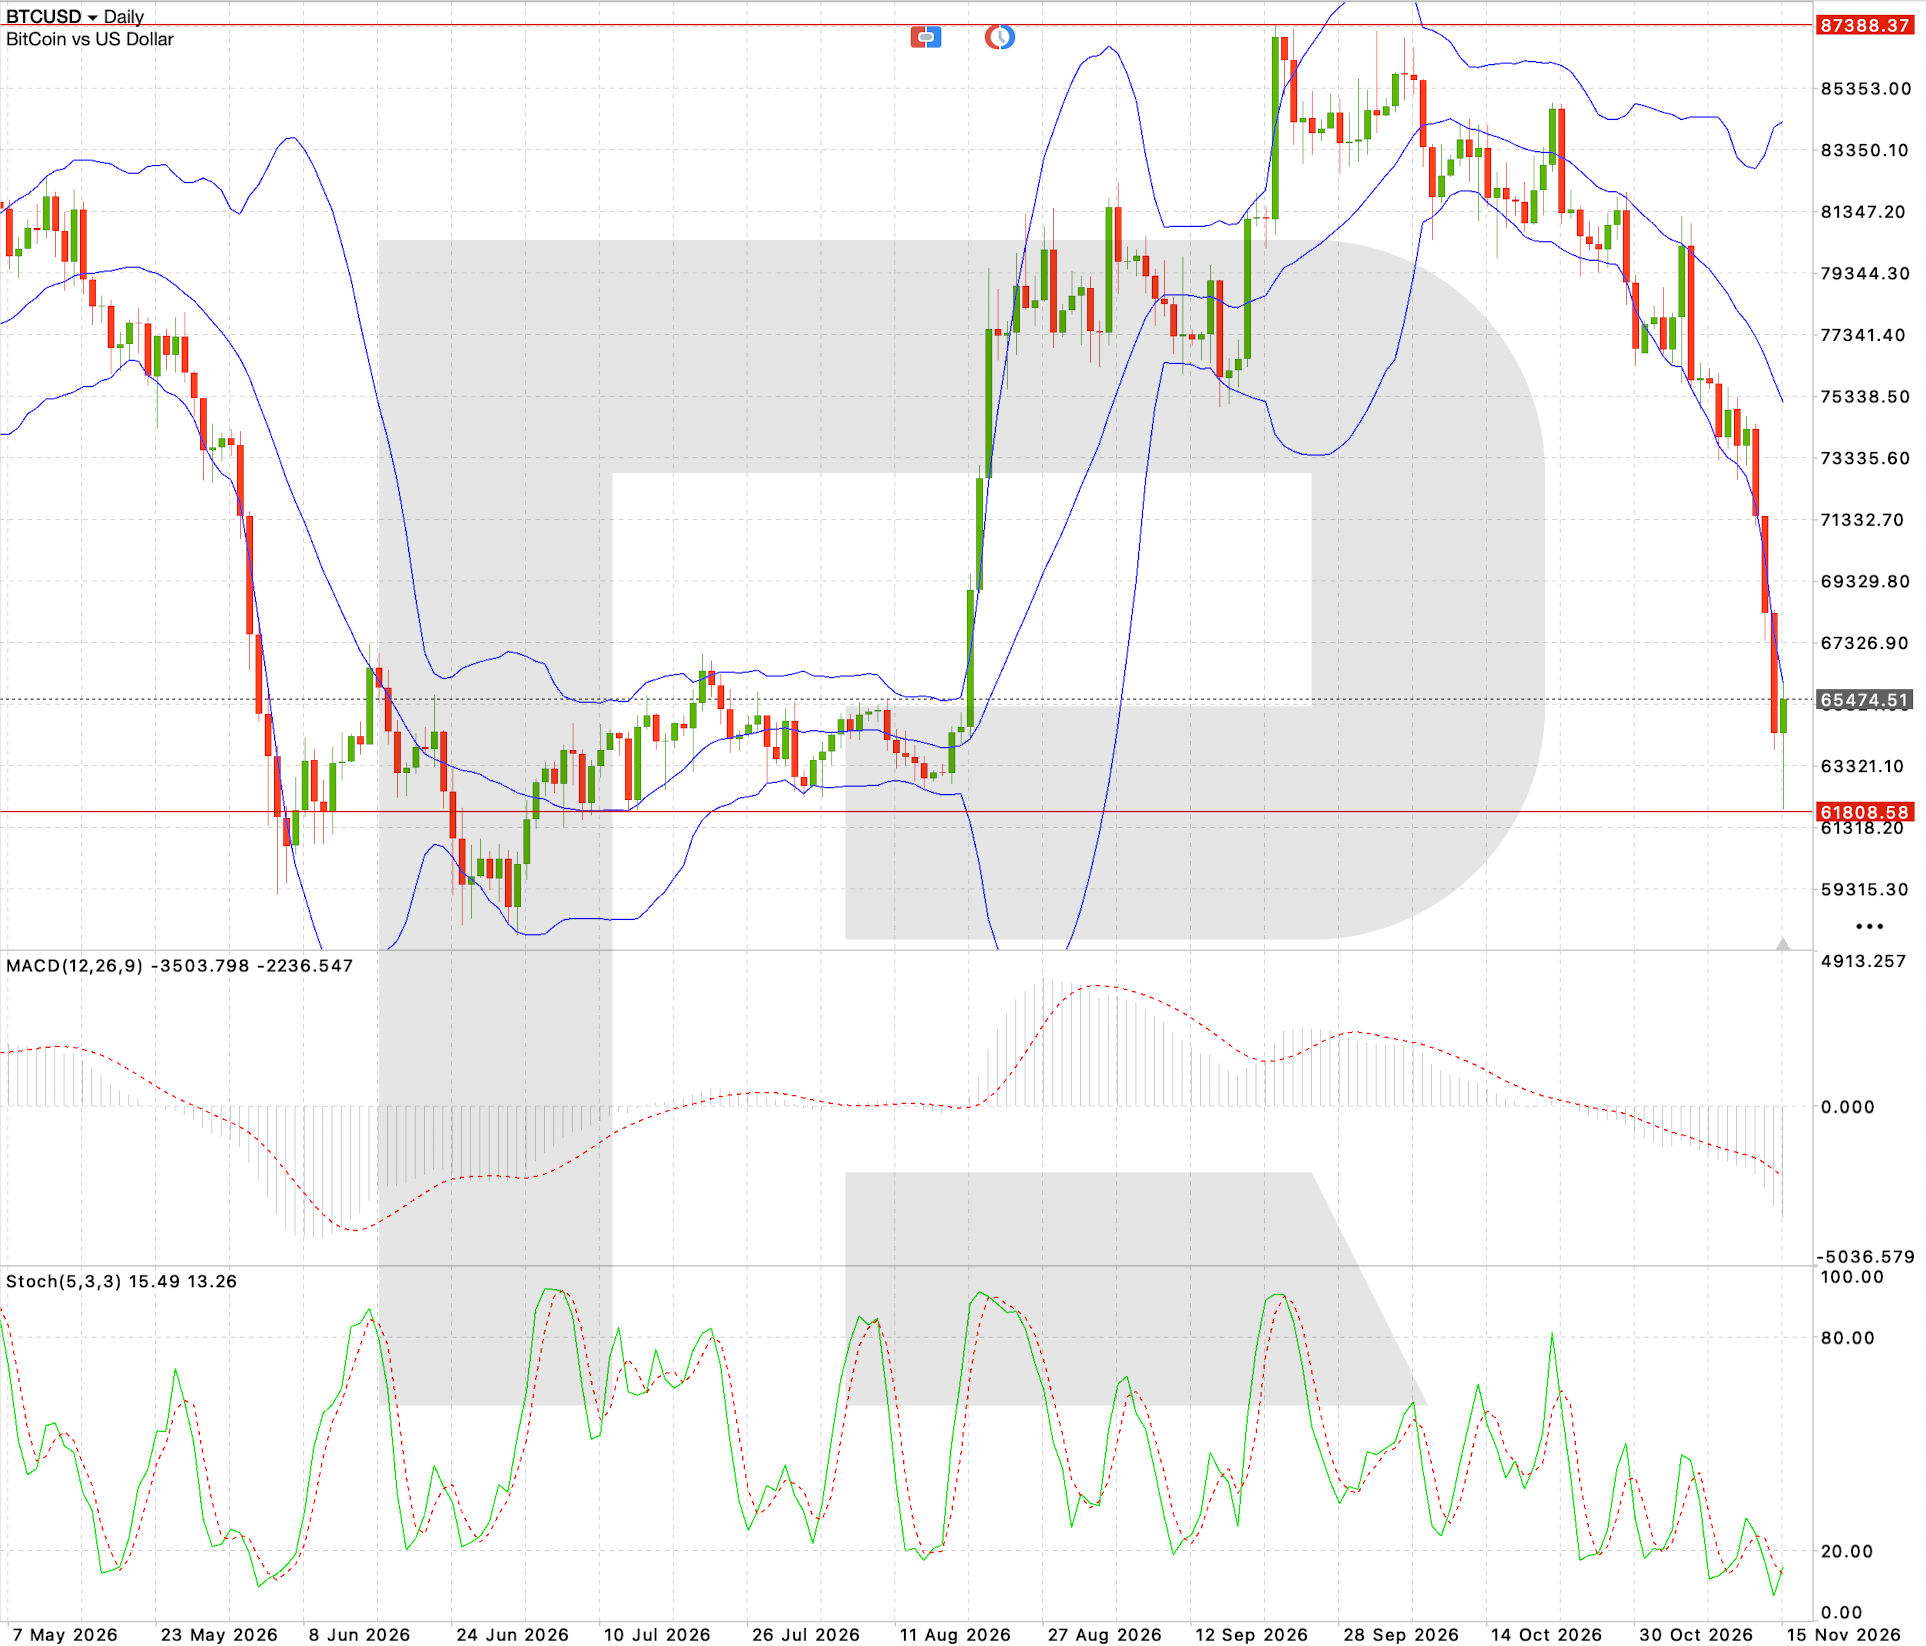
Key Levels — BTC/USD
| Level | Value (USD) |
|---|---|
| Resistance | 69,300 / 71,300 |
| Support | 63,300 / 61,800 |
| Target | 61,800 |
What Else to Watch
On Monday, China releases a large block of October data. Industrial production is expected to grow 5.3% a year after 5.5%, and retail sales 1.7% after 1.1%. The contrast between a slight slowdown in industry and a clearer recovery in spending matters for commodities and for currencies tied to the Chinese economy. Canada also publishes October inflation early in the week: CPI is expected to rise to 3.2% a year from 3.1%, which would narrow the Bank of Canada's room to ease and lift the Canadian dollar.
On Tuesday, the UK labour market report comes out alongside US retail sales. The forecast sees unemployment rising to 4.9% from 4.7%, while the consensus expects no change at 4.7%. In Germany, the ZEW economic sentiment index is expected at 27 points after 28.1. On Wednesday, Japan reports its October trade balance: the forecast is a deficit of 450 billion yen after 536.6 billion, while the consensus expects a much wider 956 billion. For the yen, the figure sits between Monday's GDP and Friday's inflation and shows how much the external sector adds to or takes from growth.
Track the forecast and the actual figure for each release, since the gap between consensus and the outcome is what tends to move prices the most. Learn more about how to read the economic calendar and trade the news.
Conclusion
The Fed minutes on Wednesday decide the tone of the week of November 16 to 20. Two votes for a hike in October explain much of the dollar's strength, and the minutes will show whether that view is spreading. EUR/USD sits on support at 1.1019, and a break points to 1.0950. Bitcoin trades near 65,500 USD, with 61,800 USD as the level buyers need to hold; a return above 69,300 USD would ease the pressure. US retail sales on Tuesday arrive first and can set expectations for the minutes, with US 500 needing a hold above 7,640 to aim for 7,750.
In the UK and Japan, the data works through the central banks. UK inflation above 3.5% would help GBP/USD off its lows, while a soft print keeps 1.3136 as the target. USD/JPY trades just under 160.18: weak Japanese growth would support a break toward 160.90, and a return below 158.55 would point to a pullback. EUR/USD, GBP/USD and Bitcoin are all deeply oversold, so a calmer Fed could trigger fast rebounds, but a confirmed reversal in any of them needs a recovery above the nearest resistance first.
FAQ
Why is bitcoin down?
Bitcoin has fallen about 25% from its September high of 87,388 USD to near 65,500 USD as investors moved into the dollar and out of risk assets. Two Fed members voted for a rate hike in October, and expectations of higher rates drain liquidity from speculative assets such as crypto. The nearest key support is 61,800 USD.
When are the Fed minutes released?
The minutes of the October 27 to 28 FOMC meeting come out on Wednesday, November 18, 2026, at 2:00 p.m. Eastern Time (19:00 GMT). At that meeting the Fed held the rate at 3.75% to 4.00%, with two members voting for a 25 basis point hike.
What is expected from US retail sales?
October retail sales come out on Tuesday, November 17. The forecast is a 0.6% rise after 0.8% in September, while the market consensus expects no growth. Strong sales would support the dollar and Treasury yields and could weigh on US 500.
What is expected from UK inflation?
UK CPI for October is forecast to stay at 3.5% a year, and the consensus expects 3.6%. A higher figure would support expectations of a cautious Bank of England and help GBP/USD recover from its lows near 1.3211.
Why does Japan's GDP matter for USD/JPY?
Growth of just 0.1% in the third quarter, together with slower inflation on Friday, would reduce the pressure on the Bank of Japan to raise rates. That could push USD/JPY above resistance at 160.18 toward 160.90.
Which level matters most for EUR/USD this week?
The pair sits on support at 1.1019. A break below it points to 1.0950, and a return above 1.1120 would cancel the bearish scenario.
Any forecasts contained herein are based on the author's independent analysis and reflect their personal opinion. These articles should not be construed as trading recommendations or a call to action. The authors and RoboForex accept no responsibility for the results of any trades made on the basis of these recommendations and reviews. Past performance is not indicative of future results. Trading stocks and CFDs involves a high risk of capital loss.