Big Tech Earnings and UK CPI: Market Week Ahead (October 19 – 23)

Big tech earnings take over the week after the Nasdaq's worst week since June. Netflix reports on Tuesday, and Meta and Tesla follow on Wednesday after the US close. Analysts expect Meta's earnings per share at 6.11 USD against 7.25 USD a year earlier, and Tesla's at 0.43 USD against 0.50 USD. On the same Wednesday, UK CPI is forecast to rise to 3.4% year on year from 3.1%. This issue covers USD/CAD, GBP/USD, US Tech and USD/JPY.
Canada opens the week with its September CPI on Monday. The UK publishes jobs data on Tuesday and retail sales on Friday, and Nvidia holds its GTC keynote in Berlin on Wednesday. Japan's national CPI comes out on Friday morning, Tokyo time, with headline inflation seen jumping to between 2.8% and 3.0% from 1.9%. The Fed is in its quiet period before the October 28 decision, so prices this week react to data and earnings without guidance from Fed officials.
Where the Market Stands Going Into the Week
Technology stocks led the market lower last week. US Tech fell 5.55% to 29,188.0, the Nasdaq Composite lost 4.5%, and the Philadelphia Semiconductor Index dropped 3.8% on Friday alone. US 500 lost 2.04% to 7,656.1, while the Dow Jones gained 0.7%. Oil moved the other way: Brent rose 4.65% to 107.26 USD and on Friday traded above 110 USD for the first time since May, as shipping risks grew after a container ship sank in the Strait of Hormuz. Gold slipped 0.72% to 4,164 USD. In currencies, GBP/USD gained 0.69% to 1.3327, USD/CAD fell 0.83% to 1.4137, and USD/JPY eased 0.20% to 157.96. Weekly changes are based on the closes of October 9 and October 16.
US inflation came in hotter than expected. September CPI rose to 3.7% year on year against a 3.6% forecast, and core CPI added 0.3% month on month against 0.2%. Producer prices jumped 1.3% in a month and 6.3% in a year, driven by gasoline. Treasury yields still fell over the week: the 10-year yield dropped by 0.146 percentage points to 5.098%. Fed Chair Kevin Warsh did not signal a hike for October, and as of October 17 CME FedWatch put the odds of an unchanged rate on October 28 at about 84%. A December hike remains the base case.
The earnings season sets a high bar. Of the 46 S&P 500 companies that reported last week, 85% beat profit forecasts, and third-quarter earnings growth for the index is estimated at about 30% year on year. Bank of America estimates growth excluding technology and energy at about 7%, so the index relies on a few large sectors. About 70 S&P 500 companies report this week, and the market will judge big tech on whether rising AI spending turns into revenue.
Key Events of the Week
| Date | Event | Instruments | Importance |
|---|---|---|---|
| Mon, Oct 19 | Canada Consumer Price Index (September) | USD/CAD, Canadian dollar | ●●● High |
| Tue, Oct 20 | UK unemployment rate and wages | GBP/USD, British pound, gilts | ●● Medium |
| Tue, Oct 20 | Netflix earnings (after the US close) | US Tech | ●● Medium |
| Wed, Oct 21 | UK Consumer Price Index (September) | GBP/USD, British pound, gilts | ●●● High |
| Wed, Oct 21 | Nvidia GTC Berlin keynote | US Tech | ●● Medium |
| Wed, Oct 21 | Meta and Tesla earnings (after the US close); Lam Research and Texas Instruments | US Tech, US 500 | ●●● High |
| Thu, Oct 22 | US 20-year Treasury auction | US Treasuries, USD Index | ● Low |
| Fri, Oct 23 | Japan Consumer Price Index (September) | USD/JPY, Japanese yen | ●●● High |
| Fri, Oct 23 | UK retail sales (September) and flash PMIs (October) | GBP/USD, EUR/USD | ●● Medium |
| Fri, Oct 23 | Canada retail sales (August) | USD/CAD, Canadian dollar | ●● Medium |
Instant Access to Global Markets with RoboForex MobileTrader
Everything you need for successful trading in one app: currencies, metals, oil, stocks, indices.
19
Oct
CPI y/y, Forecast
Not published
Previous (August)
3.0%
Why It Matters
Statistics Canada publishes the September CPI on Monday at 8:30 a.m. Eastern Time. No consensus had formed at the time of writing, and TD Securities expects headline inflation to rise to 3.2% from 3.0% on higher energy prices. In August gasoline was 22.8% more expensive than a year earlier, while CPI excluding gasoline rose 2.4%. The Bank of Canada has held its rate at 2.25% for seven meetings in a row and decides again next week. Canada lost 68,000 jobs in September, a report that pushed back expectations of a rate hike in 2026, so the central bank weighs rising prices against a weaker labour market. Retail sales for August follow on Friday.
Market Reaction
Inflation above 3.0%, and especially above 3.2%, would bring back talk of a Bank of Canada hike and support the Canadian dollar, which pushes USD/CAD lower. A reading at or below 3.0% would keep the central bank on hold and could lift the pair. Oil adds a second driver: Brent above 105 USD supports the Canadian dollar as a commodity currency.
Market Sentiment
We see a moderately negative backdrop for USD/CAD: expensive oil supports the Canadian dollar, and higher energy prices are likely to keep headline inflation firm. On the H4 chart, USD/CAD trades around 1.4095. The pair fell 0.83% last week, keeps falling on Monday and has left its rising channel. The stochastic has broken below its support line and sits deep in oversold, so a pullback to the broken support at 1.4160, now resistance, is likely before the decline resumes. The target of the decline is 1.3945. A break above resistance and a hold above 1.4170 would strengthen buyers and point to a further rise.
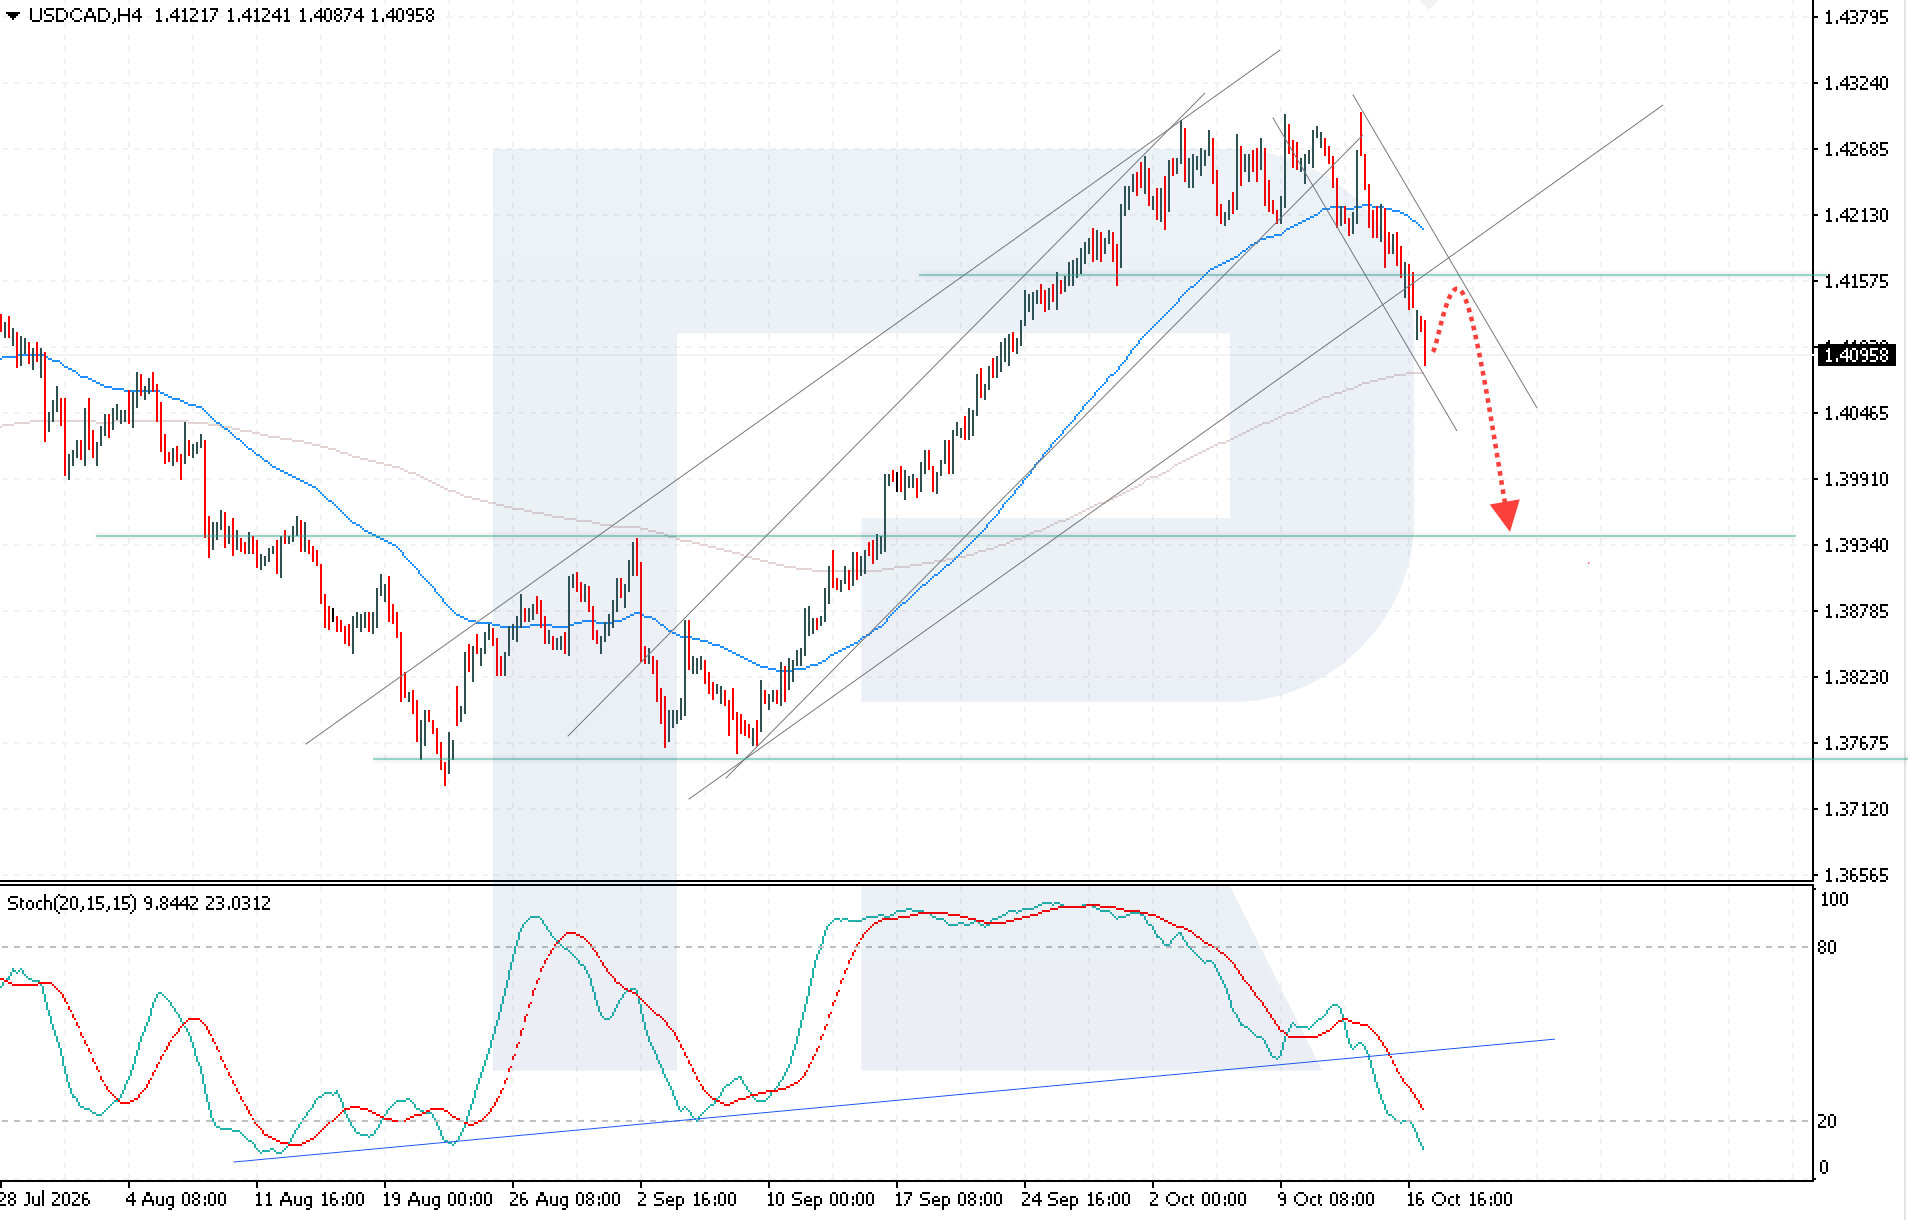
Key Levels and Trade Parameters — USD/CAD
| Parameter | Value |
|---|---|
| Resistance | 1.4160 / 1.4205 |
| Support | 1.3945 |
| Entry, Sell Limit | 1.4160 |
| Stop loss | 1.4205 |
| Take profit | 1.3945 |
| Risk to reward | 1:4.8 |
21
Oct
CPI y/y (Wed, Oct 21), Forecast
3.4%
Previous
3.1%
Unemployment Rate (Tue, Oct 20), Forecast
Not published
Previous
4.9%
Why It Matters
The forecast puts UK inflation at its highest level this year and above the 3.0% the Bank of England expects. Futures price a rate hike on November 5 with a probability of 90% to 95%, and 54 of 63 economists polled on October 12 to 14 expect the Bank Rate to rise to 4.00%. With the hike largely priced in, the CPI report matters for the path after November. The jobs data on Tuesday comes first: unemployment held at 4.9% in the three months to July, and regular pay grew 3.5%. Retail sales on Friday and the upcoming Autumn Budget complete the picture.
Market Reaction
CPI at or above 3.4%, together with stable unemployment, would confirm the November hike and raise the question of a second one, which supports the pound and gilt yields. A reading below the forecast would leave the market with an expensive bet on the Bank of England and could weigh on GBP/USD more than a strong reading would lift it.
Market Sentiment
We see a moderately positive backdrop for the pound: inflation is expected to rise, and August GDP grew 0.1% against a forecast decline of 0.1%. On the H4 chart, GBP/USD set a new low during the week and then closed it with a sharp rise, and it now trades around 1.3324. The pair has left its sideways range and stays inside the descending channel. A pullback to the broken range boundary at 1.3285 is expected, followed by a rise toward 1.3475. The stochastic is rising after a test of its rising trendline and has reached overbought, which fits a short pullback before further gains. A break below local support and a hold below 1.3240 would cancel the bullish scenario and point to renewed pressure from sellers.
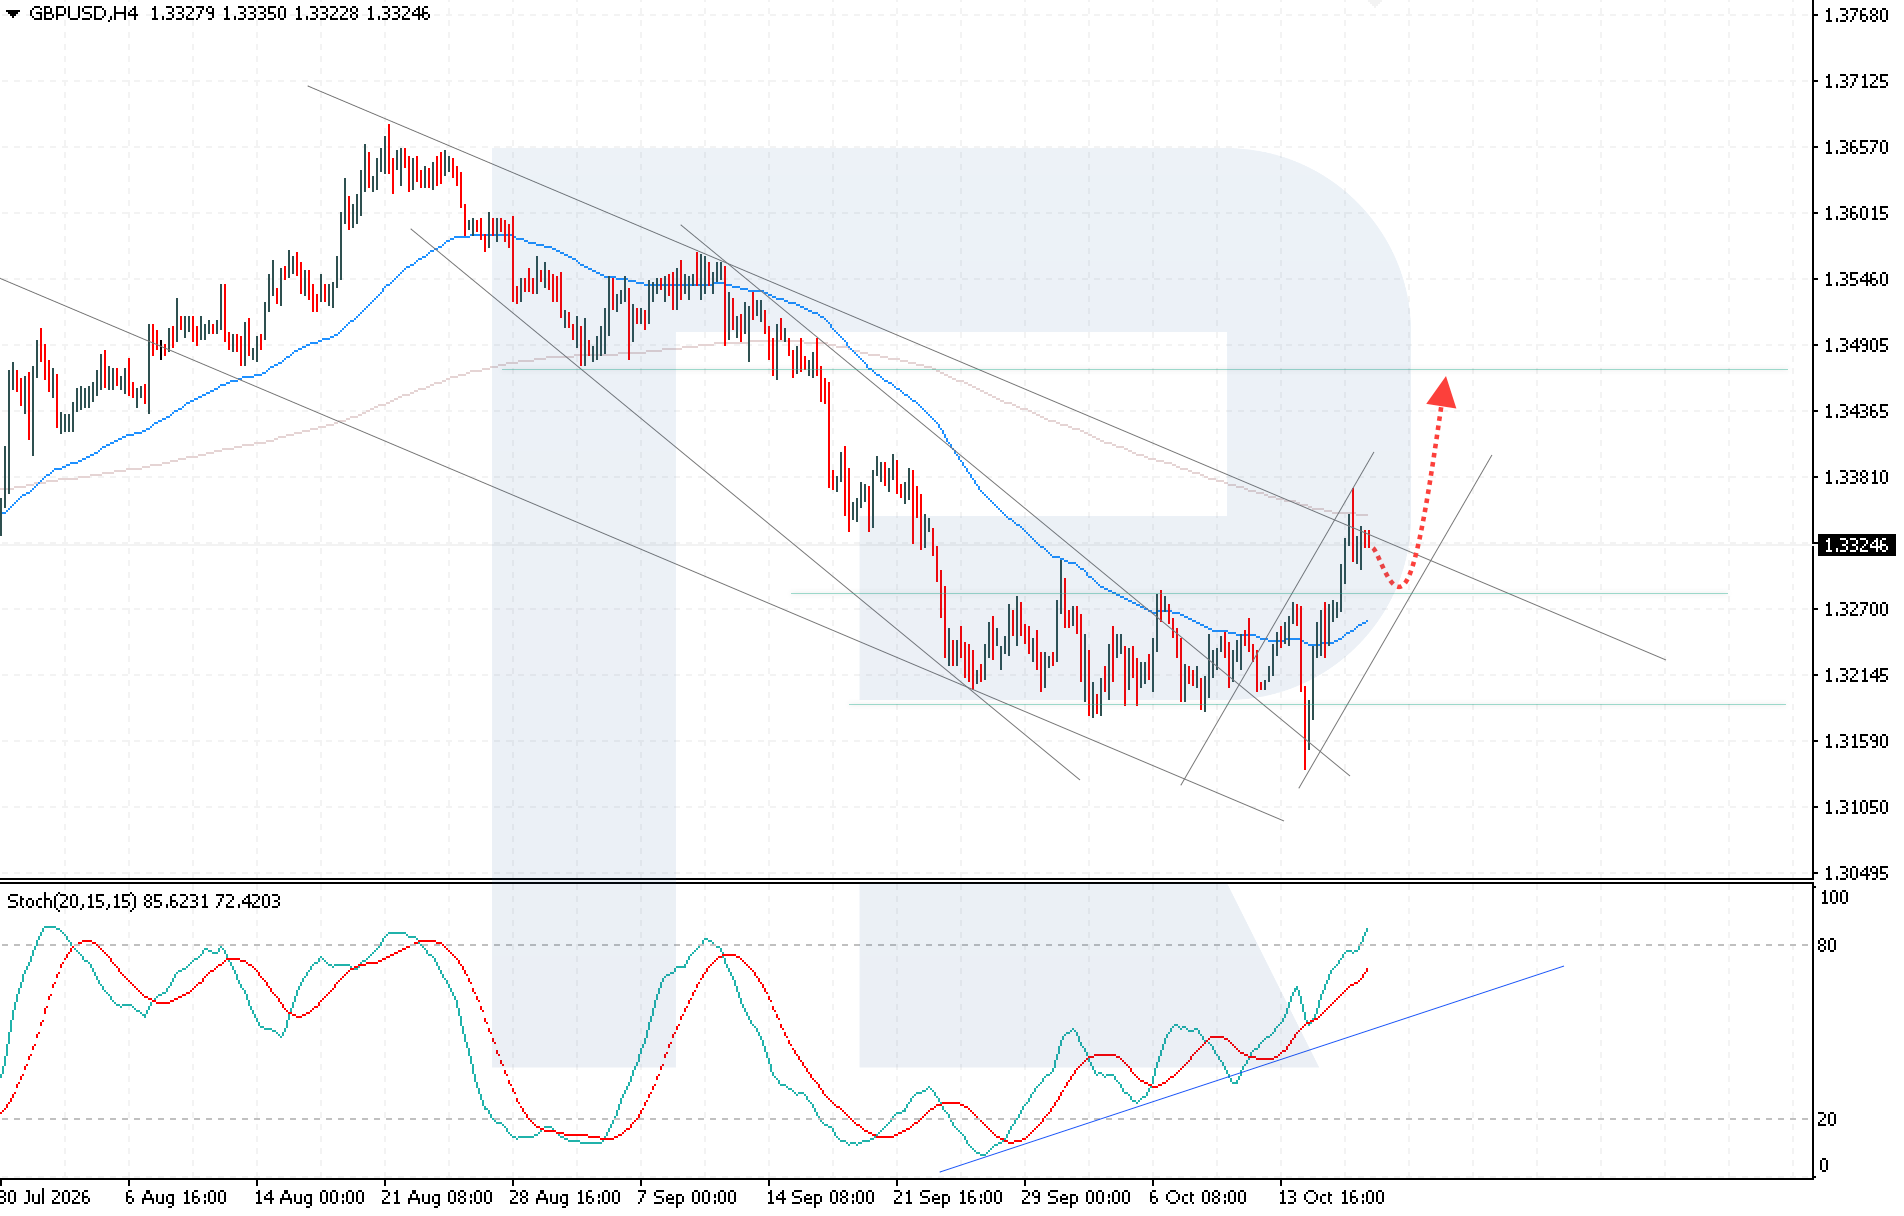
Key Levels and Trade Parameters — GBP/USD
| Parameter | Value |
|---|---|
| Resistance | 1.3475 |
| Support | 1.3285 / 1.3240 |
| Entry, Buy Limit | 1.3285 |
| Stop loss | 1.3240 |
| Take profit | 1.3475 |
| Risk to reward | 1:4.2 |
21
Oct
Meta EPS (Q3), Forecast
6.11 USD
Q3 2025
7.25 USD
Tesla EPS (Q3), Forecast
0.43 USD
Q3 2025
0.50 USD
Why It Matters
The big tech earnings arrive after US Tech lost 5.55% in a week and chip stocks fell the hardest. Meta's revenue is expected to grow about 23% to 63.3 billion USD, while earnings per share are expected to fall and capital spending to roughly double from a year earlier. Tesla's revenue is seen near 27.9 billion USD, close to last year's level. Options price a move of about 6% in each stock after the report. Netflix opens the series on Tuesday, Lam Research and Texas Instruments report on Wednesday, and Nvidia's GTC keynote in Berlin on Wednesday shows how demand for AI hardware is holding up.
Market Reaction
Results above forecasts and spending plans backed by revenue growth would support a rebound in US Tech after last week's sell-off. Weak guidance or spending that grows faster than revenue would extend the decline in technology stocks and weigh on US 500.
Market Sentiment
Our view on US Tech is cautiously positive: after the sharp fall, a good part of the risk is already in the price, and the stochastic points to a rebound. On the H4 chart, US Tech trades around 29,584 after it bounced off local support. In the scenario, a pullback to support at 29,125 is a buying opportunity, and a breakout above the upper boundary of the descending channel with a hold above 29,785 would confirm the rise. The target is 30,885. The stochastic has reached oversold and formed a bullish crossover, which points to a possible rise. A confident break below local support and a hold below 28,725 would cancel the bullish scenario.
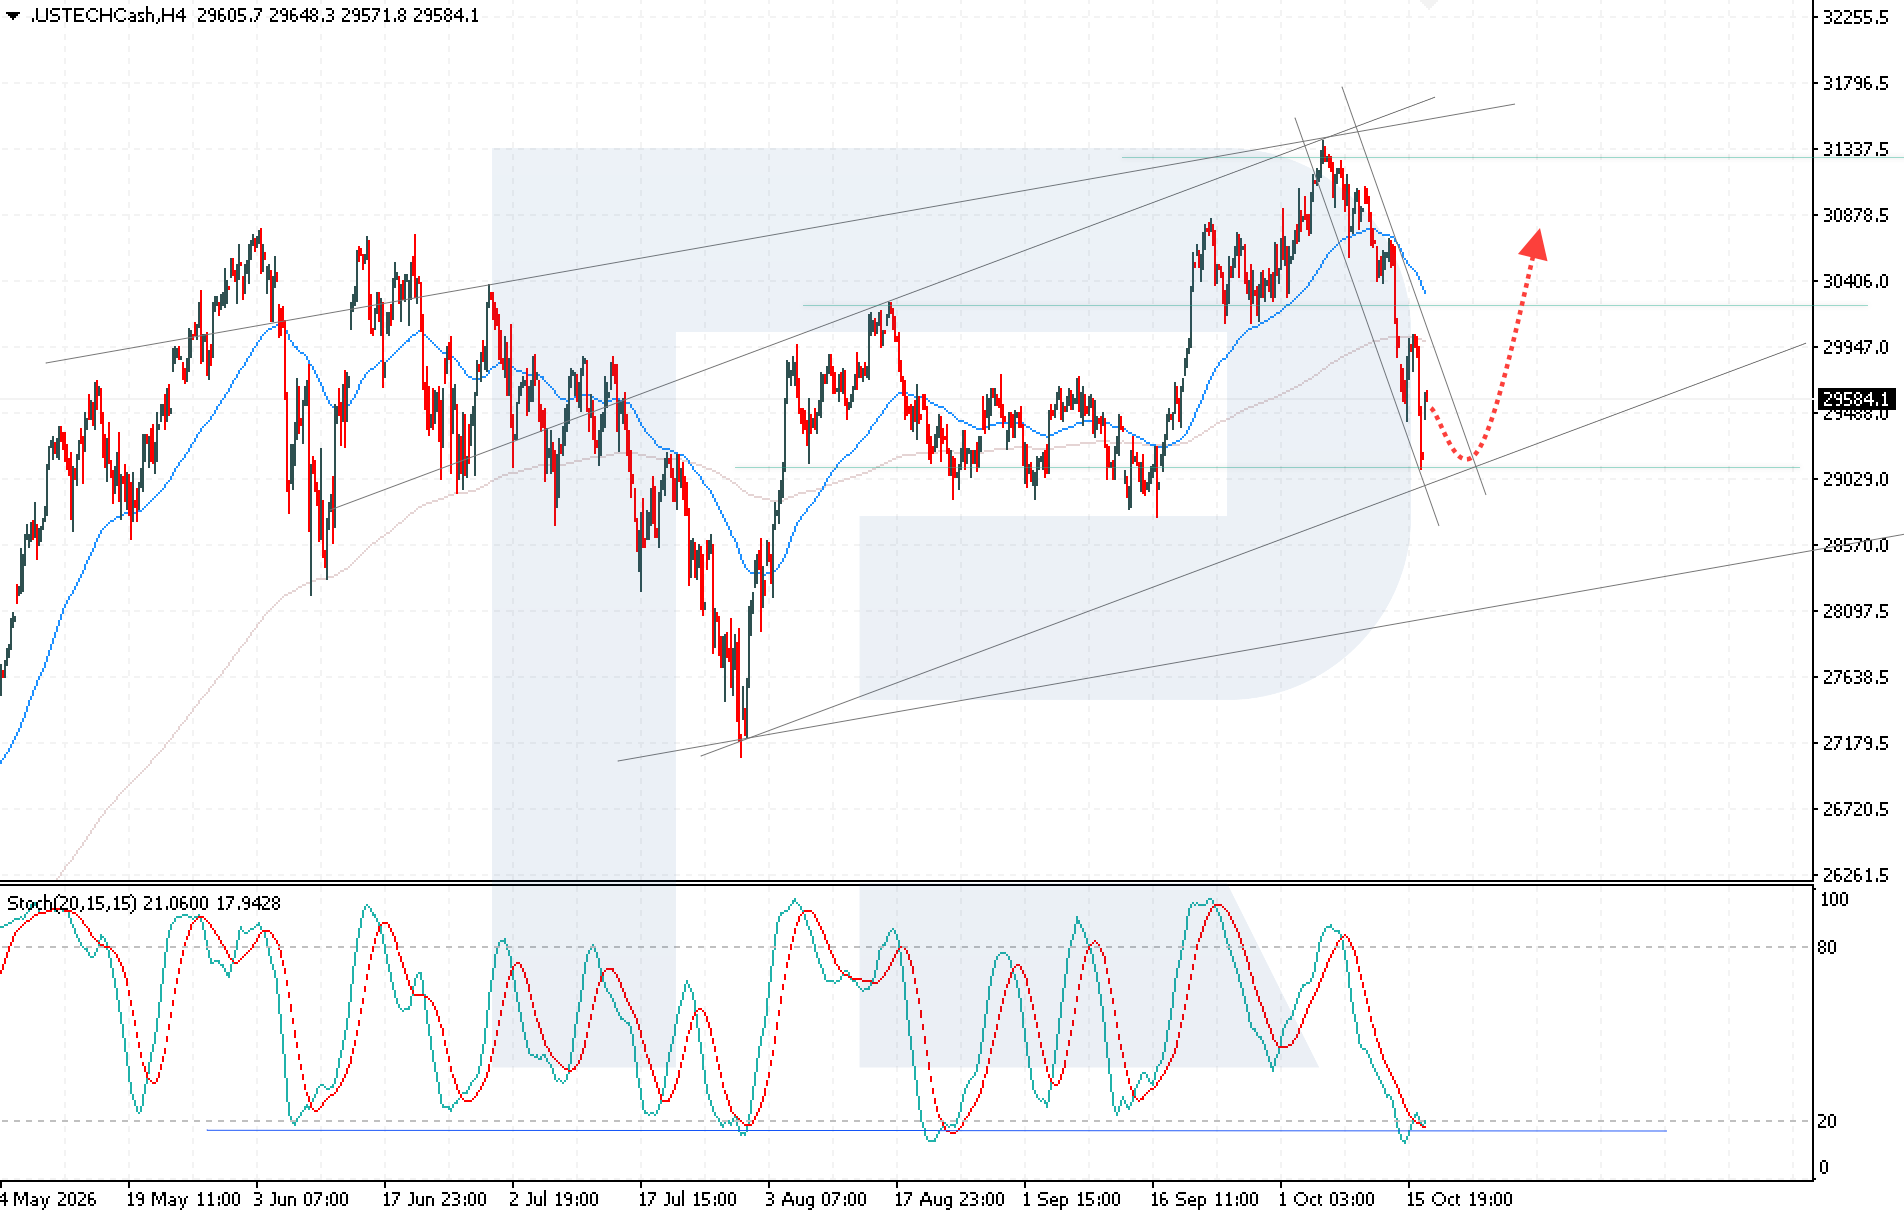
Key Levels and Trade Parameters — US Tech
| Parameter | Value |
|---|---|
| Resistance | 29785 / 30885 |
| Support | 29125 / 28725 |
| Entry, Buy Limit | 29125 |
| Stop loss | 28725 |
| Take profit | 30885 |
| Risk to reward | 1:4.4 |
23
Oct
CPI y/y, Forecast
2.8% to 3.0%
Previous
1.9%
Core CPI y/y, Forecast
Not published
Previous
1.7%
Why It Matters
The data comes out at 8:30 a.m. Tokyo time on Friday, Thursday evening in New York, a week before the Bank of Japan meets on October 29 and 30. Headline inflation is expected to jump by about a full percentage point, and core inflation is also seen rising clearly. The Bank of Japan raised its rate to 1.25% on September 18 in a 7 to 2 vote. In mid-October traders priced about a 10% chance of another hike in October and about 88% by December, and Bloomberg reported that officials lean toward skipping October. A strong reading would test that plan.
Market Reaction
Inflation at the top of the forecast range or above it would firm up bets on a December hike, or even bring October back into play, which supports the yen and pushes USD/JPY lower. A reading below 2.8% would ease pressure on the Bank of Japan and could lift the pair. The risk of intervention limits the upside: the last intervention to support the yen, on July 31, came with the pair near 164.
Market Sentiment
We see a moderately negative backdrop for USD/JPY: rising inflation in Japan strengthens the case for the next Bank of Japan hike. On the H4 chart, USD/JPY closed last week lower and ended a run of four weekly gains in a row. The pair trades around 158.01 and stays below the lower boundary of a rising wedge, a reversal pattern, which points to a further decline toward 155.45. The stochastic is falling after a rebound from its descending resistance line, a sign that the decline may resume soon. A break of local support and a hold below 157.45 would be the signal for the bearish scenario. A break above resistance and a hold above 158.55 would strengthen buyers and cancel it.
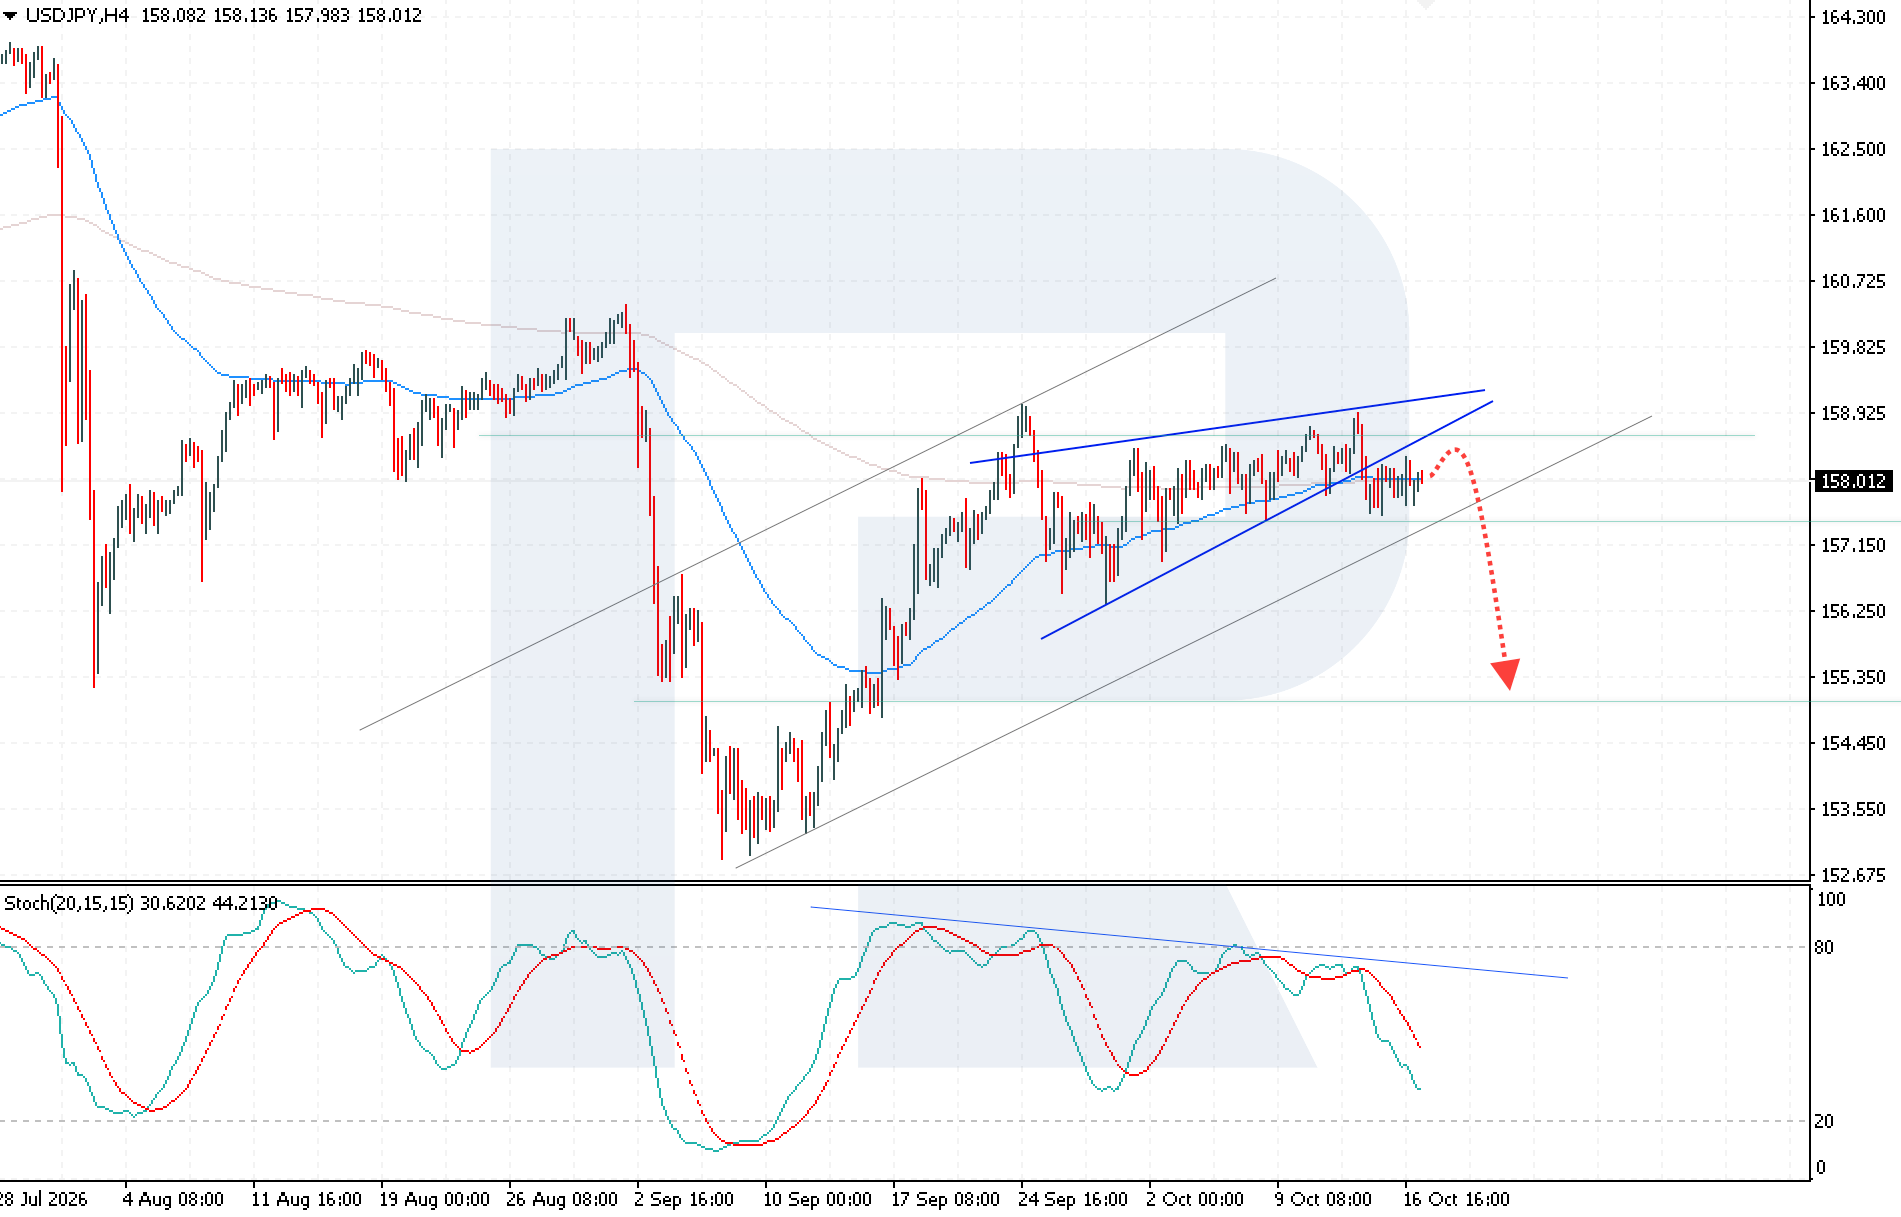
Key Levels and Trade Parameters — USD/JPY
| Parameter | Value |
|---|---|
| Resistance | 158.05 / 158.55 |
| Support | 157.45 / 155.45 |
| Entry, Sell Stop | 157.45 |
| Stop loss | 158.05 |
| Take profit | 155.45 |
| Risk to reward | 1:3.3 |
What Else to Watch
Flash PMIs for October on Friday show how business activity in Europe, the UK and the US is holding up, with eurozone services expected near 53. On Thursday the US Treasury sells 20-year bonds, a test of demand after yields touched multi-year highs this month, and Lockheed Martin reports earnings. Moody's reviews France's credit rating on Friday, which can move EUR/USD. Oil stays in focus all week: shipping risks in the Strait of Hormuz and US inventory data on Wednesday decide whether Brent holds above 105 USD.
Track the forecast and the actual figure for each release, since the gap between consensus and the outcome is what tends to move prices the most. Learn more about how to read the economic calendar and trade the news.
Conclusion
Big tech earnings decide where technology stocks go after their worst week since June. Results from Meta and Tesla that justify the spending would support US Tech: a pullback to 29,125 sets up the bullish scenario with a target at 30,885, and a hold below 28,725 cancels it. UK CPI on Wednesday tests the pound: a reading at or above 3.4% supports a move in GBP/USD from 1.3285 toward 1.3475, while a hold below 1.3240 cancels the idea.
Inflation in Canada and Japan completes the week. Firm Canadian CPI and expensive oil support the scenario of a USD/CAD decline from 1.4160 toward 1.3945, with a hold above 1.4170 strengthening buyers. In Japan, a jump in CPI would back a move in USD/JPY below 157.45 toward 155.45, and a hold above 158.55 would cancel the bearish case.
FAQ
When do Meta and Tesla report their third-quarter results?
Both companies report on Wednesday, October 21, 2026, after the US market close. Netflix reports a day earlier, on Tuesday, October 20, also after the close.
How do big tech earnings move US Tech?
The largest technology companies carry a large weight in the index, so their results and guidance can move it by several percent. Investors watch revenue growth, profit margins and capital spending plans. Strong results support the index, while weak guidance can trigger a sell-off across the sector.
What time is UK CPI released?
The Office for National Statistics publishes CPI at 7:00 a.m. UK time. The September figures come out on Wednesday, October 21, 2026, two weeks before the Bank of England decision on November 5.
When is Japan's CPI released?
Japan's Statistics Bureau publishes national CPI at 8:30 a.m. Tokyo time. The September data comes out on Friday, October 23, 2026, which is Thursday evening in Europe and New York.
Why does oil matter for USD/CAD?
Canada is a major oil exporter, so higher oil prices usually support the Canadian dollar and push USD/CAD lower. Energy prices also feed into Canadian inflation, which shapes the Bank of Canada's rate decisions.
Any forecasts contained herein are based on the author's independent analysis and reflect their personal opinion. These articles should not be construed as trading recommendations or a call to action. The authors and RoboForex accept no responsibility for the results of any trades made on the basis of these recommendations and reviews. Past performance is not indicative of future results. Trading stocks and CFDs involves a high risk of capital loss.