Walk Forward Optimisation in MetaTrader 5: How to Find Robot Settings That Hold Up

Walk forward optimisation finds a trading robot's best settings on one stretch of price history and then tests them on the next stretch, which the search never saw. If the settings keep working there, they are less likely to be fitted to past noise. This guide runs the whole check in the MetaTrader 5 Strategy Tester.
TL;DR
- Let the Strategy Tester search the robot's signal inputs on the first part of the history.
- Set a Forward period, so MT5 reruns the best combinations on the later part without searching again.
- Keep a combination that holds on both parts and whose neighbours score close to it. A stable result on history still gives no guarantee of profit in live trading.
Run the Test on a Free Demo Account
Open a RoboForex demo account and use the MetaTrader 5 Strategy Tester with real price history.
What Is Walk Forward Optimisation?
Walk forward optimisation is a test that splits the chosen history into two consecutive parts: the Strategy Tester picks the robot's settings on the first part and checks them on the second. The first part is called in-sample, the second out-of-sample. Run the same split on several windows that move forward in time, and the test is called walk forward analysis. The MetaTrader 5 Strategy Tester makes one split per run.
Start of the testForward dateEnd
In-sample. The tester runs the robot with many combinations of inputs and ranks them by the criterion you chose, such as the highest profit or the lowest drawdown.
Out-of-sample. The tester reruns the best combinations on later prices. Nothing is searched here, and these prices played no part in the choice.
A plain backtest runs the robot once with fixed inputs. Search those inputs again and again on the same prices, and they start to match random details of that period. This is called curve fitting or overfitting: the settings describe the past and lose their edge on any other data. The out-of-sample part shows when the result drops after the search.
In MetaTrader 5 the split is set in the Forward field of the tester, and the two parts report in separate tabs, Optimization Results and Forward Results. Good scores in both tabs mean the settings are not tied to one stretch of history. They do not promise that the robot will make money next month.
What Does Optimisation Change in a Trading Robot?
EA optimization changes the inputs that decide when the robot trades. For a trend robot these are usually the periods of a fast and a slow moving average. Other strategies tune oscillator levels or trading filters. The tester runs every combination you allow on the chosen history and compares them by one criterion.
In a crossover robot built on two moving averages, only the two periods are optimised. Lot size, Stop Loss and Take Profit stay fixed, so the results show the effect of the indicator settings alone. The magic number stays fixed too: it only lets the robot tell its own trades apart and has no effect on entries or exits.
Change the signal and the risk settings in one run, and you cannot tell which change moved the result. Lot size, stops and the magic number are explained in Trading Robot Settings Explained: Lot Size, Stops and Magic Number.
Step 1. Choose the Inputs and Their Ranges
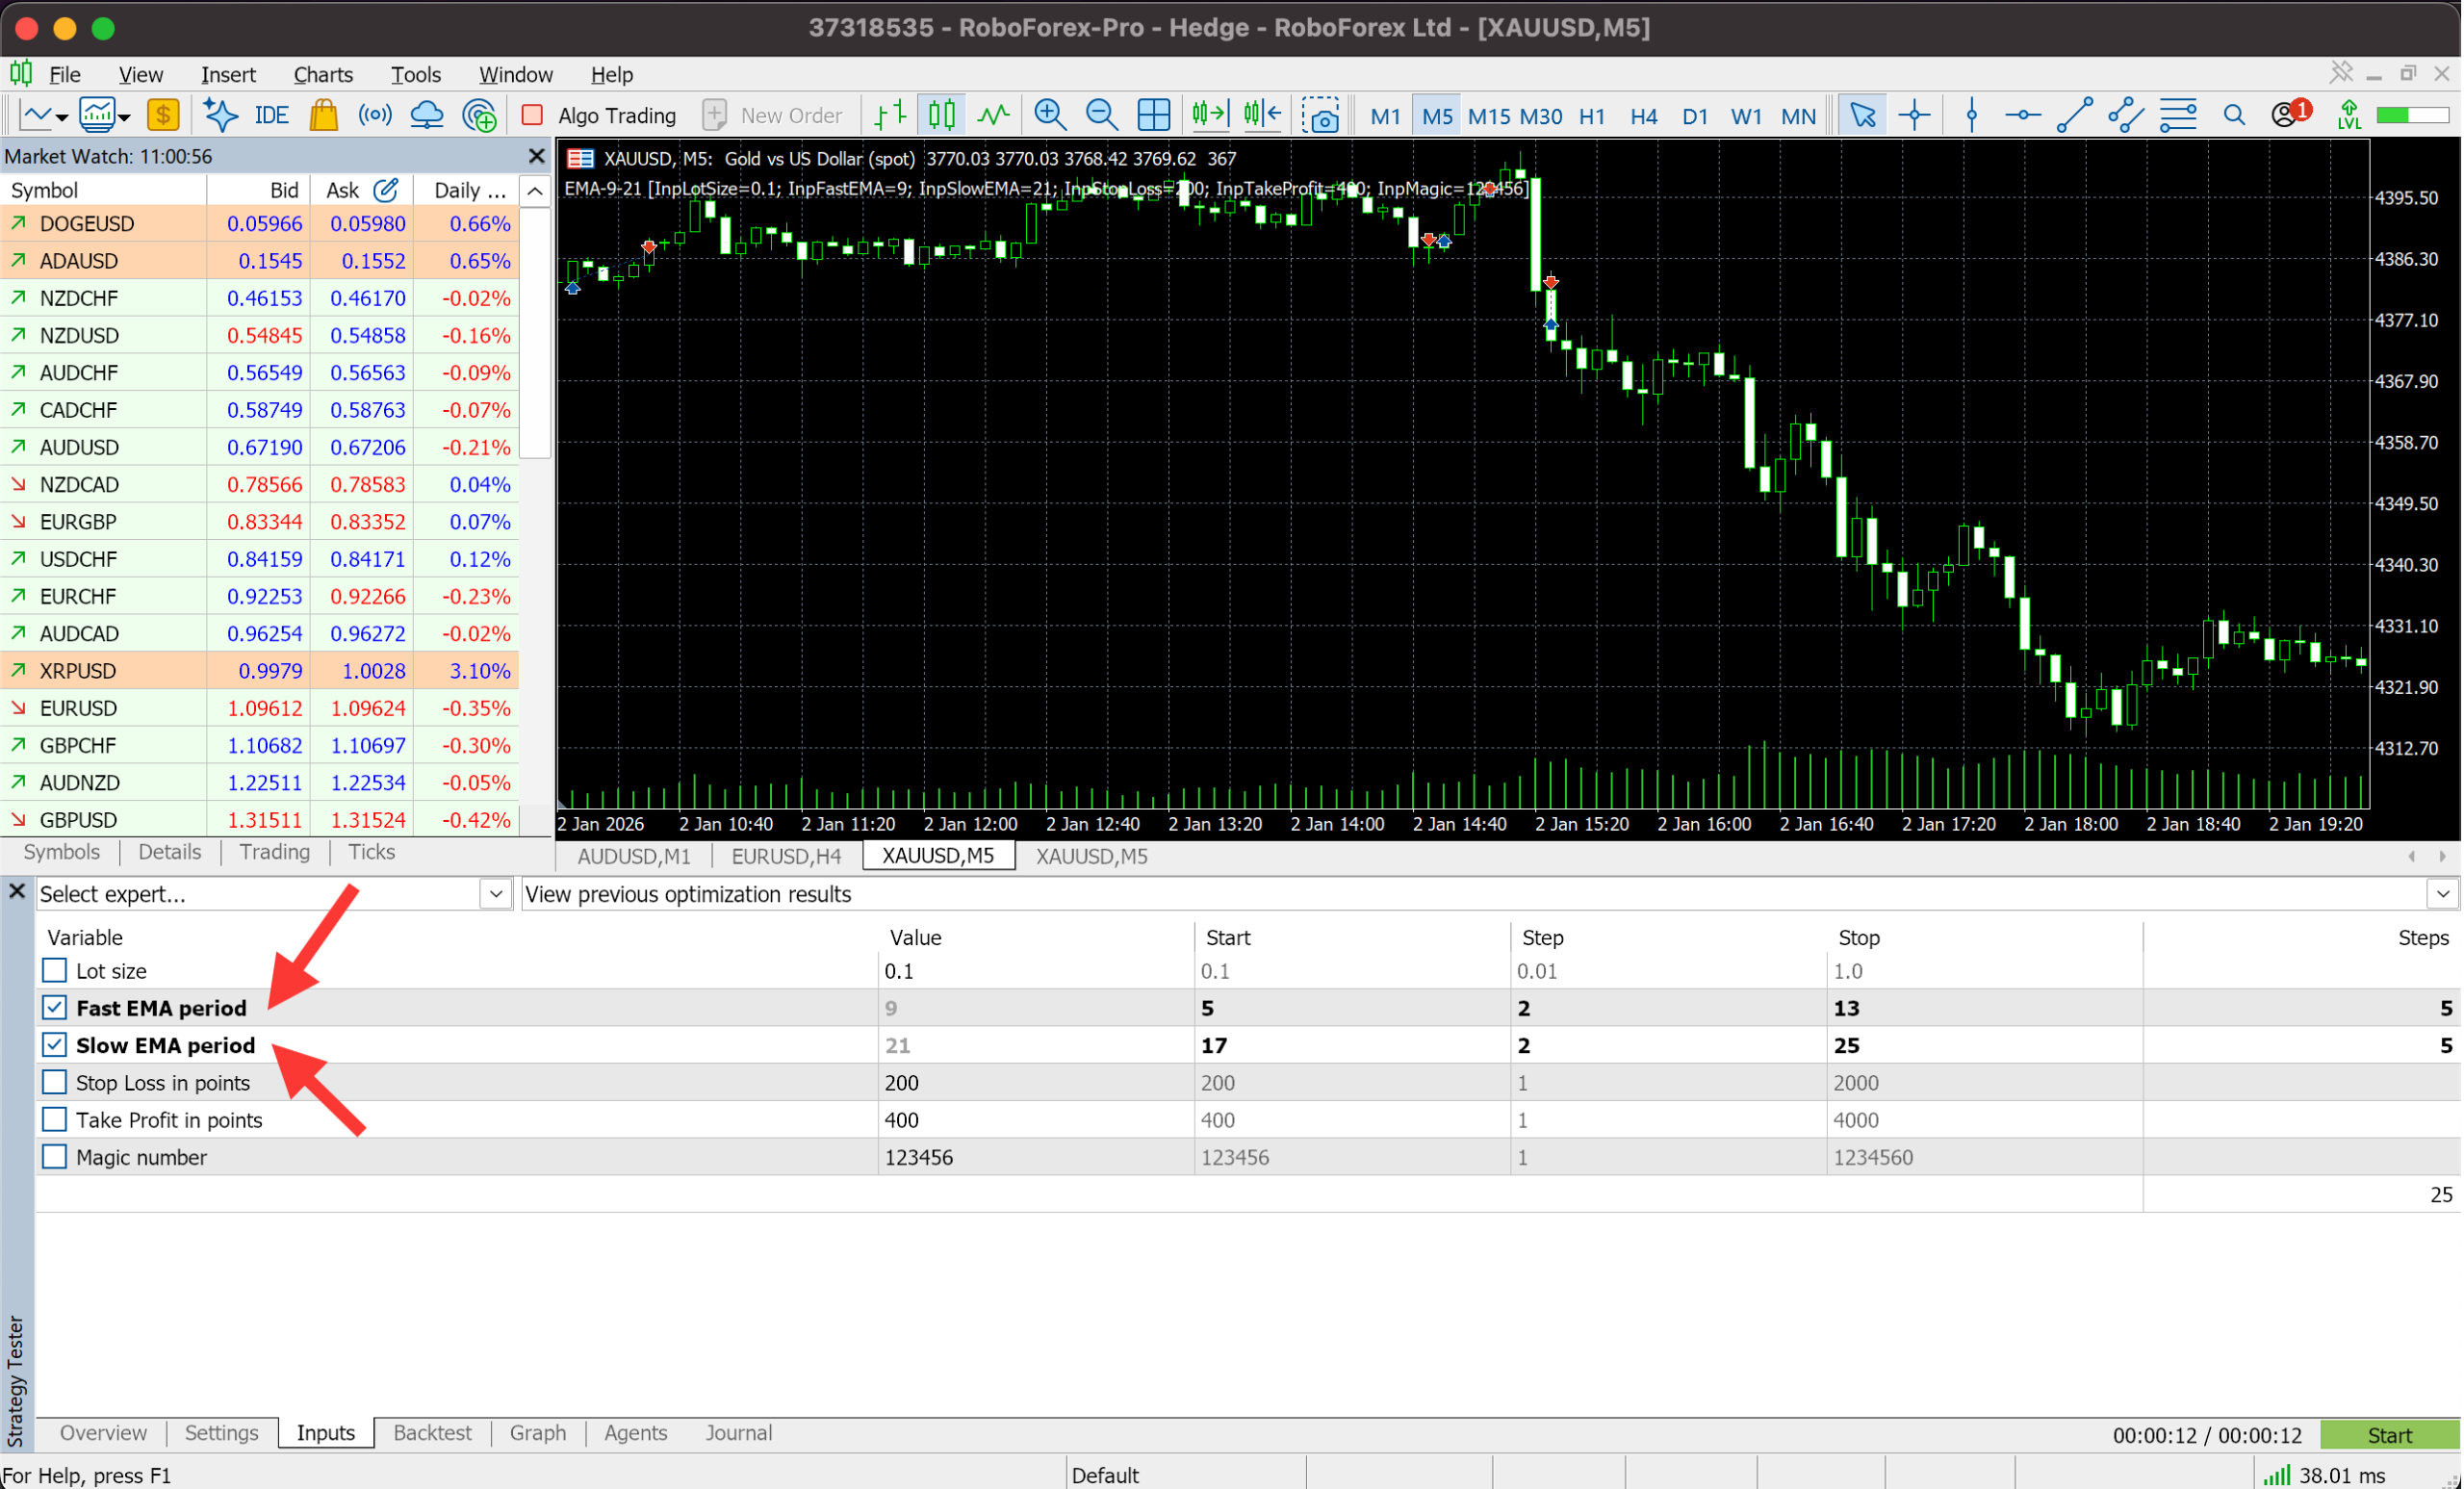
The example robot opens trades when a fast and a slow exponential moving average (EMA) cross. It is the robot from Your First MQL5 Expert Advisor, so you can repeat every step on your own terminal. The ranges for the MT5 optimization are set on the Inputs tab of the Strategy Tester.
The tick box to the left of an input includes it in the expert advisor optimization. Each ticked input takes three values: Start, the first value tested; Step, the gap between values; and Stop, the last value. A range from 5 to 13 with a step of 2 tests 5, 7, 9, 11 and 13.
| Input | What it controls | Default | Optimised range |
|---|---|---|---|
| Fast EMA period | Period of the fast EMA | 9 | 5 to 13, step 2 (5 values) |
| Slow EMA period | Period of the slow EMA | 21 | 17 to 25, step 2 (5 values) |
| Lot size | Trade volume | 0.10 | Fixed |
| Stop Loss in points | Distance to the Stop Loss | 200 | Fixed |
| Take Profit in points | Distance to the Take Profit | 400 | Fixed |
| Magic number | Tag on the robot's own trades | 123456 | Fixed |
The tester will run 25 combinations: five fast periods times five slow ones. MT5 shows the count of values per input in the Steps column and the total under it. The defaults from the code, 9 and 21, sit inside both ranges, and the four fixed inputs stay unticked.
Step 2. Pick the Algorithm and the Criterion
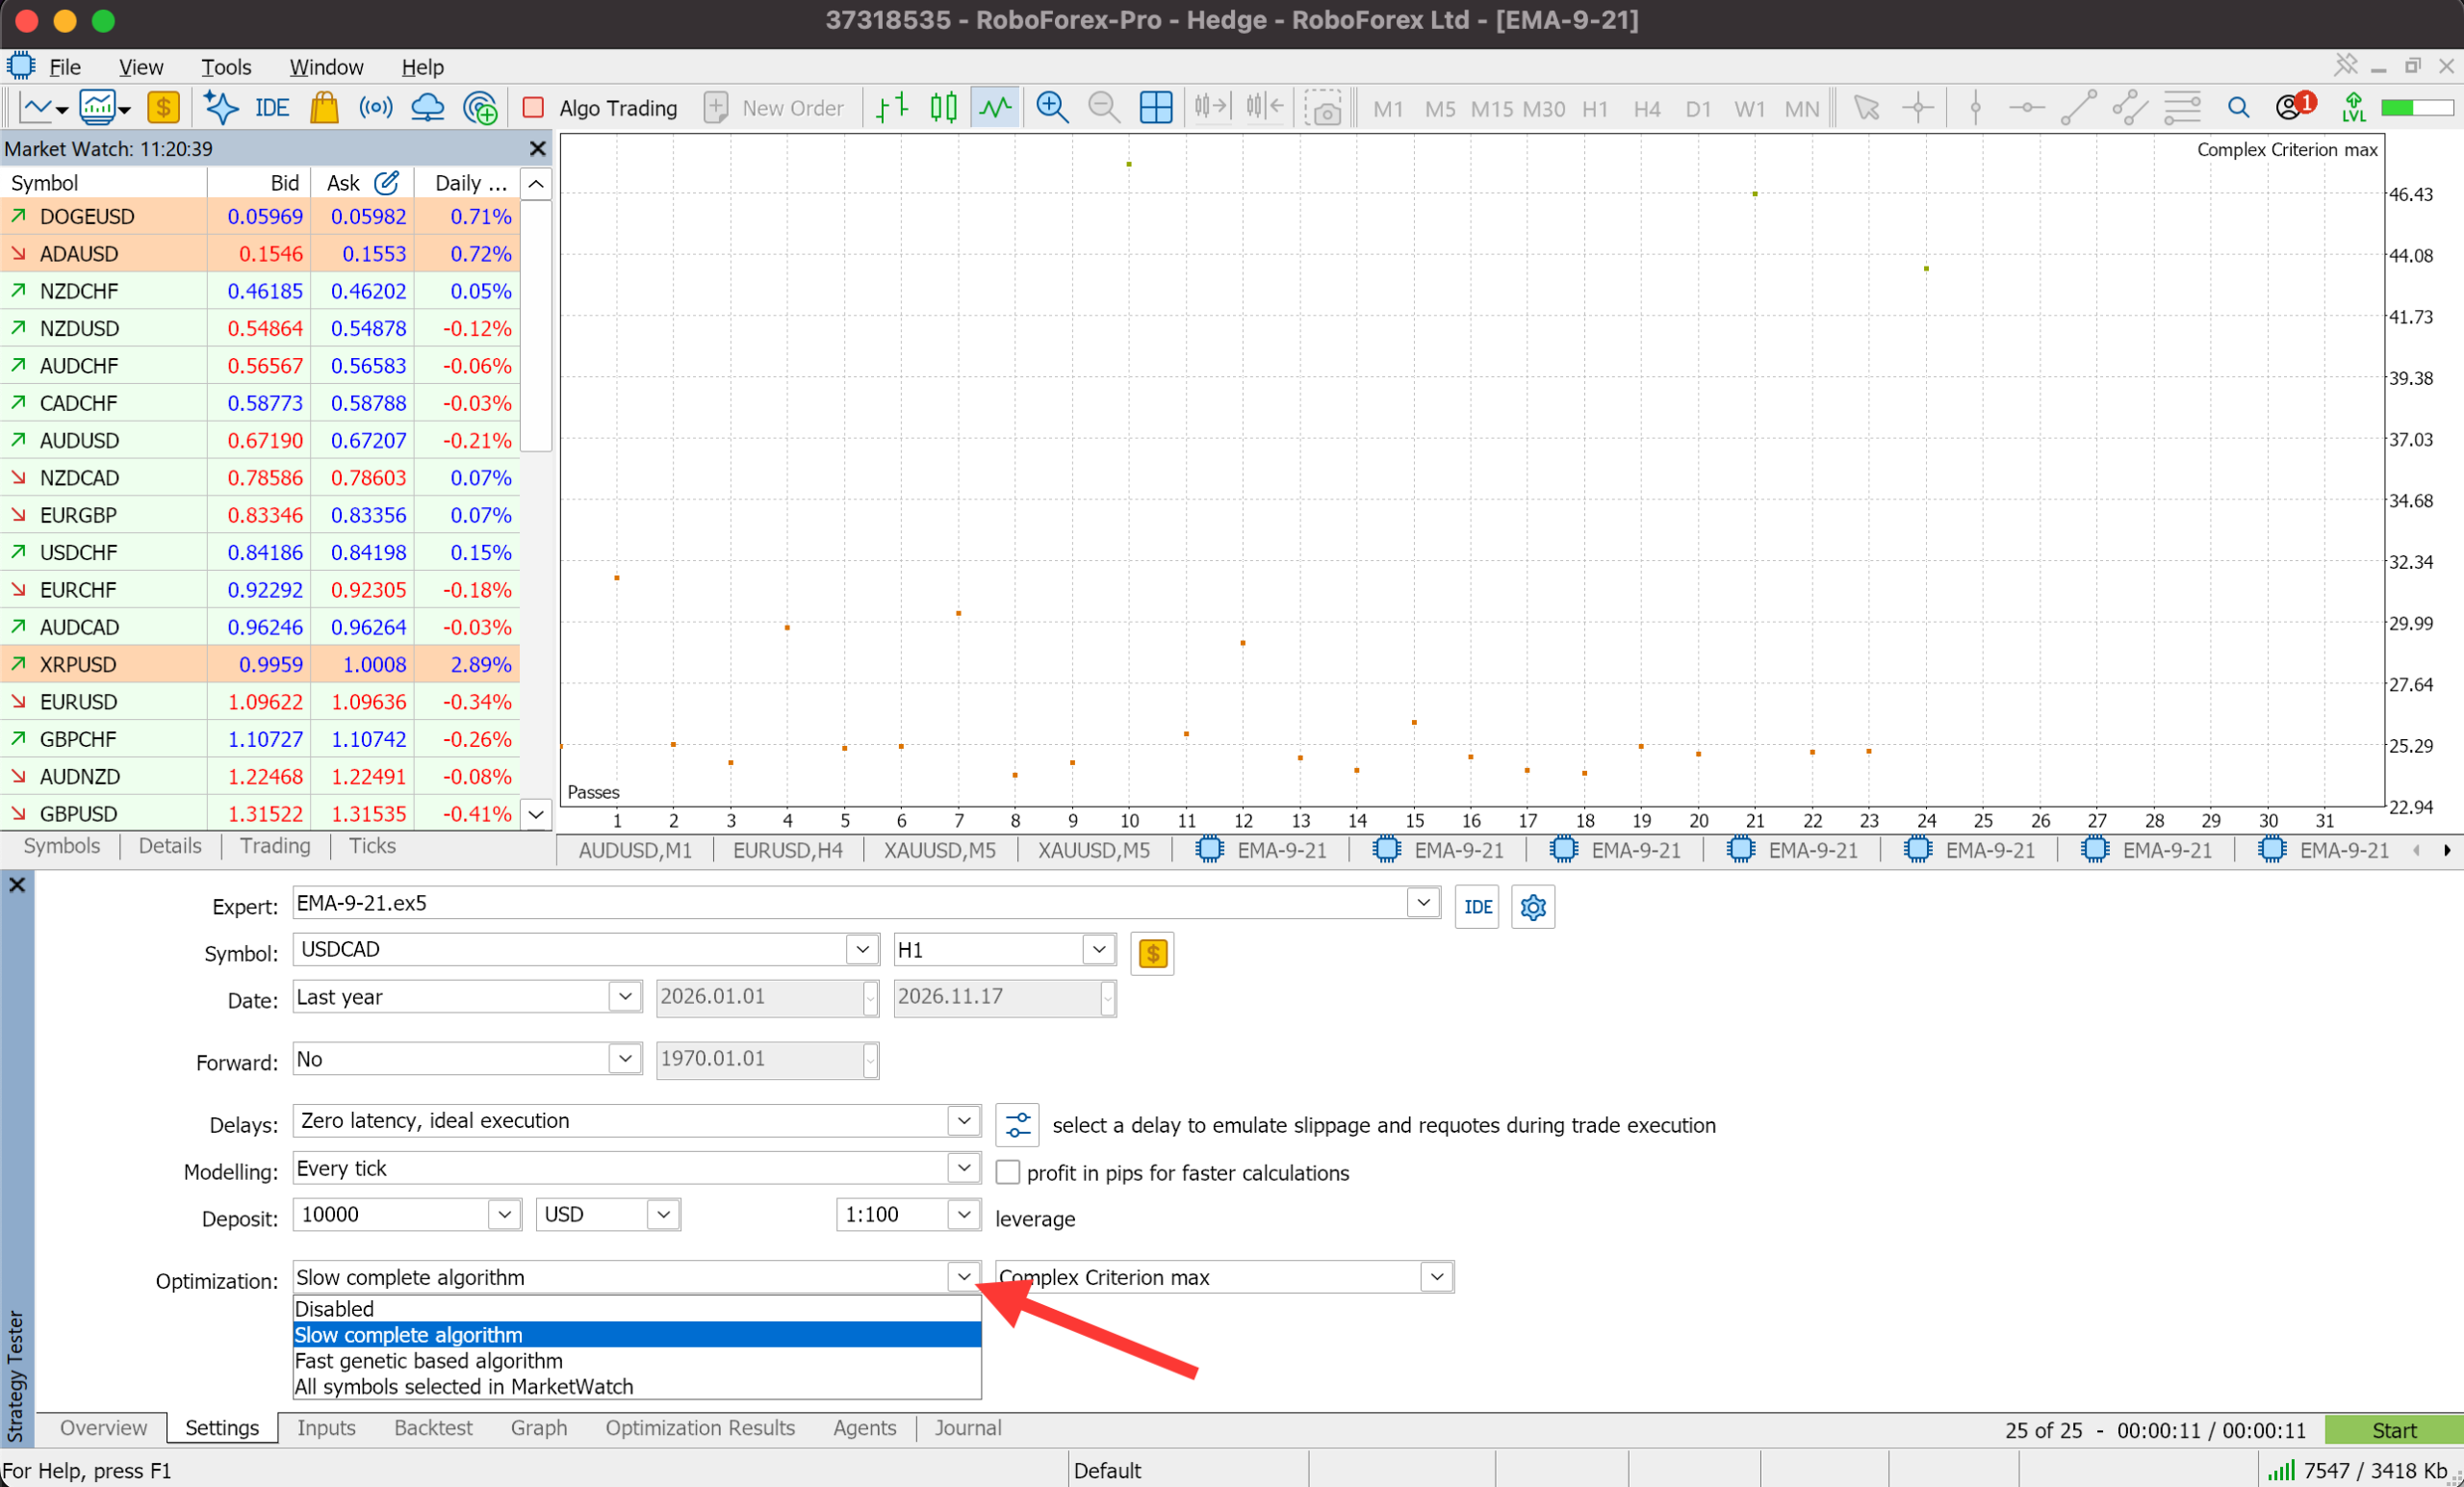
The optimisation mode and the criterion are set on the Settings tab. For the 25 combinations above, Slow complete algorithm fits: it tests every one of them. Fast genetic based algorithm tests only part of the combinations and moves toward the better ones, which is how genetic algorithm trading tools save time on large searches. MT5 sets no fixed number of combinations at which to switch to it; the time also depends on how complex the robot is and how long one run takes.
Optimisation Modes in the MetaTrader 5 Strategy Tester
| Mode | What it does | When to use it |
|---|---|---|
| Slow complete algorithm | Tests every combination of the ticked inputs | When the full search finishes in reasonable time, as with 25 combinations |
| Fast genetic based algorithm | Searches for strong combinations without testing each one | When the full search would take too long |
| All symbols selected in MarketWatch | Runs one set of inputs on every symbol in the Market Watch window | When you compare the robot across several instruments |
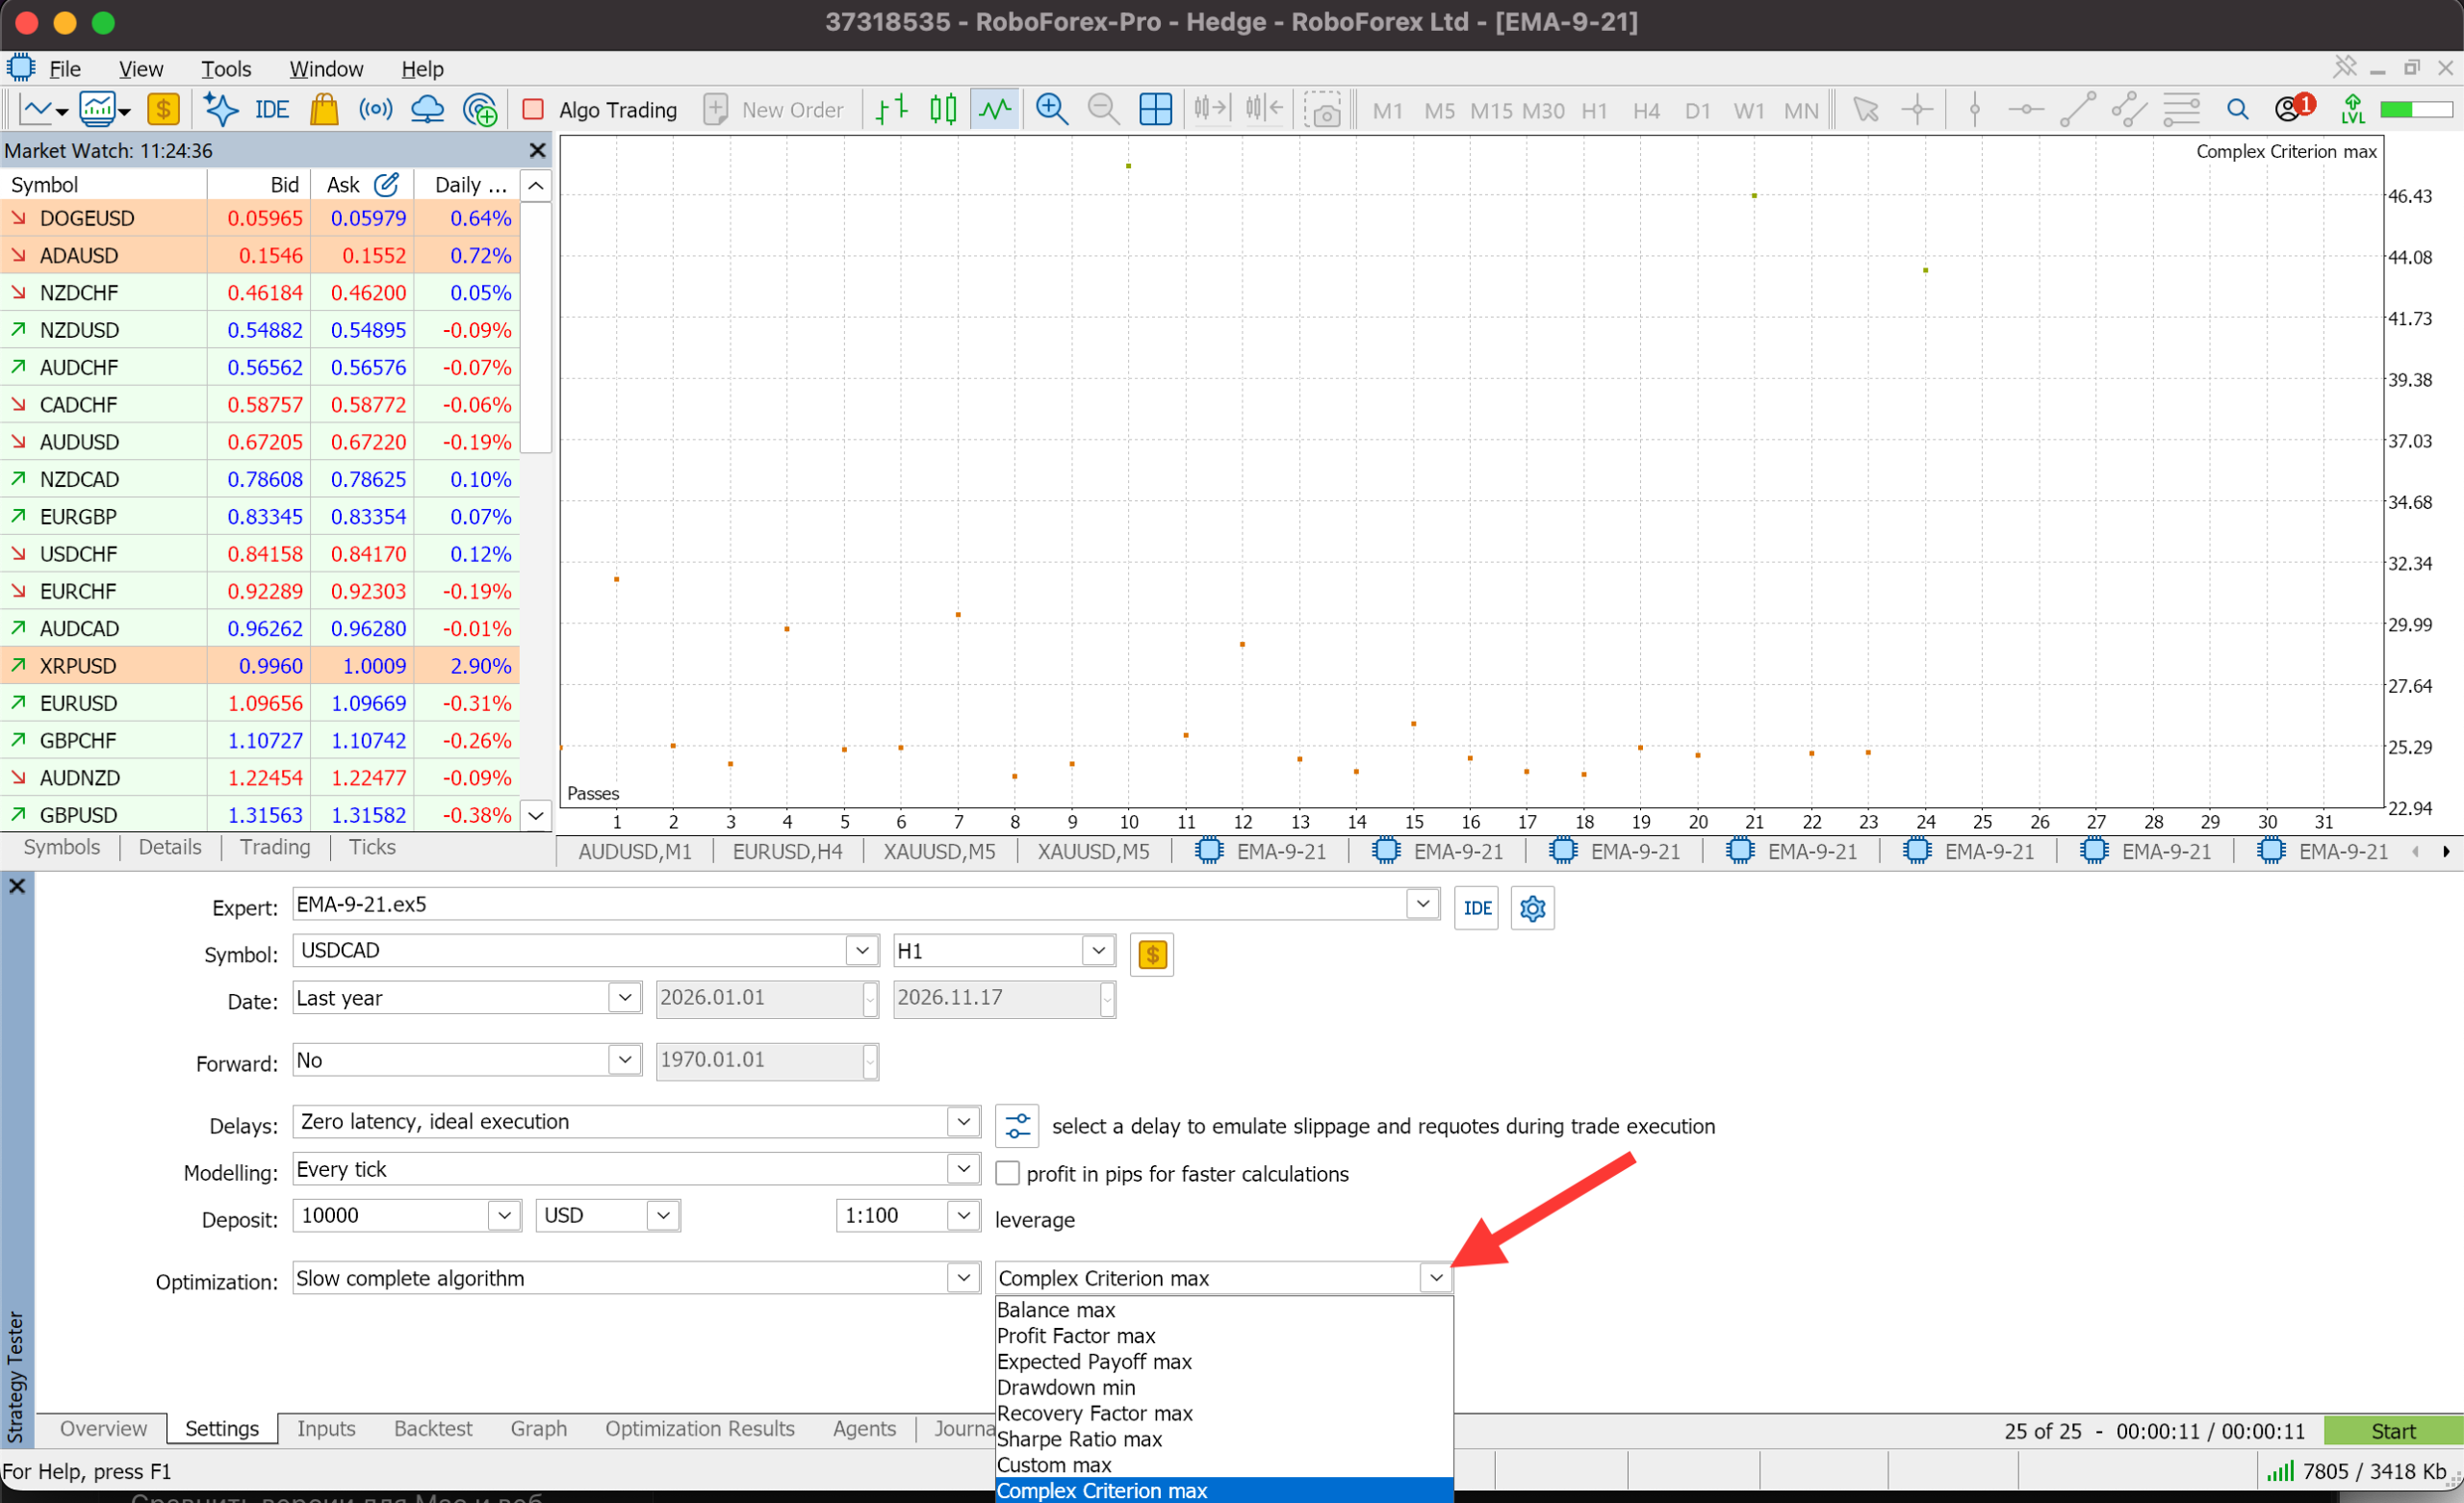
The second dropdown holds eight criteria. The criterion is the value MT5 uses to rank the runs and pick the most successful ones.
Eight Optimisation Criteria in MetaTrader 5
| Criterion | The highest-ranked run has |
|---|---|
| Balance max | The largest balance at the end of the test |
| Profit Factor max | The highest ratio of gross profit to gross loss |
| Expected Payoff max | The highest average profit or loss per trade |
| Drawdown min | The smallest relative drawdown of the balance |
| Recovery Factor max | The highest ratio of profit to maximum drawdown |
| Sharpe Ratio max | The best return relative to how much the results swing |
| Custom max | The highest value returned by the robot's OnTester() function |
| Complex Criterion max | The best combined score from the number of trades, drawdown and several performance measures |
In the genetic mode the criterion steers the search: it decides which combinations the tester keeps working with. In the complete mode every combination runs whatever the criterion, and the criterion still sorts the results and decides which runs go to the forward period. For a first run that should not lean on a single number, Complex Criterion max is a reasonable choice.
Step 3. Set the Forward Period
The forward period is set in the Forward field on the Settings tab. MT5 cuts the date range into two consecutive parts: it searches for inputs on the first and reruns the chosen combinations on the later prices.
- No turns the forward check off, and the search covers the whole range.
- 1/2 gives the second half of the range to the check and the first half to the search.
- 1/3 gives the last third to the check and the first two thirds to the search.
- 1/4 gives the last quarter to the check and the first three quarters to the search.
- Custom lets you pick the date when the check starts. The forward part runs from that date to the end of the range.
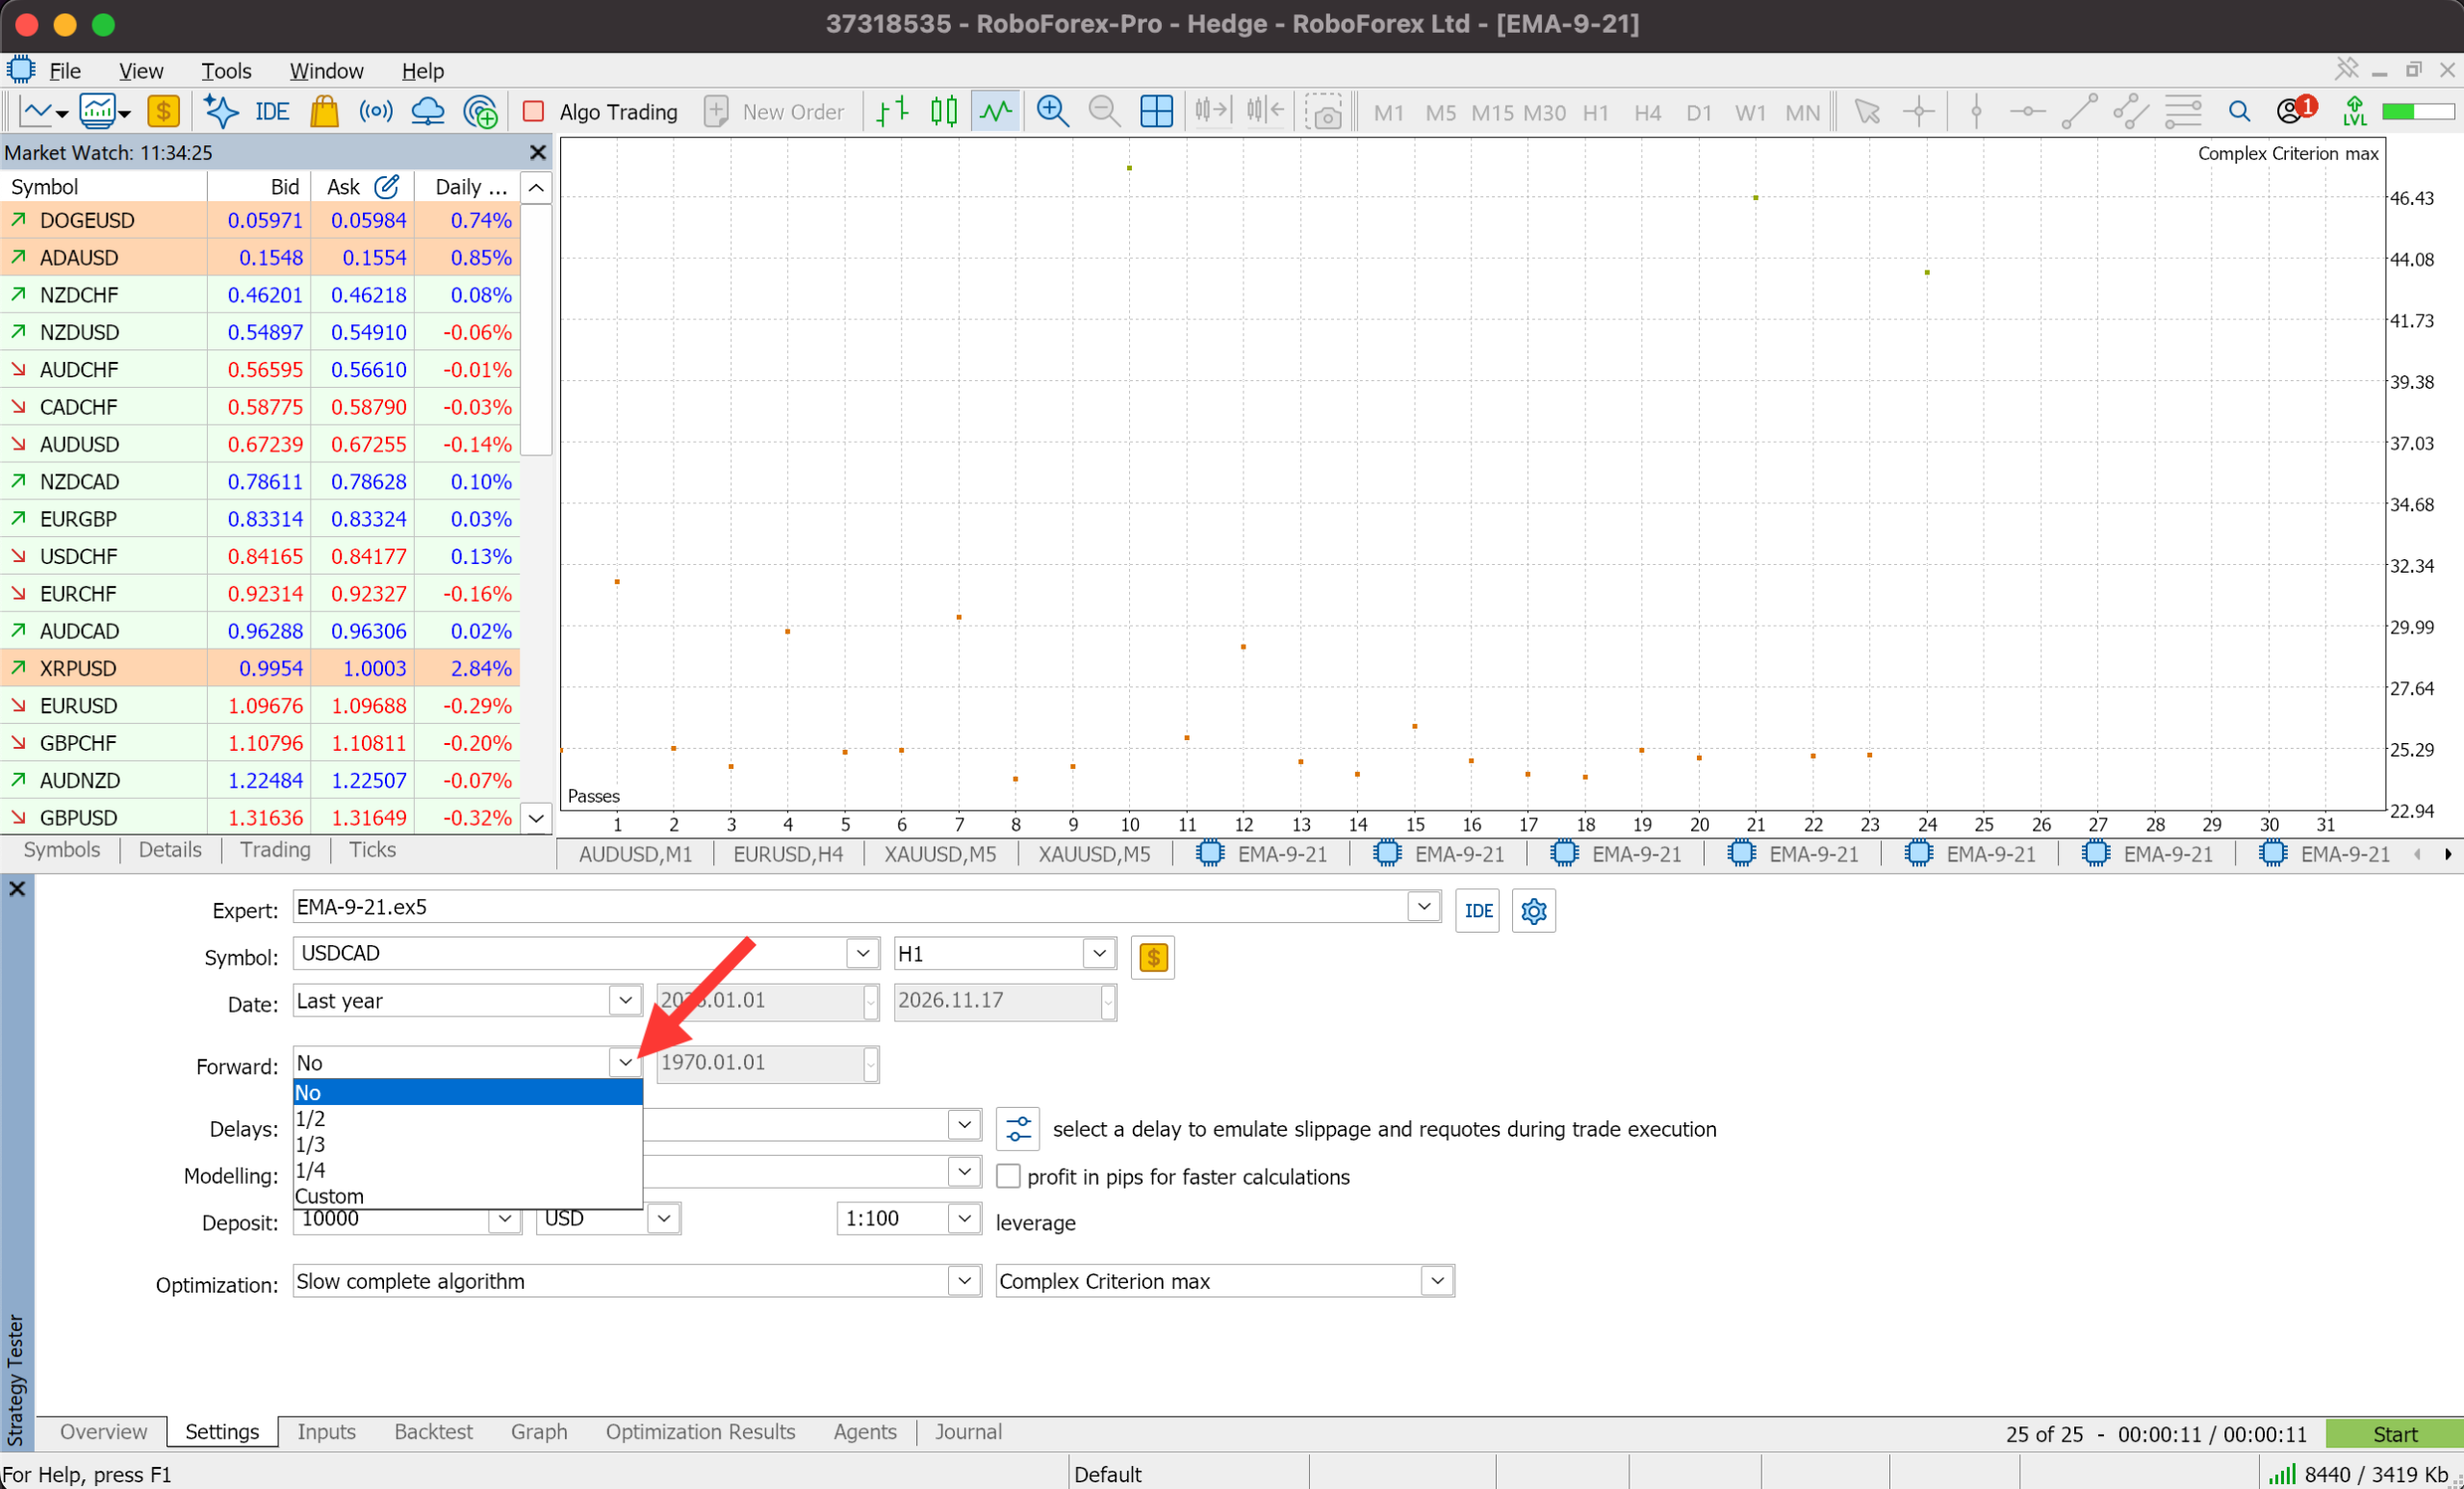
No ratio fits every robot. Weigh the total length of the history against the number of trades each part will hold: a forward part with a handful of trades tells you little. MT5 then decides how many runs to check, as the MetaTrader 5 Help describes. After a complete search it sends the best 10% of runs to the forward period, after a genetic search the best 25%. If that comes to fewer than 256 runs, the next best are added until there are 256, and if the whole search had fewer than 256 runs, all of them go forward. With 25 combinations, all 25 are checked.
Step 4. Read the Results and the Optimisation Graph
When the run ends, three tabs hold the results. Optimization Results lists every combination with its score on the search period. Graph plots the same scores as points. Forward Results shows how the chosen combinations did on the later prices.
Optimization Results: Scores on the Search Period
Each row of Optimization Results is one combination of inputs. The Pass column numbers it, so you can find the same combination in the other tabs, and the InpFastEMA and InpSlowEMA columns show its two periods. Click a column header to sort by it. A high score here says how well the combination fitted the search period and nothing about the prices that come after it.
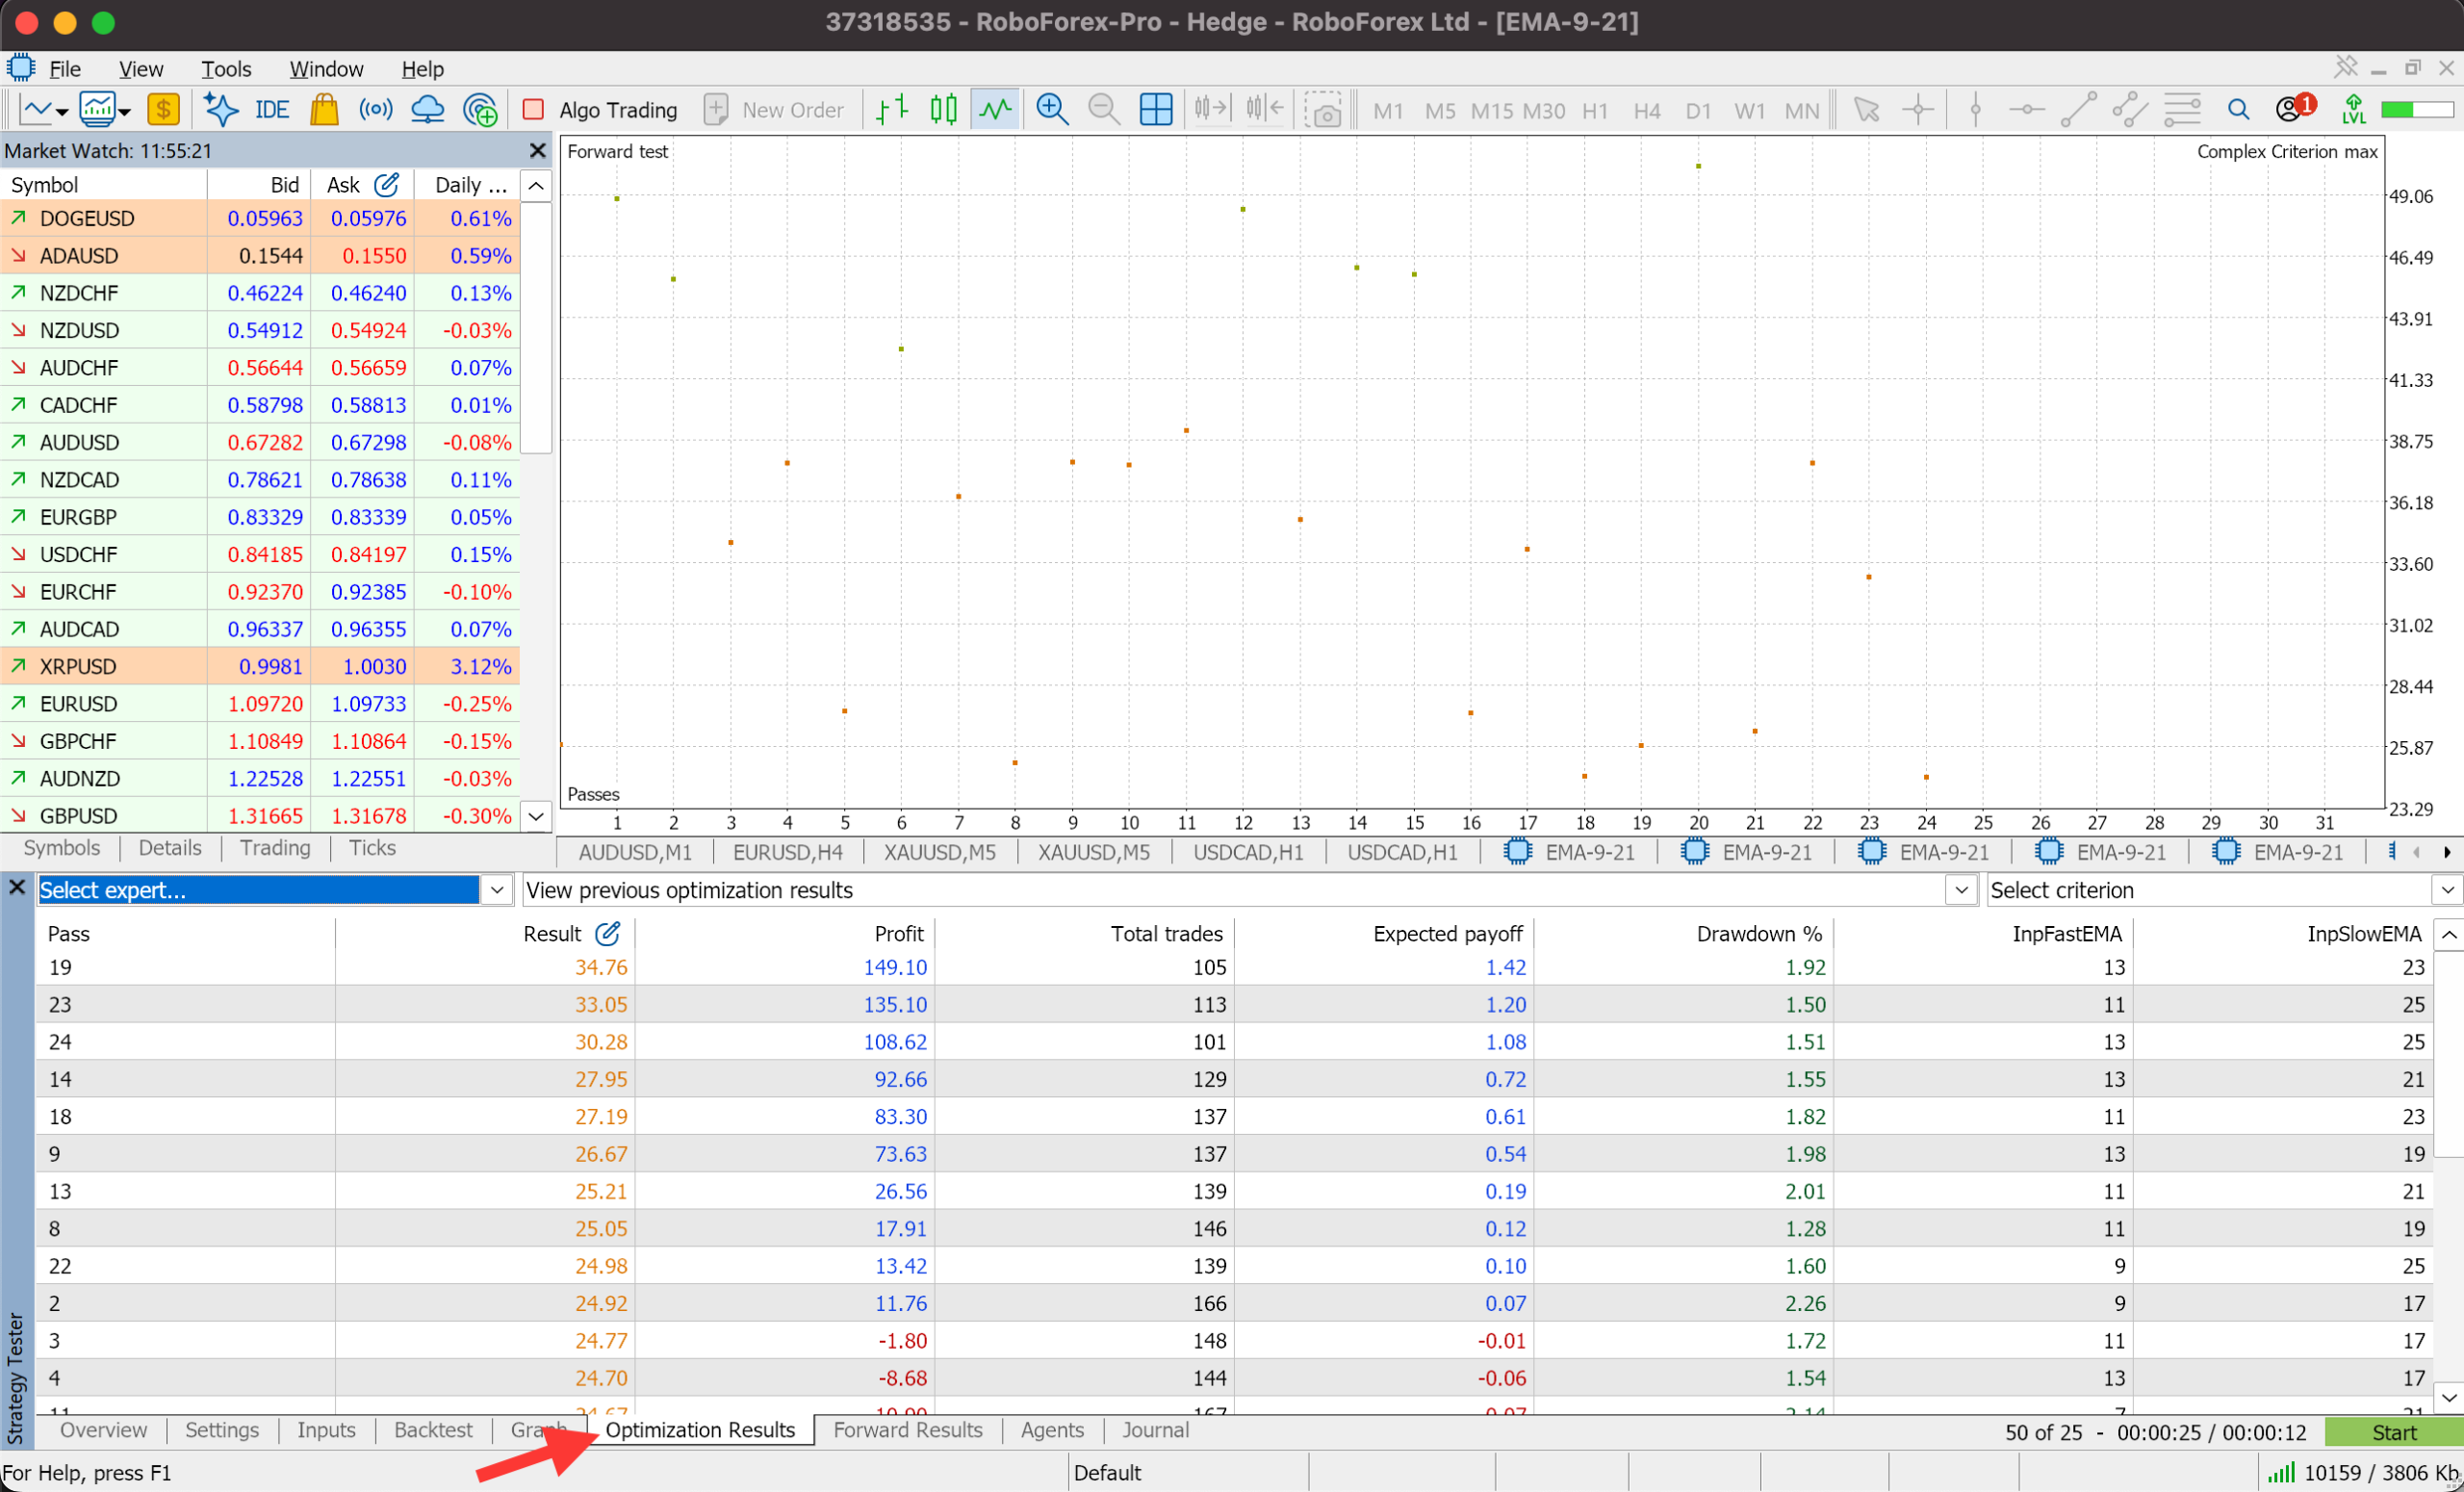
The Graph: Is One Point Far Above the Rest?
On the Graph tab every combination is a point: the run number runs along the bottom and the criterion score up the side. It shows at a glance whether one result towers over the others or several combinations score about the same. It does not show how close their input values are, so check the periods of the top points in the results table.
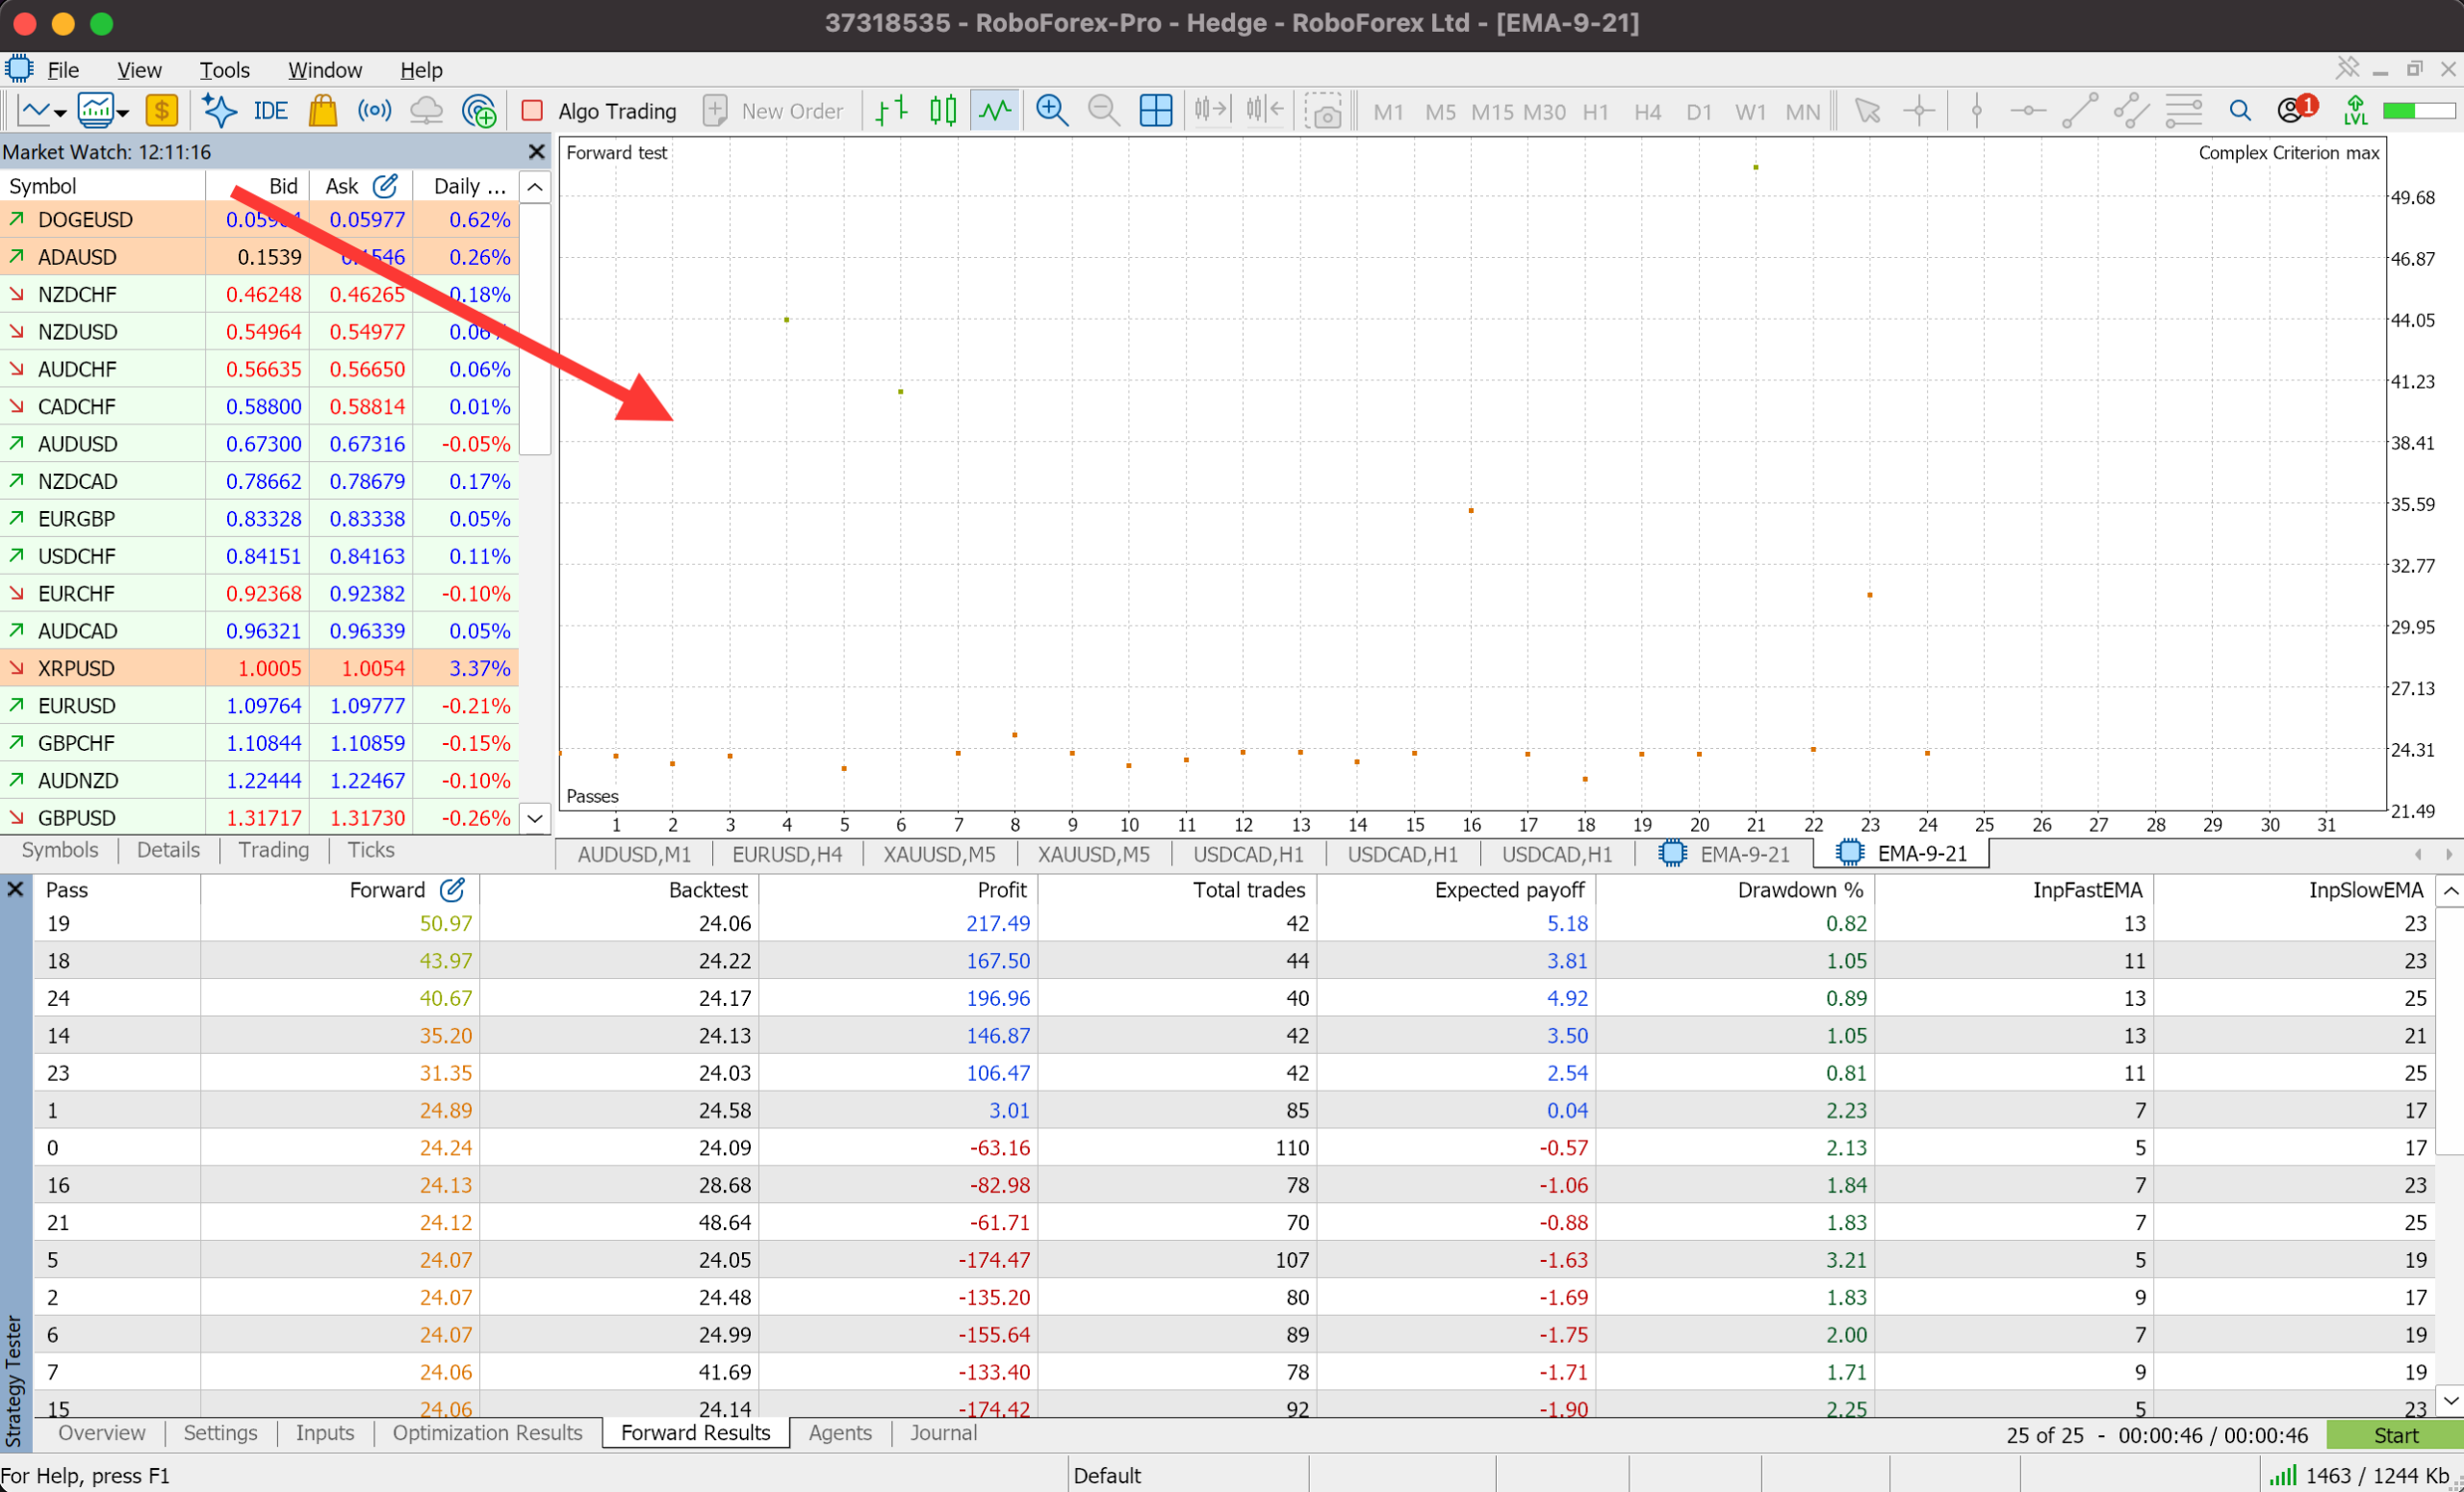
Forward Results: Compare Backtest and Forward
In Forward Results the Backtest column holds a combination's score on the search period and the Forward column its score on the later prices. The Profit, Total trades and Drawdown columns describe the forward period. Find the same Pass in Optimization Results to compare profit, drawdown and the number of trades on both parts.
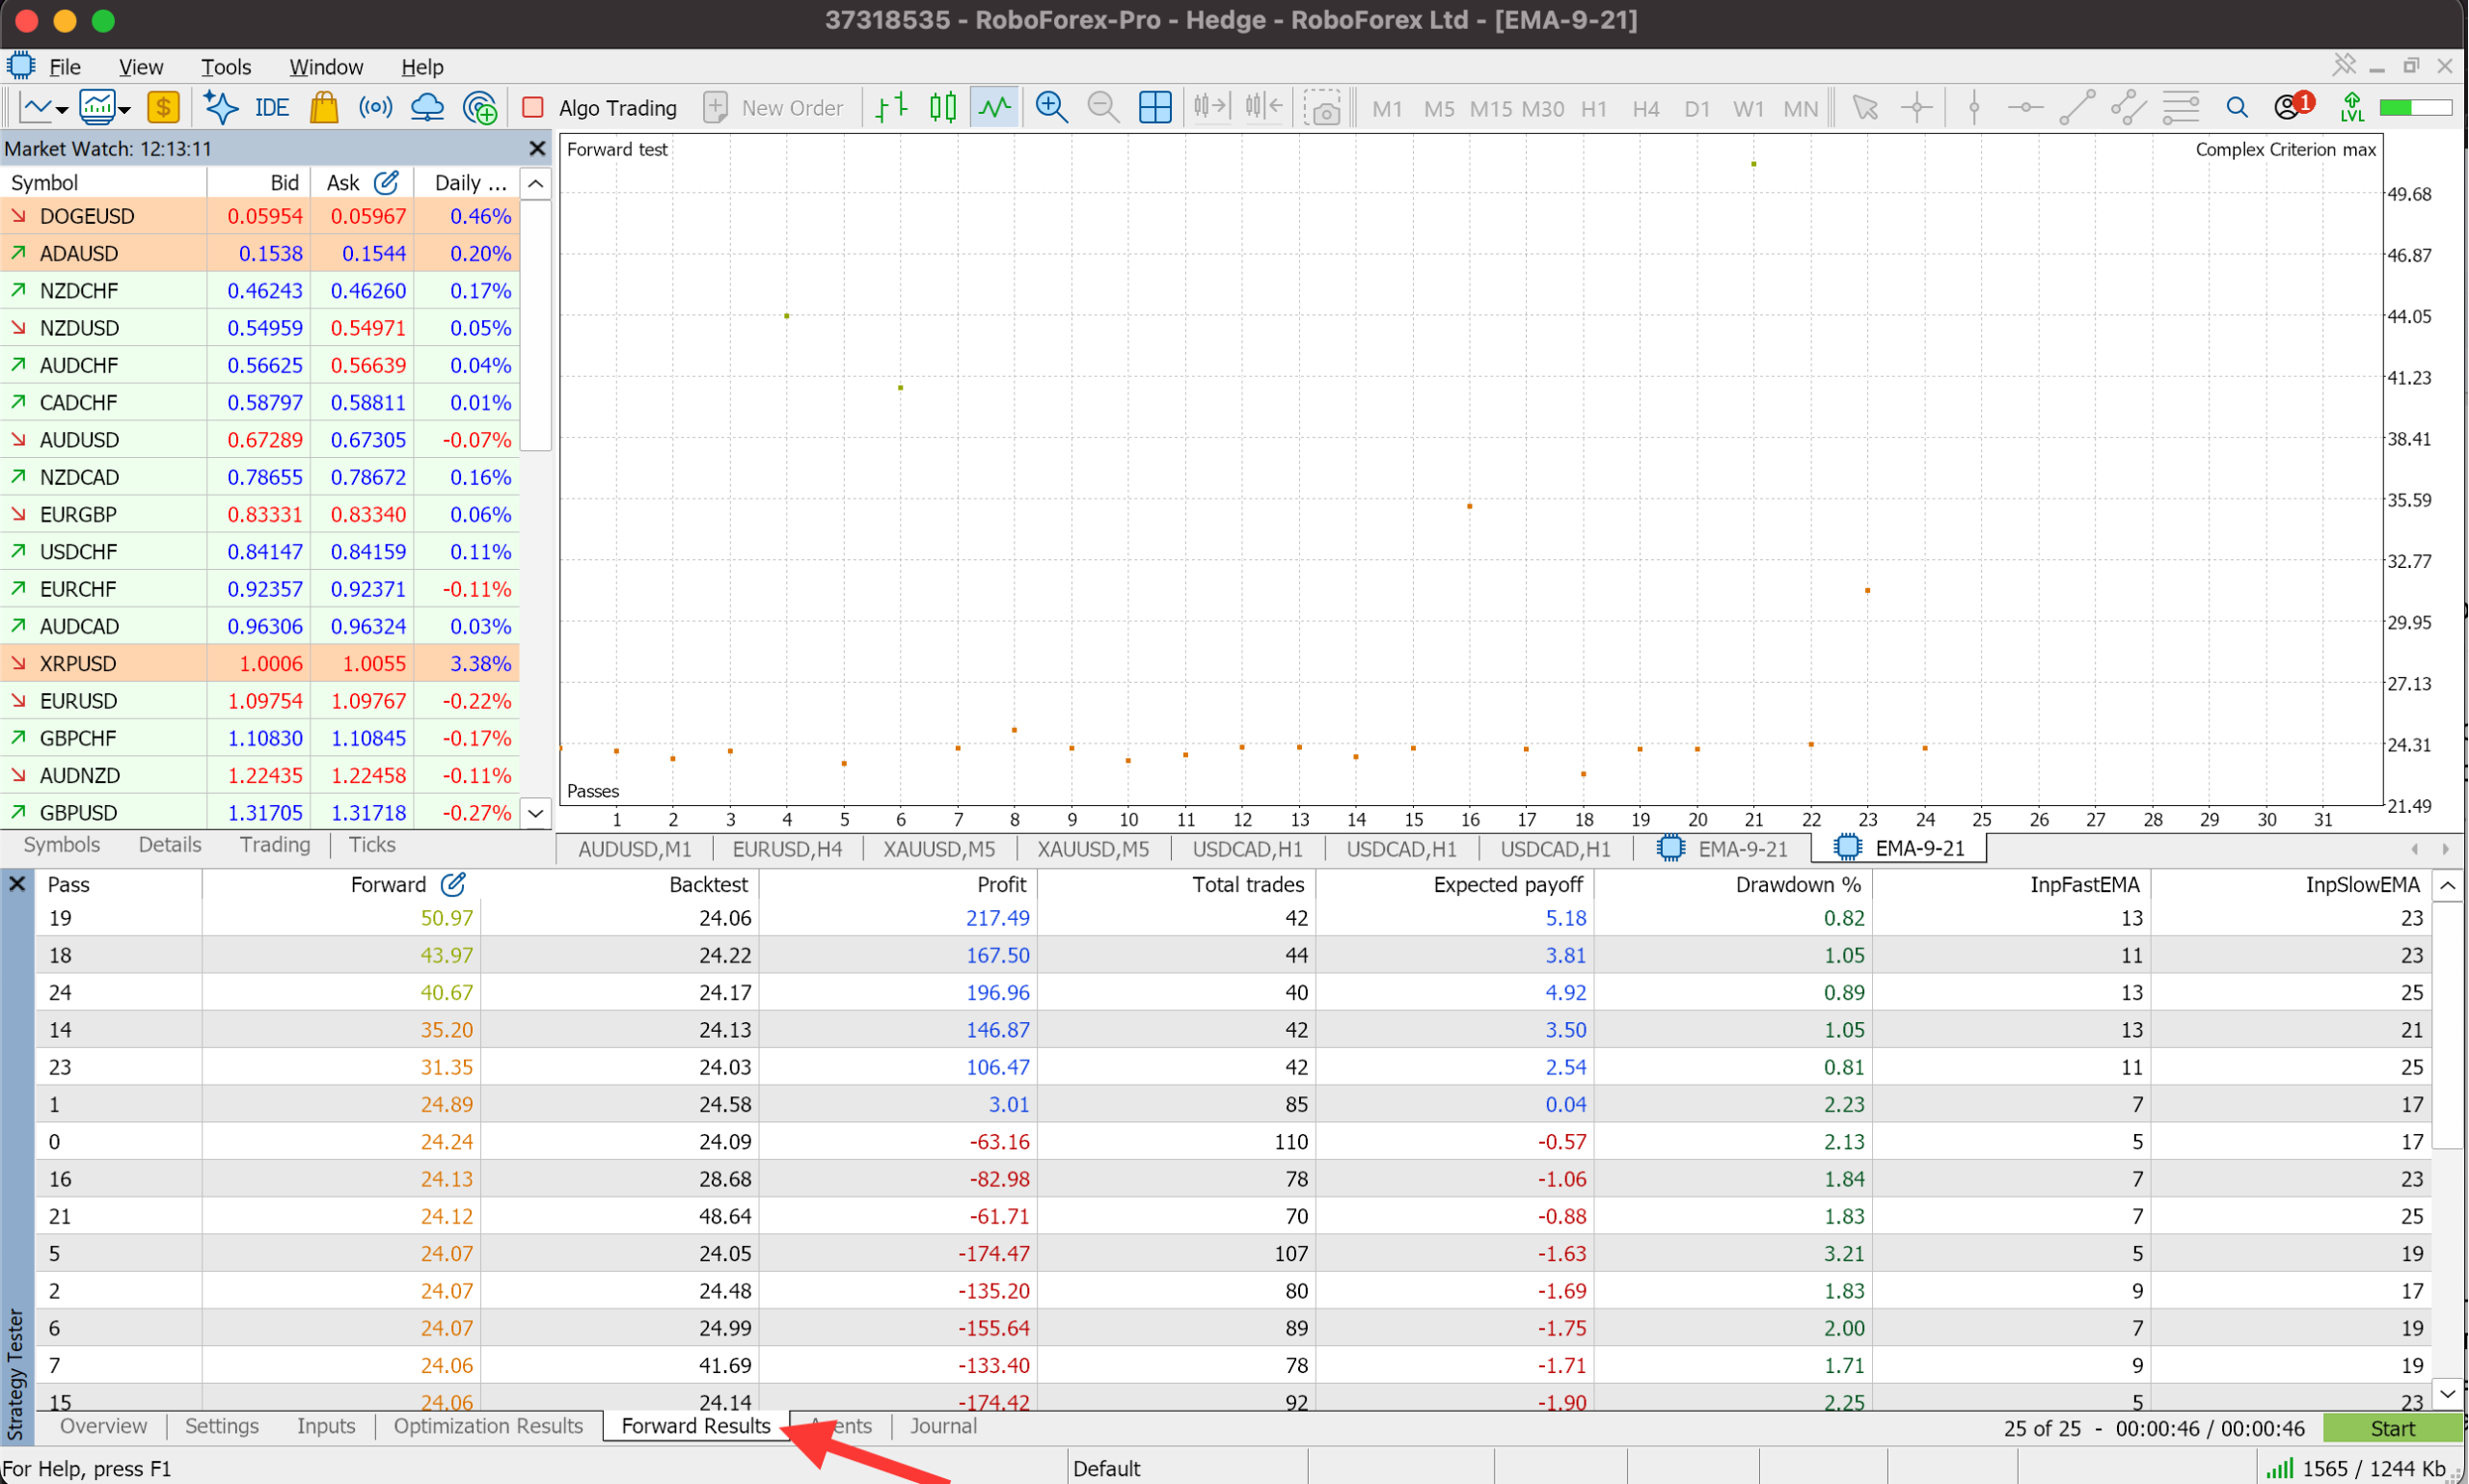
Two rows of this table tell opposite stories. Pass 21, EMA 7 and 25, has the highest Backtest score in it, 48.64, and ends the forward period with a loss of 61.71 USD. Pass 19, EMA 13 and 23, scored 24.06 on the search period and finished the forward period 217.49 USD up on 42 trades. A result that weakens sharply on the second part points to curve fitting or to a robot that suited one stretch of the market.
How Do You Pick Settings That Hold Up?
Pick a combination that sits on a plateau, where neighbouring values score close to it, and whose forward result keeps the direction of the backtest. A lone peak, where one value beats its neighbours by a wide margin, is the classic picture of overfitting in trading.
Plateau
Close results on neighbouring steps. A small change in the market moves the result a little.
Peak
A high result on one value only. A one-step shift loses most of it.
Schematic: criterion score by fast EMA period, one step apart. The darker bar is the best combination.
Run three checks on each candidate.
- Move each EMA period one step up and one step down and compare the scores. Boris Armenteros, in the MQL5 blog post Over-Optimization in Strategy Tester, calls a result fragile when one step costs more than 30% of the score.
- Compare the Backtest and Forward columns for the same Pass. A combination that made money on the search period and loses on the forward period points to overfitting or to a dependence on one stretch of history.
- Check the number of trades and the drawdown on both parts. A score built on a few trades says little. How many trades are enough depends on how often the strategy trades and how long the test runs, and no single drawdown limit fits every robot.
Apply the checks to the Forward Results above. Pass 19, EMA 13 and 23, is surrounded by passes 18, 24, 14 and 23, the combinations one step away. All four also finished the forward period in profit, from 106.47 to 196.96 USD, on 40 to 44 trades each. That cluster around 11 to 13 and 21 to 25 is a plateau. Pass 21 sits alone at the top of the Backtest column and fails the second check.
One caution about this table. Pass 19 tops the Forward column, but choosing a combination by its forward score uses the forward prices to make the choice, and they stop being unseen. Pick the plateau from the search results first, then use the forward part as a pass or fail check on that choice.
Test Robots in RoboForex MetaTrader 5
The Strategy Tester with optimisation and forward checks is built into the desktop terminal.
How Do You Run a Rolling Walk Forward Analysis in MT5?
The MetaTrader 5 Strategy Tester splits a date range into a search part and a forward part once per run. A rolling walk forward analysis repeats that split on several date windows, and the terminal has no automatic mode for it. You move the dates by hand, with Custom chosen in the Forward field.
First fix the length of the search window, for example six months, and of the forward window, for example two months. Run the first cycle and note the combination you would keep. Then shift both windows two months forward and run the optimisation again. Each shift adds one cycle.
For cycle 1 in the table below, set the test dates from 1 Jan 2025 to 31 Aug 2025, choose Custom in the Forward field and enter 1 Jul 2025. For cycle 2, change the dates to 1 Mar to 31 Oct 2025 and the forward date to 1 Sep 2025.
Below are four cycles for the same EMA crossover robot. Every cycle used XAU/USD on the H1 chart and the Complex Criterion max. Three forward windows ended in a loss and one in a profit of 259.60 USD.
Jan 2025Jul 20252026
Forward result1
Search
Loss 56.18 USD
2
Search
Loss 80.72 USD
3
Search
Loss 121.70 USD
4
Search
Profit 259.60 USD
Search window, 6 monthsForward window, 2 months
| Cycle | Search window | Forward window | EMA pair | Backtest score | Forward score | Forward result |
|---|---|---|---|---|---|---|
| 1 | 1 Jan to 30 Jun 2025 | 1 Jul to 31 Aug 2025 | 7 and 23 | 70.39 | 17.69 | Loss 56.18 USD, 45 trades, drawdown 2.47% |
| 2 | 1 Mar to 31 Aug 2025 | 1 Sep to 31 Oct 2025 | 13 and 25 | 78.26 | 1.14 | Loss 80.72 USD, 25 trades, drawdown 1.95% |
| 3 | 1 May to 31 Oct 2025 | 1 Nov to 31 Dec 2025 | 9 and 25 | 47.15 | 7.46 | Loss 121.70 USD, 36 trades, drawdown 2.40% |
| 4 | 1 Jul to 31 Dec 2025 | 1 Jan to 28 Feb 2026 | 9 and 17 | 45.33 | 27.47 | Profit 259.60 USD, 38 trades, drawdown 1.55% |
Three of the four forward windows ended in a loss, though every search window scored high. The best pair also changed with each shift of the dates. In this test, first place by the criterion did not carry into profit on the next stretch of history, and the bare crossover of two moving averages, with no extra filters, did not stay in profit across the four forward windows. If your own forward windows lose money, widening the ranges and rerunning until one window looks good fits the settings to the same prices again. Change the idea itself: try another timeframe or symbol, add a rule such as a trend filter, and run the cycles again on a longer history.
Four Fixes for a Clean Optimisation Run
Get Enough Combinations Into Forward Results
A small search gives a short Forward Results table. Wider ranges or a smaller step add combinations, and the run takes longer.
Get Repeatable Results From a Genetic Search
Fast genetic based algorithm skips part of the combinations and stops once several generations in a row bring no better score by the criterion. Its first sets of inputs are random, so two runs can end with different leaders. When every combination has to be tested, use Slow complete algorithm, as long as the run time stays reasonable.
Find the Cause of Empty Results or Zero Trades
Start with the Journal tab, which lists the tester's messages, errors included. Then check that at least one input is ticked on the Inputs tab, that the terminal has price history for the chosen dates, and that a Custom forward date falls inside the test range. If the run completes with zero trades, look at the symbol, the timeframe and any filters in the robot that cut the number of signals.
Double-Check a Result That Looks Too Good
A large profit with a tiny drawdown on the search period calls for a look at the forward period first. Open the passes one step away from it: if their scores are more than 30% lower, the top result is a peak by the rule from the section on picking settings. A standout result needs that extra check, and on its own it does not prove the inputs were fitted to history.
What to Do After Optimisation
Once the chosen inputs have held on the forward part of the history, the robot moves to live prices in three stages.
- Demo accountLive quotes, virtual money, a check of every order the robot sends
- ProCent accountReal money and real execution at the smallest trade size
- Standard account and VPSA separate decision on risk, with the terminal running around the clock
On the demo account, run the robot with the chosen inputs. Check that trades open and close, that Stop Loss and Take Profit work and that the results look like the tests. How long this takes depends on the strategy and the number of trades; a few trades over a short period give too little to judge. A demo account shows technical problems, though it cannot fully reproduce how real orders are filled.
The next stage can be a ProCent account. In RoboForex MetaTrader 5 the smallest trade size there is 0.01 lot, so the robot trades on real conditions with a small position, and the money at risk is real.
Moving to a standard account is a decision of its own, made on the robot's live results, the losses it can bring and the risk you accept. A RoboForex VPS keeps the terminal and the robot running when your computer is off. Hosting a robot on a VPS has no effect on how profitable the strategy is.
Conclusion
Walk forward optimisation checks a robot's inputs on history that played no part in choosing them, and even steady results there do not promise the same in the future. Take the EMA robot, set the ranges from Step 1, choose 1/3 or 1/4 in the Forward field and compare the Backtest and Forward columns for the combinations on your own plateau. Run your robot in MetaTrader 5 on a demo account before any real-money account.
FAQ
What is the difference between backtesting and walk forward optimisation?
A plain backtest checks one set of inputs on the chosen history. Walk forward optimisation splits the history in two: the tester searches for the best inputs on the first part and checks them on the second, which played no part in the search.
Does walk forward optimisation remove overfitting?
It lowers the risk and helps you drop weak inputs early. A combination with a high profit in the search period and a loss in the forward period may be fitted to that history by chance, and the forward check shows it.
Which optimisation criterion should I choose in MetaTrader 5?
For a first look at the inputs, Complex Criterion max is a reasonable choice. It combines the number of trades, drawdown and several performance measures into one score.
What forward period should I set in the MT5 Strategy Tester?
No ratio fits every robot. 1/3 or 1/4 keeps most of the history for the search and leaves the last third or quarter for the check. Make sure the forward part still holds enough trades. To start the check on an exact date, choose Custom in the same list.
Why does the forward test run fewer passes than the optimisation?
MetaTrader 5 sends only the best runs to the forward period: 10% after a complete search and 25% after a genetic one, topped up to 256 runs. If the search had fewer than 256 runs, all of them are checked.
How many trades do you need for walk forward optimisation?
MetaTrader 5 sets no minimum, and no single figure fits every robot. The number depends on how often the strategy trades and how long the test runs. Make sure both the search part and the forward part hold enough trades that one or two of them cannot decide the result.
Should I optimise lot size and Stop Loss?
The tester allows it, but traders usually keep both fixed. Lot size belongs to money management and says nothing about the quality of the signal. A searched Stop Loss tends to drift wide, which hides losses on history and raises the risk on a live account.
- A 15-Minute Backtest: How to Test a Trading Robot in MetaTrader 5: the plain test to run before any optimisation.
- Trading Robot Settings Explained: Lot Size, Stops and Magic Number: the risk inputs this guide keeps fixed.
- Trading Robot Checklist: 15 Checks From Installed to First Trade: the full path from installing a robot to its first live trade.
- Automated Trading Strategies: How to Turn Your Idea Into Rules a Robot Can Execute: where the rules you optimise come from.
Any information provided in articles on this website is based solely on the personal opinions of the authors. These articles should not be construed as trading recommendations or a call to action. The authors and RoboForex accept no responsibility for the results of any trades made on the basis of these recommendations and reviews. Past performance is not indicative of future results. Trading stocks and CFDs involves a high risk of capital loss.